Races in Fountainbleau, Florida (FL) Detailed Stats
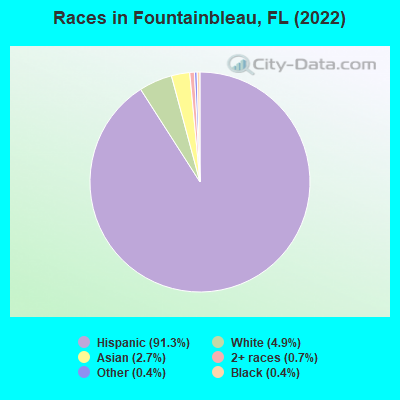
According to 2022 data, the most numerous races in Fountainbleau, FL are White alone (2,809 residents), Hispanic (51,820 residents), and Black alone (232 residents). 8.0% of Fountainbleau residents speak English at home. 73.2% of Fountainbleau, FL residents are foreign-born (69.7% born in Latin America), which is 71.3% greater than the foreign-born rate of 21.0% across the entire state of Florida.
Race distribution in Fountainbleau
2000 2022
10,458,509 65.4% White alone 2,682,715 16.8% Hispanic 2,264,268 14.2% Black alone 261,693 1.6% Asian alone 236,954 1.5% Two or more races 42,358 0.3% American Indian alone 28,994 0.2% Other race alone 6,887 0.04% Native Hawaiian and Other
11,309,403 50.8% White alone 6,025,039 27.1% Hispanic 3,241,015 14.6% Black alone 861,630 3.9% Two or more races 623,692 2.8% Asian alone 152,054 0.7% Other race alone 22,504 0.1% American Indian alone 9,486 0.04% Native Hawaiian and Other
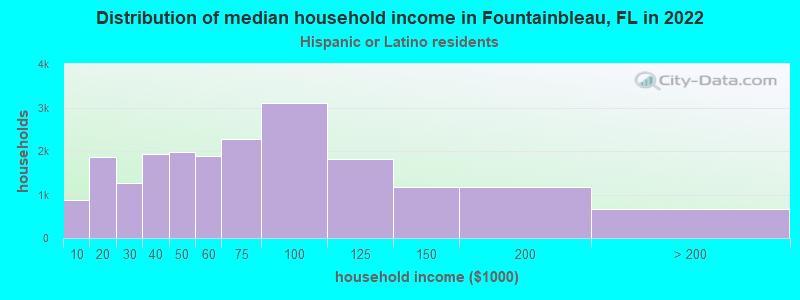
Income and house value in Fountainbleau Median household income in 2022 $76,193 White non-Hispanic householders$54,867 Black householders$107,854 Asian householders$67,621 Some other race householders$56,344 Two or more races householders$61,291 Hispanic or Latino race householdersMedian 2022 house value $421,663 White Non-Hispanic householders$398,950 Black or African American householders $357,919 Asian householders$351,691 Some other race householders$361,949 Two or more races householders$391,989 Hispanic or Latino householders
Median age by race in Fountainbleau
38.3 Median age for White residents37.8 40.0 50.2 Median age for Black or African American residents52.1 45.7 28.0 Median age for American Indian / Alaska Native residents23.4 -762,696,213.5 32.8 Median age for Asian residents33.9 32.5 -679,849,340.2 Median age for Native Hawaiian / Pacific Islander residents-858,307,848.3 -443,298,968.6 41.7 Median age for Other race residents42.7 39.8 46.1 Median age for Two or more races residents39.4 50.7 26.2 Median age for White alone residents27.4 26.1 44.4 Median age for Hispanic or Latino residents41.7 47.1
Owner/renter occupied households by race in Fountainbleau
House owners and renters - White residents 3,212 45.4% Owner occupied3,863 54.6% Renter occupiedHouse owners and renters - Black or African American residents 122 43.0% Owner occupied161 57.0% Renter occupiedHouse owners and renters - American Indian / Alaska Native residents 3 66.2% Owner occupied2 33.8% Renter occupiedHouse owners and renters - Asian residents 209 27.4% Owner occupied553 72.6% Renter occupiedHouse owners and renters - Other race residents 550 40.7% Owner occupied800 59.3% Renter occupiedHouse owners and renters - Two or more races residents 6,158 51.6% Owner occupied5,770 48.4% Renter occupiedHouse owners and renters - White alone residents 277 38.9% Owner occupied436 61.1% Renter occupiedHouse owners and renters - Hispanic or Latino residents 9,365 46.8% Owner occupied10,631 53.2% Renter occupied
Language usage in Fountainbleau
English speakers - Total 8.0% of residents of Fountainbleau speak English at home.
88.3% of residents speak Spanish at home 21,552 44.6% Speak English very well26,759 55.4% Speak English less than very well3.8% of residents speak other language at home 1,677 81.4% Speak English very well383 18.6% Speak English less than very well
English speakers - Born in the United States 33.8% of residents of Fountainbleau speak English at home.
63.3% of residents speak Spanish at home 1,165 76.8% Speak English very well352 23.2% Speak English less than very well1.9% of residents speak other language at home 45 100.0% Speak English very well
English speakers - Native, born elsewhere 13.4% of residents of Fountainbleau speak English at home.
82.5% of residents speak Spanish at home 992 74.1% Speak English very well346 25.9% Speak English less than very well1.2% of residents speak other language at home 6 31.6% Speak English very well13 68.4% Speak English less than very well
English speakers - Foreign-born 4.8% of residents of Fountainbleau speak English at home.
91.1% of residents speak Spanish at home 12,289 32.7% Speak English very well25,254 67.3% Speak English less than very well4.2% of residents speak other language at home 1,423 81.4% Speak English very well326 18.6% Speak English less than very well
White (Caucasian) - Speak only English Native:
24.1% (1,591)Foreign-born:
7.9% (788)
White (Caucasian) - Speak another language Native:
65.1% (4,297)Foreign-born:
91.4% (9,103)
Black or African American - Speak only English Native:
73.8% (137)Foreign-born:
24.4% (52)
Black or African American - Speak another language Native:
26.2% (49)Foreign-born:
75.2% (160)
American Indian / Alaska Native - Speak another language Native:
43.8% (5)Foreign-born:
98.3% (23)
Asian - Speak only English Native:
38.7% (96)Foreign-born:
7.8% (101)
Asian - Speak another language Native:
60.4% (150)Foreign-born:
94.3% (1,210)
Other race - Speak only English Native:
14.4% (136)Foreign-born:
5.6% (166)
Other race - Speak another language Native:
85.6% (813)Foreign-born:
94.4% (2,799)
Two or more races - Speak only English Native:
11.4% (647)Foreign-born:
3.2% (731)
Two or more races - Speak another language Native:
88.8% (5,031)Foreign-born:
96.6% (22,155)
White alone - Speak only English Native:
61.7% (1,047)Foreign-born:
17.1% (129)
White alone - Speak another language Native:
37.4% (636)Foreign-born:
80.6% (607)
Hispanic or Latino - Speak only English Native:
9.6% (1,085)Foreign-born:
4.4% (1,717)
Hispanic or Latino - Speak another language Native:
90.1% (10,243)Foreign-born:
95.6% (37,237)
Foreign-born residents in Fountainbleau 41,541 residents are foreign born (69.7% Latin America ).
This city:
73.2%Florida:
21.1%
Marital status for residents in Fountainbleau Marital status - White (Caucasian) population 15 years and over
Males 32.5% Never married50.0% Now married2.1% Separated2.2% Widowed13.2% DivorcedFemales 31.4% Never married40.4% Now married2.4% Separated9.6% Widowed16.2% DivorcedWomen who gave birth in the past 12 months Now married:
30.8% (45)Unmarried:
69.2% (101)
Women who did not give birth in the past 12 months Now married:
43.5% (1,987)Unmarried:
56.5% (2,581)
Marital status - Black or African American population 15 years and over
Males 56.7% Never married25.0% Now married0.0% Separated4.6% Widowed13.7% DivorcedFemales 57.9% Never married3.4% Now married8.3% Separated30.3% Widowed0.0% DivorcedWomen who did not give birth in the past 12 months Now married:
18.9% (16)Unmarried:
81.1% (68)
Marital status - American Indian / Alaska Native population 15 years and over
Males 7.1% Never married92.9% Now married0.0% Separated0.0% Widowed0.0% DivorcedFemales 60.0% Never married40.0% Now married0.0% Separated0.0% Widowed0.0% DivorcedWomen who did not give birth in the past 12 months Now married:
0.0% (0)Unmarried:
100.0% (10)
Marital status - Asian population 15 years and over
Males 19.0% Never married78.0% Now married0.0% Separated1.5% Widowed1.4% DivorcedFemales 22.5% Never married47.0% Now married2.6% Separated2.2% Widowed25.8% DivorcedWomen who gave birth in the past 12 months Now married:
100.0% (29)Unmarried:
0.0% (0)
Women who did not give birth in the past 12 months Now married:
46.7% (267)Unmarried:
53.3% (304)
Marital status - Other race population 15 years and over
Males 35.6% Never married43.5% Now married2.4% Separated1.4% Widowed17.1% DivorcedFemales 21.5% Never married42.0% Now married4.8% Separated6.6% Widowed25.3% DivorcedWomen who gave birth in the past 12 months Now married:
100.0% (38)Unmarried:
0.0% (0)
Women who did not give birth in the past 12 months Now married:
58.2% (541)Unmarried:
41.8% (389)
Marital status - Two or more races population 15 years and over
Males 38.0% Never married50.1% Now married1.2% Separated3.7% Widowed6.9% DivorcedFemales 25.0% Never married39.0% Now married4.3% Separated12.0% Widowed19.7% DivorcedWomen who gave birth in the past 12 months Now married:
60.7% (54)Unmarried:
39.3% (35)
Women who did not give birth in the past 12 months Now married:
48.3% (3,159)Unmarried:
51.7% (3,384)
Marital status - White alone, not Hispanic / Latino population 15 years and over
Males 45.1% Never married36.9% Now married1.6% Separated3.5% Widowed12.9% DivorcedFemales 46.2% Never married41.3% Now married0.0% Separated5.6% Widowed6.9% DivorcedWomen who gave birth in the past 12 months Now married:
100.0% (12)Unmarried:
0.0% (0)
Women who did not give birth in the past 12 months Now married:
43.7% (292)Unmarried:
56.3% (376)
Marital status - Hispanic or Latino population 15 years and over
Males 33.7% Never married50.5% Now married1.8% Separated2.6% Widowed11.4% DivorcedFemales 28.2% Never married39.9% Now married3.2% Separated10.4% Widowed18.2% DivorcedWomen who gave birth in the past 12 months Now married:
38.9% (127)Unmarried:
61.1% (200)
Women who did not give birth in the past 12 months Now married:
45.7% (5,511)Unmarried:
54.3% (6,536)
Ancestries in Fountainbleau
487 1.1% American290 0.6% Italian197 0.4% English160 0.4% Brazilian89 0.2% Arab79 0.2% Iranian55 0.1% German42 0.09% Portuguese40 0.09% Irish37 0.08% European35 0.08% Basque32 0.07% Scottish28 0.06% French28 0.06% Jamaican27 0.06% Scotch-Irish21 0.05% Russian21 0.05% Zimbabwean20 0.04% Bulgarian16 0.04% Jordanian14 0.03% British13 0.03% Croatian12 0.03% Bahamian11 0.02% Lebanese11 0.02% Canadian9 0.02% Greek9 0.02% Trinidadian and Tobagonian5 0.01% Austrian4 0.01% Polish3 0.01% Haitian
Geographical mobility in Fountainbleau Same house 1 year ago 16,368 84.7% White (Caucasian)275 68.7% Black or African American24 64.5% American Indian / Alaska Native1,061 62.5% Asian3,377 82.2% Other race27,218 94.0% Two or more races2,399 87.6% White alone, not Hispanic / Latino45,882 88.7% Hispanic or LatinoMoved within same county 2,030 10.5% White / Caucasian44 11.0% Black or African American11 29.0% American Indian / Alaska Native101 5.9% Asian264 6.4% Other race1,101 3.8% Two or more races170 6.2% White alone, not Hispanic / Latino3,779 7.3% Hispanic or LatinoMoved within same state 216 1.1% White / Caucasian7 1.9% Black or African American21 0.5% Other race25 0.1% Two or more races69 2.5% White alone, not Hispanic / Latino300 0.6% Hispanic or LatinoMoved from different state 113 0.6% White / Caucasian82 20.5% Black or African American260 15.3% Asian222 5.4% Other race149 0.5% Two or more races41 1.5% White alone, not Hispanic / Latino264 0.5% Hispanic or LatinoMoved from abroad 323 1.7% White319 18.8% Asian318 7.7% Other race388 1.3% Two or more races25 0.9% White alone, not Hispanic / Latino1,251 2.4% Hispanic or Latino
Children Nativity (place of birth) in Fountainbleau
Children under 6 years - Living with two parents Both parents native 273 100.0% NativeBoth parents foreign-born 847 78.9% Native227 21.1% Foreign-bornOne native, one foreign-born parent 165 100.0% NativeChildren under 6 years - Living with one parent Native parent 256 78.9% Native69 21.1% Foreign-bornForeign-born parent 476 78.1% Native133 21.9% Foreign-bornChildren 6 to 17 years - Living with two parents Both parents native 509 93.9% Native33 6.1% Foreign-bornBoth parents foreign-born 1,336 48.7% Native1,405 51.3% Foreign-bornOne native, one foreign-born parent 465 95.2% Native23 4.8% Foreign-bornChildren 6 to 17 years - Living with one parent Foreign-born parent 1,911 58.4% Native1,364 41.6% Foreign-born
Place of birth for residents in Fountainbleau 39,758 Americas39,729 Latin America20,972 Caribbean13,246 South America5,510 Central America1,433 Asia1,065 South Central Asia261 Europe192 Eastern Asia167 China156 Southern Europe119 Western Asia86 Africa56 Southern Africa55 South Eastern Asia50 Eastern Europe39 Northern Europe28 Northern America20 Eastern Africa13 Western Europe8 Northern Africa19,835 Cuba6,144 Venezuela4,308 Colombia3,148 Nicaragua1,121 Honduras1,002 Dominican Republic835 India655 Peru516 Argentina441 Chile412 Brazil408 El Salvador402 Mexico388 Ecuador246 Guatemala240 Bolivia126 China102 Spain92 Panama89 Costa Rica89 Pakistan66 Bangladesh61 Uruguay59 Iran56 South Africa55 Philippines53 Italy52 Jamaica49 Kuwait43 Trinidad and Tobago40 Taiwan34 United Kingdom31 Turkey28 Canada27 Bulgaria23 Grenada21 Jordan20 Zimbabwe12 Croatia12 Bahamas12 Kazakhstan12 Korea11 United Arab Emirates11 Japan8 Germany8 Algeria7 Russia4 Austria4 Sweden3 Israel1 Ukraine
Grandparents responsible for own grandchildren in Fountainbleau
Grandparents (30 to 59 years) White / Caucasian 19 7.7% Responsible for grandchildren231 92.3% Not responsible for grandchildrenAsian 32 100.0% Not responsible for grandchildrenOther race 31 100.0% Not responsible for grandchildrenTwo or more races 19 5.4% Responsible for grandchildren342 94.6% Not responsible for grandchildrenWhite alone, not Hispanic / Latino 7 100.0% Not responsible for grandchildrenHispanic or Latino 43 7.4% Responsible for grandchildren543 92.6% Not responsible for grandchildrenGrandparents (60 years and over) White / Caucasian 20 3.8% Responsible for grandchildren500 96.2% Not responsible for grandchildrenOther race 28 16.6% Responsible for grandchildren141 83.4% Not responsible for grandchildrenTwo or more races 23 4.3% Responsible for grandchildren508 95.7% Not responsible for grandchildrenWhite alone, not Hispanic / Latino 30 100.0% Not responsible for grandchildrenHispanic or Latino 100 8.7% Responsible for grandchildren1,055 91.3% Not responsible for grandchildren