Races in Fort Campbell North, Kentucky (KY) Detailed Stats
Data:
Races - White alone (%)
Races - White alone (% change since 2000)
Races - Black alone (%)
Races - Black alone (% change since 2000)
Races - American Indian alone (%)
Races - American Indian alone (% change since 2000)
Races - Asian alone (%)
Races - Asian alone (% change since 2000)
Races - Hispanic (%)
Races - Hispanic (% change since 2000)
Races - Native Hawaiian and Other Pacific Islander alone (%)
Races - Native Hawaiian and Other Pacific Islander alone (% change since 2000)
Races - Two or more races(%)
Races - Two or more races(% change since 2000)
Races - Other race alone (%)
Races - Other race alone (% change since 2000)
Racial diversity
Place of birth - Born in state of residence (%)
Place of birth - Born in state of residence (%) - White
Place of birth - Born in state of residence (%) - Black or African American
Place of birth - Born in state of residence (%) - Asian
Place of birth - Born in state of residence (%) - Hispanic or Latino
Place of birth - Born in state of residence (%) - American Indian and Alaska Native
Place of birth - Born in state of residence (%) - Multirace
Place of birth - Born in state of residence (%) - Other Race
Place of birth - Born in other state (%)
Place of birth - Born in other state (%) - White
Place of birth - Born in other state (%) - Black or African American
Place of birth - Born in other state (%) - Asian
Place of birth - Born in other state (%) - Hispanic or Latino
Place of birth - Born in other state (%) - American Indian and Alaska Native
Place of birth - Born in other state (%) - Multirace
Place of birth - Born in other state (%) - Other Race
Place of birth - Native, outside of US (%)
Place of birth - Native, outside of US (%) - White
Place of birth - Native, outside of US (%) - Black or African American
Place of birth - Native, outside of US (%) - Asian
Place of birth - Native, outside of US (%) - Hispanic or Latino
Place of birth - Native, outside of US (%) - American Indian and Alaska Native
Place of birth - Native, outside of US (%) - Multirace
Place of birth - Native, outside of US (%) - Other Race
Place of birth - Foreign born (%)
Place of birth - Foreign born (%) - White
Place of birth - Foreign born (%) - Black or African American
Place of birth - Foreign born (%) - Asian
Place of birth - Foreign born (%) - Hispanic or Latino
Place of birth - Foreign born (%) - American Indian and Alaska Native
Place of birth - Foreign born (%) - Multirace
Place of birth - Foreign born (%) - Other Race
Residents speaking English at home (%)
Residents speaking English at home - Born in the United States (%)
Residents speaking English at home - Native, born elsewhere (%)
Residents speaking English at home - Foreign born (%)
Residents speaking Spanish at home (%)
Residents speaking Spanish at home - Born in the United States (%)
Residents speaking Spanish at home - Native, born elsewhere (%)
Residents speaking Spanish at home - Foreign born (%)
Residents speaking other language at home (%)
Residents speaking other language at home - Born in the United States (%)
Residents speaking other language at home - Native, born elsewhere (%)
Residents speaking other language at home - Foreign born (%)
Marital status - Never married (%)
Marital status - Now married (%)
Marital status - Separated (%)
Marital status - Widowed (%)
Marital status - Divorced (%)
Ancestries Reported - Arab (%)
Ancestries Reported - Czech (%)
Ancestries Reported - Danish (%)
Ancestries Reported - Dutch (%)
Ancestries Reported - English (%)
Ancestries Reported - French (%)
Ancestries Reported - French Canadian (%)
Ancestries Reported - German (%)
Ancestries Reported - Greek (%)
Ancestries Reported - Hungarian (%)
Ancestries Reported - Irish (%)
Ancestries Reported - Italian (%)
Ancestries Reported - Lithuanian (%)
Ancestries Reported - Norwegian (%)
Ancestries Reported - Polish (%)
Ancestries Reported - Portuguese (%)
Ancestries Reported - Russian (%)
Ancestries Reported - Scotch-Irish (%)
Ancestries Reported - Scottish (%)
Ancestries Reported - Slovak (%)
Ancestries Reported - Subsaharan African (%)
Ancestries Reported - Swedish (%)
Ancestries Reported - Swiss (%)
Ancestries Reported - Ukrainian (%)
Ancestries Reported - United States (%)
Ancestries Reported - Welsh (%)
Ancestries Reported - West Indian (%)
Ancestries Reported - Other (%)
Geographical mobility - Same house 1 year ago (%)
Geographical mobility - Same house 1 year ago (%) - White
Geographical mobility - Same house 1 year ago (%) - Black or African American
Geographical mobility - Same house 1 year ago (%) - Asian
Geographical mobility - Same house 1 year ago (%) - Hispanic or Latino
Geographical mobility - Same house 1 year ago (%) - American Indian and Alaska Native
Geographical mobility - Same house 1 year ago (%) - Multirace
Geographical mobility - Same house 1 year ago (%) - Other Race
Geographical mobility - Moved within same county (%)
Geographical mobility - Moved within same county (%) - White
Geographical mobility - Moved within same county (%) - Black or African American
Geographical mobility - Moved within same county (%) - Asian
Geographical mobility - Moved within same county (%) - Hispanic or Latino
Geographical mobility - Moved within same county (%) - American Indian and Alaska Native
Geographical mobility - Moved within same county (%) - Multirace
Geographical mobility - Moved within same county (%) - Other Race
Geographical mobility - Moved from different county within same state (%)
Geographical mobility - Moved from different county within same state (%) - White
Geographical mobility - Moved from different county within same state (%) - Black or African American
Geographical mobility - Moved from different county within same state (%) - Asian
Geographical mobility - Moved from different county within same state (%) - Hispanic or Latino
Geographical mobility - Moved from different county within same state (%) - American Indian and Alaska Native
Geographical mobility - Moved from different county within same state (%) - Multirace
Geographical mobility - Moved from different county within same state (%) - Other Race
Geographical mobility - Moved from different state (%)
Geographical mobility - Moved from different state (%) - White
Geographical mobility - Moved from different state (%) - Black or African American
Geographical mobility - Moved from different state (%) - Asian
Geographical mobility - Moved from different state (%) - Hispanic or Latino
Geographical mobility - Moved from different state (%) - American Indian and Alaska Native
Geographical mobility - Moved from different state (%) - Multirace
Geographical mobility - Moved from different state (%) - Other Race
Geographical mobility - Moved from abroad (%)
Geographical mobility - Moved from abroad (%) - White
Geographical mobility - Moved from abroad (%) - Black or African American
Geographical mobility - Moved from abroad (%) - Asian
Geographical mobility - Moved from abroad (%) - Hispanic or Latino
Geographical mobility - Moved from abroad (%) - American Indian and Alaska Native
Geographical mobility - Moved from abroad (%) - Multirace
Geographical mobility - Moved from abroad (%) - Other Race
Place of birth for the foreign-born population - Ireland (%)
Place of birth for the foreign-born population - Denmark (%)
Place of birth for the foreign-born population - Norway (%)
Place of birth for the foreign-born population - Sweden (%)
Place of birth for the foreign-born population - United Kingdom (%)
Place of birth for the foreign-born population - England (%)
Place of birth for the foreign-born population - Scotland (%)
Place of birth for the foreign-born population - Other Northern Europe (%)
Place of birth for the foreign-born population - Austria (%)
Place of birth for the foreign-born population - Belgium (%)
Place of birth for the foreign-born population - France (%)
Place of birth for the foreign-born population - Germany (%)
Place of birth for the foreign-born population - Netherlands (%)
Place of birth for the foreign-born population - Switzerland (%)
Place of birth for the foreign-born population - Other Western Europe (%)
Place of birth for the foreign-born population - Greece (%)
Place of birth for the foreign-born population - Italy (%)
Place of birth for the foreign-born population - Portugal (%)
Place of birth for the foreign-born population - Spain (%)
Place of birth for the foreign-born population - Other Southern Europe (%)
Place of birth for the foreign-born population - Albania (%)
Place of birth for the foreign-born population - Belarus (%)
Place of birth for the foreign-born population - Bosnia and Herzegovina (%)
Place of birth for the foreign-born population - Bulgaria (%)
Place of birth for the foreign-born population - Croatia (%)
Place of birth for the foreign-born population - Czechoslovakia (%)
Place of birth for the foreign-born population - Hungary (%)
Place of birth for the foreign-born population - Latvia (%)
Place of birth for the foreign-born population - Lithuania (%)
Place of birth for the foreign-born population - North Macedonia (Macedonia) (%)
Place of birth for the foreign-born population - Moldova (%)
Place of birth for the foreign-born population - Poland (%)
Place of birth for the foreign-born population - Romania (%)
Place of birth for the foreign-born population - Russia (%)
Place of birth for the foreign-born population - Serbia (%)
Place of birth for the foreign-born population - Ukraine (%)
Place of birth for the foreign-born population - Other Eastern Europe (%)
Place of birth for the foreign-born population - China (%)
Place of birth for the foreign-born population - Hong Kong (%)
Place of birth for the foreign-born population - Taiwan (%)
Place of birth for the foreign-born population - Japan (%)
Place of birth for the foreign-born population - Korea (%)
Place of birth for the foreign-born population - Other Eastern Asia (%)
Place of birth for the foreign-born population - Afghanistan (%)
Place of birth for the foreign-born population - Bangladesh (%)
Place of birth for the foreign-born population - India (%)
Place of birth for the foreign-born population - Iran (%)
Place of birth for the foreign-born population - Kazakhstan (%)
Place of birth for the foreign-born population - Nepal (%)
Place of birth for the foreign-born population - Pakistan (%)
Place of birth for the foreign-born population - Sri Lanka (%)
Place of birth for the foreign-born population - Uzbekistan (%)
Place of birth for the foreign-born population - Other South Central Asia (%)
Place of birth for the foreign-born population - Burma (%)
Place of birth for the foreign-born population - Cambodia (%)
Place of birth for the foreign-born population - Indonesia (%)
Place of birth for the foreign-born population - Laos (%)
Place of birth for the foreign-born population - Malaysia (%)
Place of birth for the foreign-born population - Philippines (%)
Place of birth for the foreign-born population - Singapore (%)
Place of birth for the foreign-born population - Thailand (%)
Place of birth for the foreign-born population - Vietnam (%)
Place of birth for the foreign-born population - Other South Eastern Asia (%)
Place of birth for the foreign-born population - Armenia (%)
Place of birth for the foreign-born population - Iraq (%)
Place of birth for the foreign-born population - Israel (%)
Place of birth for the foreign-born population - Jordan (%)
Place of birth for the foreign-born population - Kuwait (%)
Place of birth for the foreign-born population - Lebanon (%)
Place of birth for the foreign-born population - Saudi Arabia (%)
Place of birth for the foreign-born population - Syria (%)
Place of birth for the foreign-born population - Turkey (%)
Place of birth for the foreign-born population - Yemen (%)
Place of birth for the foreign-born population - Other Western Asia (%)
Place of birth for the foreign-born population - Eritrea (%)
Place of birth for the foreign-born population - Ethiopia (%)
Place of birth for the foreign-born population - Kenya (%)
Place of birth for the foreign-born population - Somalia (%)
Place of birth for the foreign-born population - Uganda (%)
Place of birth for the foreign-born population - Zimbabwe (%)
Place of birth for the foreign-born population - Other Eastern Africa (%)
Place of birth for the foreign-born population - Cameroon (%)
Place of birth for the foreign-born population - Congo (%)
Place of birth for the foreign-born population - Democratic Republic of Congo (Zaire) (%)
Place of birth for the foreign-born population - Other Middle Africa (%)
Place of birth for the foreign-born population - Egypt (%)
Place of birth for the foreign-born population - Morocco (%)
Place of birth for the foreign-born population - Sudan (%)
Place of birth for the foreign-born population - Other Northern Africa (%)
Place of birth for the foreign-born population - South Africa (%)
Place of birth for the foreign-born population - Other Southern Africa (%)
Place of birth for the foreign-born population - Cabo Verde (%)
Place of birth for the foreign-born population - Ghana (%)
Place of birth for the foreign-born population - Liberia (%)
Place of birth for the foreign-born population - Nigeria (%)
Place of birth for the foreign-born population - Senegal (%)
Place of birth for the foreign-born population - Sierra Leone (%)
Place of birth for the foreign-born population - Other Western Africa (%)
Place of birth for the foreign-born population - Australia (%)
Place of birth for the foreign-born population - New Zealand (%)
Place of birth for the foreign-born population - Fiji (%)
Place of birth for the foreign-born population - Micronesia (%)
Place of birth for the foreign-born population - Bahamas (%)
Place of birth for the foreign-born population - Barbados (%)
Place of birth for the foreign-born population - Cuba (%)
Place of birth for the foreign-born population - Dominica (%)
Place of birth for the foreign-born population - Dominican Republic (%)
Place of birth for the foreign-born population - Grenada (%)
Place of birth for the foreign-born population - Haiti (%)
Place of birth for the foreign-born population - Jamaica (%)
Place of birth for the foreign-born population - St. Vincent and the Grenadines (%)
Place of birth for the foreign-born population - Trinidad and Tobago (%)
Place of birth for the foreign-born population - West Indies (%)
Place of birth for the foreign-born population - Other Caribbean (%)
Place of birth for the foreign-born population - Belize (%)
Place of birth for the foreign-born population - Costa Rica (%)
Place of birth for the foreign-born population - El Salvador (%)
Place of birth for the foreign-born population - Guatemala (%)
Place of birth for the foreign-born population - Honduras (%)
Place of birth for the foreign-born population - Mexico (%)
Place of birth for the foreign-born population - Nicaragua (%)
Place of birth for the foreign-born population - Panama (%)
Place of birth for the foreign-born population - Other Central America (%)
Place of birth for the foreign-born population - Argentina (%)
Place of birth for the foreign-born population - Bolivia (%)
Place of birth for the foreign-born population - Brazil (%)
Place of birth for the foreign-born population - Chile (%)
Place of birth for the foreign-born population - Colombia (%)
Place of birth for the foreign-born population - Ecuador (%)
Place of birth for the foreign-born population - Guyana (%)
Place of birth for the foreign-born population - Peru (%)
Place of birth for the foreign-born population - Uruguay (%)
Place of birth for the foreign-born population - Venezuela (%)
Place of birth for the foreign-born population - Other South America (%)
Place of birth for the foreign-born population - Canada (%)
Place of birth for the foreign-born population - Other Northern America (%)
Place of birth for the foreign-born population - Other (%)
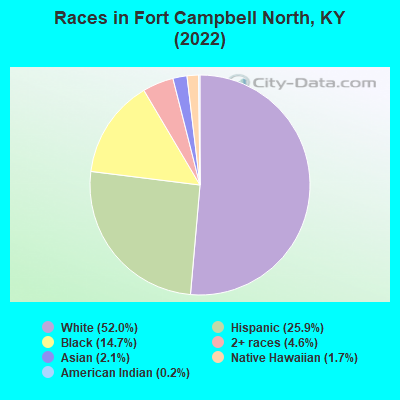
According to 2022 data, the most numerous races in Fort Campbell North, KY are White alone (6,268 residents), Black alone (1,776 residents), and Hispanic (3,123 residents). 75.2% of Fort Campbell North residents speak English at home. 4.9% of Fort Campbell North, KY residents are foreign-born (1.9% born in Asia, 1.0% born in Latin America, 1.0% born in Africa), which is 17.7% greater than the foreign-born rate of 4.0% across the entire state of Kentucky.
Race distribution in Fort Campbell North
2000 2022
3,608,013 89.3% White alone 293,639 7.3% Black alone 59,939 1.5% Hispanic 37,750 0.9% Two or more races 29,368 0.7% Asian alone 7,939 0.2% American Indian alone 3,846 0.10% Other race alone 1,275 0.03% Native Hawaiian and Other
3,710,998 82.2% White alone 343,194 7.6% Black alone 187,483 4.2% Hispanic 187,394 4.2% Two or more races 62,240 1.4% Asian alone 13,529 0.3% Other race alone 4,302 0.10% American Indian alone 3,170 0.07% Native Hawaiian and Other
Income and house value in Fort Campbell North Median household income in 2022 $67,981 White non-Hispanic householders$48,053 Black householders$50,832 Asian householders$42,762 Some other race householders$120,125 Two or more races householders$51,270 Hispanic or Latino race householdersMedian 2022 house value $-473,548,928 Black or African American householders
Median age by race in Fort Campbell North
22.2 Median age for White residents22.9 21.7 20.6 Median age for Black or African American residents20.3 19.6 23.8 Median age for American Indian / Alaska Native residents51.2 24.0 35.3 Median age for Asian residents27.4 36.6 20.4 Median age for Native Hawaiian / Pacific Islander residents23.4 2.4 20.0 Median age for Other race residents21.9 20.9 19.8 Median age for Two or more races residents19.3 6.4 21.7 Median age for White alone residents22.3 21.5 20.3 Median age for Hispanic or Latino residents22.0 15.5
Owner/renter occupied households by race in Fort Campbell North
House owners and renters - White residents 1,542 100.0% Renter occupiedHouse owners and renters - Black or African American residents 1 0.4% Owner occupied341 99.6% Renter occupiedHouse owners and renters - American Indian / Alaska Native residents 42 100.0% Renter occupiedHouse owners and renters - Asian residents 21 35.0% Owner occupied39 65.0% Renter occupiedHouse owners and renters - Native Hawaiian / Pacific Islander residents 6 100.0% Renter occupiedHouse owners and renters - Other race residents 213 100.0% Renter occupiedHouse owners and renters - Two or more races residents 157 100.0% Renter occupiedHouse owners and renters - White alone residents 1,198 100.0% Renter occupiedHouse owners and renters - Hispanic or Latino residents 785 100.0% Renter occupied
Language usage in Fort Campbell North
English speakers - Total 75.2% of residents of Fort Campbell North speak English at home.
17.7% of residents speak Spanish at home 1,580 87.0% Speak English very well237 13.0% Speak English less than very well10.1% of residents speak other language at home 857 83.1% Speak English very well174 16.9% Speak English less than very well
English speakers - Born in the United States 82.5% of residents of Fort Campbell North speak English at home.
16.3% of residents speak Spanish at home 1,289 91.8% Speak English very well115 8.2% Speak English less than very well3.4% of residents speak other language at home 283 95.9% Speak English very well12 4.1% Speak English less than very well
English speakers - Native, born elsewhere 17.1% of residents of Fort Campbell North speak English at home.
114.4% of residents speak Spanish at home 325 59.3% Speak English very well223 40.7% Speak English less than very well11.5% of residents speak other language at home 55 100.0% Speak English very well
English speakers - Foreign-born 38.4% of residents of Fort Campbell North speak English at home.
13.0% of residents speak Spanish at home 65 84.4% Speak English very well12 15.6% Speak English less than very well42.3% of residents speak other language at home 109 43.4% Speak English very well142 56.6% Speak English less than very well
White (Caucasian) - Speak only English Native:
81.0% (5,159)Foreign-born:
57.6% (127)
White (Caucasian) - Speak another language Native:
22.7% (1,445)Foreign-born:
45.2% (100)
Black or African American - Speak only English Native:
92.2% (1,449)Foreign-born:
45.0% (63)
Black or African American - Speak another language Native:
6.7% (105)Foreign-born:
57.6% (80)
American Indian / Alaska Native - Speak another language Native:
63.0% (80)Foreign-born:
98.8% (8)
Asian - Speak another language Native:
41.1% (22)Foreign-born:
100.0% (198)
Native Hawaiian / Pacific Islander - Speak only English Native:
57.3% (73)Foreign-born:
89.6% (40)
Native Hawaiian / Pacific Islander - Speak another language Native:
43.0% (55)Foreign-born:
7.0% (3)
Other race - Speak only English Native:
37.7% (212)Foreign-born:
100.0% (20)
Other race - Speak another language Native:
58.5% (329)Foreign-born:
6.2% (1)
Two or more races - Speak another language Native:
41.9% (444)Foreign-born:
98.8% (48)
White alone - Speak only English Native:
89.6% (4,777)Foreign-born:
79.5% (127)
White alone - Speak another language Native:
10.5% (561)Foreign-born:
20.6% (33)
Hispanic or Latino - Speak only English Native:
41.4% (1,058)Foreign-born:
14.4% (14)
Hispanic or Latino - Speak another language Native:
57.7% (1,474)Foreign-born:
85.3% (84)
Foreign-born residents in Fort Campbell North 586 residents are foreign born (1.9% Asia , 1.0% Latin America , 1.0% Africa ).
This city:
4.9%Kentucky:
4.1%
Marital status for residents in Fort Campbell North Marital status - White (Caucasian) population 15 years and over
Males 59.9% Never married34.4% Now married0.7% Separated0.2% Widowed4.9% DivorcedFemales 10.5% Never married77.8% Now married1.0% Separated0.0% Widowed10.6% DivorcedWomen who gave birth in the past 12 months Now married:
100.0% (274)Unmarried:
0.0% (0)
Women who did not give birth in the past 12 months Now married:
78.4% (941)Unmarried:
21.6% (259)
Marital status - Black or African American population 15 years and over
Males 46.0% Never married43.3% Now married3.8% Separated0.0% Widowed6.9% DivorcedFemales 60.2% Never married39.8% Now married0.0% Separated0.0% Widowed0.0% DivorcedWomen who gave birth in the past 12 months Now married:
100.0% (33)Unmarried:
0.0% (0)
Women who did not give birth in the past 12 months Now married:
35.2% (150)Unmarried:
64.8% (275)
Marital status - American Indian / Alaska Native population 15 years and over
Males 87.0% Never married8.7% Now married0.0% Separated0.0% Widowed4.3% DivorcedFemales 30.8% Never married40.4% Now married0.0% Separated0.0% Widowed28.8% DivorcedWomen who did not give birth in the past 12 months Now married:
54.3% (22)Unmarried:
45.7% (19)
Marital status - Asian population 15 years and over
Males 71.2% Never married28.8% Now married0.0% Separated0.0% Widowed0.0% DivorcedFemales 0.0% Never married100.0% Now married0.0% Separated0.0% Widowed0.0% DivorcedWomen who did not give birth in the past 12 months Now married:
100.0% (134)Unmarried:
0.0% (0)
Marital status - Native Hawaiian / Pacific Islander population 15 years and over
Males 93.5% Never married6.5% Now married0.0% Separated0.0% Widowed0.0% DivorcedFemales 57.5% Never married32.5% Now married0.0% Separated0.0% Widowed10.0% DivorcedWomen who gave birth in the past 12 months Now married:
100.0% (1)Unmarried:
0.0% (0)
Women who did not give birth in the past 12 months Now married:
30.8% (13)Unmarried:
69.2% (28)
Marital status - Other race population 15 years and over
Males 23.0% Never married77.0% Now married0.0% Separated0.0% Widowed0.0% DivorcedFemales 21.6% Never married78.4% Now married0.0% Separated0.0% Widowed0.0% DivorcedWomen who did not give birth in the past 12 months Now married:
78.4% (153)Unmarried:
21.6% (42)
Marital status - Two or more races population 15 years and over
Males 60.4% Never married36.5% Now married3.2% Separated0.0% Widowed0.0% DivorcedFemales 30.2% Never married59.9% Now married2.4% Separated4.7% Widowed2.8% DivorcedWomen who gave birth in the past 12 months Now married:
84.8% (40)Unmarried:
15.2% (7)
Women who did not give birth in the past 12 months Now married:
60.4% (142)Unmarried:
39.6% (93)
Marital status - White alone, not Hispanic / Latino population 15 years and over
Males 61.2% Never married33.8% Now married0.9% Separated0.2% Widowed3.9% DivorcedFemales 10.5% Never married75.2% Now married1.3% Separated0.0% Widowed13.1% DivorcedWomen who gave birth in the past 12 months Now married:
100.0% (270)Unmarried:
0.0% (0)
Women who did not give birth in the past 12 months Now married:
75.3% (720)Unmarried:
24.7% (236)
Marital status - Hispanic or Latino population 15 years and over
Males 51.5% Never married43.0% Now married0.9% Separated0.0% Widowed4.6% DivorcedFemales 20.8% Never married73.5% Now married0.8% Separated1.6% Widowed3.4% DivorcedWomen who gave birth in the past 12 months Now married:
88.6% (48)Unmarried:
11.4% (6)
Women who did not give birth in the past 12 months Now married:
76.3% (518)Unmarried:
23.7% (161)
Ancestries in Fort Campbell North
681 12.0% European390 6.9% German230 4.0% African168 3.0% Irish147 2.6% Italian119 2.1% Scottish104 1.8% Scotch-Irish101 1.8% American97 1.7% English79 1.4% French73 1.3% Polish42 0.7% Norwegian36 0.6% Kenyan33 0.6% Liberian23 0.4% Russian23 0.4% Jamaican20 0.4% Dutch20 0.4% Ghanaian18 0.3% Welsh16 0.3% Scandinavian12 0.2% Portuguese11 0.2% Austrian11 0.2% Canadian9 0.2% Eastern European5 0.09% British West Indian1 0.02% Belgian
Geographical mobility in Fort Campbell North Same house 1 year ago 4,743 65.5% White (Caucasian)1,149 58.6% Black or African American115 91.6% American Indian / Alaska Native207 76.4% Asian183 86.8% Native Hawaiian / Pacific Islander537 72.2% Other race1,106 67.3% Two or more races3,938 65.1% White alone, not Hispanic / Latino1,968 64.8% Hispanic or LatinoMoved within same county 48 0.7% White / Caucasian305 15.6% Black or African American21 1.3% Two or more races43 0.7% White alone, not Hispanic / Latino63 2.1% Hispanic or LatinoMoved within same state 24 0.3% White / Caucasian77 3.9% Black or African American23 0.4% White alone, not Hispanic / LatinoMoved from different state 2,497 34.5% White / Caucasian294 15.0% Black or African American71 26.4% Asian30 14.0% Native Hawaiian / Pacific Islander211 28.3% Other race463 28.2% Two or more races2,209 36.5% White alone, not Hispanic / Latino950 31.3% Hispanic or LatinoMoved from abroad 165 2.3% White83 4.2% Black or African American22 2.9% Other race196 12.0% Two or more races73 1.2% White alone, not Hispanic / Latino211 7.0% Hispanic or Latino
Children Nativity (place of birth) in Fort Campbell North
Children under 6 years - Living with two parents Both parents native 1,337 100.0% NativeBoth parents foreign-born 50 100.0% NativeOne native, one foreign-born parent 214 100.0% NativeChildren under 6 years - Living with one parent Native parent 429 100.0% NativeForeign-born parent 13 100.0% NativeChildren 6 to 17 years - Living with two parents Both parents native 1,119 100.0% NativeBoth parents foreign-born 28 43.5% Native36 56.5% Foreign-bornOne native, one foreign-born parent 64 100.0% NativeChildren 6 to 17 years - Living with one parent Native parent 272 100.0% Native
Grandparents responsible for own grandchildren in Fort Campbell North
Grandparents (30 to 59 years) White / Caucasian 74 100.0% Not responsible for grandchildrenAmerican Indian / Alaska Native 2 100.0% Responsible for grandchildrenOther race 1 100.0% Not responsible for grandchildrenTwo or more races 3 100.0% Not responsible for grandchildrenWhite alone, not Hispanic / Latino 75 100.0% Not responsible for grandchildrenHispanic or Latino 4 100.0% Not responsible for grandchildren
Grandparents (60 years and over)