Races in Findlay, Ohio (OH) Detailed Stats
Data:
Races - White alone (%)
Races - White alone (% change since 2000)
Races - Black alone (%)
Races - Black alone (% change since 2000)
Races - American Indian alone (%)
Races - American Indian alone (% change since 2000)
Races - Asian alone (%)
Races - Asian alone (% change since 2000)
Races - Hispanic (%)
Races - Hispanic (% change since 2000)
Races - Native Hawaiian and Other Pacific Islander alone (%)
Races - Native Hawaiian and Other Pacific Islander alone (% change since 2000)
Races - Two or more races(%)
Races - Two or more races(% change since 2000)
Races - Other race alone (%)
Races - Other race alone (% change since 2000)
Racial diversity
Place of birth - Born in state of residence (%)
Place of birth - Born in state of residence (%) - White
Place of birth - Born in state of residence (%) - Black or African American
Place of birth - Born in state of residence (%) - Asian
Place of birth - Born in state of residence (%) - Hispanic or Latino
Place of birth - Born in state of residence (%) - American Indian and Alaska Native
Place of birth - Born in state of residence (%) - Multirace
Place of birth - Born in state of residence (%) - Other Race
Place of birth - Born in other state (%)
Place of birth - Born in other state (%) - White
Place of birth - Born in other state (%) - Black or African American
Place of birth - Born in other state (%) - Asian
Place of birth - Born in other state (%) - Hispanic or Latino
Place of birth - Born in other state (%) - American Indian and Alaska Native
Place of birth - Born in other state (%) - Multirace
Place of birth - Born in other state (%) - Other Race
Place of birth - Native, outside of US (%)
Place of birth - Native, outside of US (%) - White
Place of birth - Native, outside of US (%) - Black or African American
Place of birth - Native, outside of US (%) - Asian
Place of birth - Native, outside of US (%) - Hispanic or Latino
Place of birth - Native, outside of US (%) - American Indian and Alaska Native
Place of birth - Native, outside of US (%) - Multirace
Place of birth - Native, outside of US (%) - Other Race
Place of birth - Foreign born (%)
Place of birth - Foreign born (%) - White
Place of birth - Foreign born (%) - Black or African American
Place of birth - Foreign born (%) - Asian
Place of birth - Foreign born (%) - Hispanic or Latino
Place of birth - Foreign born (%) - American Indian and Alaska Native
Place of birth - Foreign born (%) - Multirace
Place of birth - Foreign born (%) - Other Race
Residents speaking English at home (%)
Residents speaking English at home - Born in the United States (%)
Residents speaking English at home - Native, born elsewhere (%)
Residents speaking English at home - Foreign born (%)
Residents speaking Spanish at home (%)
Residents speaking Spanish at home - Born in the United States (%)
Residents speaking Spanish at home - Native, born elsewhere (%)
Residents speaking Spanish at home - Foreign born (%)
Residents speaking other language at home (%)
Residents speaking other language at home - Born in the United States (%)
Residents speaking other language at home - Native, born elsewhere (%)
Residents speaking other language at home - Foreign born (%)
Marital status - Never married (%)
Marital status - Now married (%)
Marital status - Separated (%)
Marital status - Widowed (%)
Marital status - Divorced (%)
Ancestries Reported - Arab (%)
Ancestries Reported - Czech (%)
Ancestries Reported - Danish (%)
Ancestries Reported - Dutch (%)
Ancestries Reported - English (%)
Ancestries Reported - French (%)
Ancestries Reported - French Canadian (%)
Ancestries Reported - German (%)
Ancestries Reported - Greek (%)
Ancestries Reported - Hungarian (%)
Ancestries Reported - Irish (%)
Ancestries Reported - Italian (%)
Ancestries Reported - Lithuanian (%)
Ancestries Reported - Norwegian (%)
Ancestries Reported - Polish (%)
Ancestries Reported - Portuguese (%)
Ancestries Reported - Russian (%)
Ancestries Reported - Scotch-Irish (%)
Ancestries Reported - Scottish (%)
Ancestries Reported - Slovak (%)
Ancestries Reported - Subsaharan African (%)
Ancestries Reported - Swedish (%)
Ancestries Reported - Swiss (%)
Ancestries Reported - Ukrainian (%)
Ancestries Reported - United States (%)
Ancestries Reported - Welsh (%)
Ancestries Reported - West Indian (%)
Ancestries Reported - Other (%)
Geographical mobility - Same house 1 year ago (%)
Geographical mobility - Same house 1 year ago (%) - White
Geographical mobility - Same house 1 year ago (%) - Black or African American
Geographical mobility - Same house 1 year ago (%) - Asian
Geographical mobility - Same house 1 year ago (%) - Hispanic or Latino
Geographical mobility - Same house 1 year ago (%) - American Indian and Alaska Native
Geographical mobility - Same house 1 year ago (%) - Multirace
Geographical mobility - Same house 1 year ago (%) - Other Race
Geographical mobility - Moved within same county (%)
Geographical mobility - Moved within same county (%) - White
Geographical mobility - Moved within same county (%) - Black or African American
Geographical mobility - Moved within same county (%) - Asian
Geographical mobility - Moved within same county (%) - Hispanic or Latino
Geographical mobility - Moved within same county (%) - American Indian and Alaska Native
Geographical mobility - Moved within same county (%) - Multirace
Geographical mobility - Moved within same county (%) - Other Race
Geographical mobility - Moved from different county within same state (%)
Geographical mobility - Moved from different county within same state (%) - White
Geographical mobility - Moved from different county within same state (%) - Black or African American
Geographical mobility - Moved from different county within same state (%) - Asian
Geographical mobility - Moved from different county within same state (%) - Hispanic or Latino
Geographical mobility - Moved from different county within same state (%) - American Indian and Alaska Native
Geographical mobility - Moved from different county within same state (%) - Multirace
Geographical mobility - Moved from different county within same state (%) - Other Race
Geographical mobility - Moved from different state (%)
Geographical mobility - Moved from different state (%) - White
Geographical mobility - Moved from different state (%) - Black or African American
Geographical mobility - Moved from different state (%) - Asian
Geographical mobility - Moved from different state (%) - Hispanic or Latino
Geographical mobility - Moved from different state (%) - American Indian and Alaska Native
Geographical mobility - Moved from different state (%) - Multirace
Geographical mobility - Moved from different state (%) - Other Race
Geographical mobility - Moved from abroad (%)
Geographical mobility - Moved from abroad (%) - White
Geographical mobility - Moved from abroad (%) - Black or African American
Geographical mobility - Moved from abroad (%) - Asian
Geographical mobility - Moved from abroad (%) - Hispanic or Latino
Geographical mobility - Moved from abroad (%) - American Indian and Alaska Native
Geographical mobility - Moved from abroad (%) - Multirace
Geographical mobility - Moved from abroad (%) - Other Race
Place of birth for the foreign-born population - Ireland (%)
Place of birth for the foreign-born population - Denmark (%)
Place of birth for the foreign-born population - Norway (%)
Place of birth for the foreign-born population - Sweden (%)
Place of birth for the foreign-born population - United Kingdom (%)
Place of birth for the foreign-born population - England (%)
Place of birth for the foreign-born population - Scotland (%)
Place of birth for the foreign-born population - Other Northern Europe (%)
Place of birth for the foreign-born population - Austria (%)
Place of birth for the foreign-born population - Belgium (%)
Place of birth for the foreign-born population - France (%)
Place of birth for the foreign-born population - Germany (%)
Place of birth for the foreign-born population - Netherlands (%)
Place of birth for the foreign-born population - Switzerland (%)
Place of birth for the foreign-born population - Other Western Europe (%)
Place of birth for the foreign-born population - Greece (%)
Place of birth for the foreign-born population - Italy (%)
Place of birth for the foreign-born population - Portugal (%)
Place of birth for the foreign-born population - Spain (%)
Place of birth for the foreign-born population - Other Southern Europe (%)
Place of birth for the foreign-born population - Albania (%)
Place of birth for the foreign-born population - Belarus (%)
Place of birth for the foreign-born population - Bosnia and Herzegovina (%)
Place of birth for the foreign-born population - Bulgaria (%)
Place of birth for the foreign-born population - Croatia (%)
Place of birth for the foreign-born population - Czechoslovakia (%)
Place of birth for the foreign-born population - Hungary (%)
Place of birth for the foreign-born population - Latvia (%)
Place of birth for the foreign-born population - Lithuania (%)
Place of birth for the foreign-born population - North Macedonia (Macedonia) (%)
Place of birth for the foreign-born population - Moldova (%)
Place of birth for the foreign-born population - Poland (%)
Place of birth for the foreign-born population - Romania (%)
Place of birth for the foreign-born population - Russia (%)
Place of birth for the foreign-born population - Serbia (%)
Place of birth for the foreign-born population - Ukraine (%)
Place of birth for the foreign-born population - Other Eastern Europe (%)
Place of birth for the foreign-born population - China (%)
Place of birth for the foreign-born population - Hong Kong (%)
Place of birth for the foreign-born population - Taiwan (%)
Place of birth for the foreign-born population - Japan (%)
Place of birth for the foreign-born population - Korea (%)
Place of birth for the foreign-born population - Other Eastern Asia (%)
Place of birth for the foreign-born population - Afghanistan (%)
Place of birth for the foreign-born population - Bangladesh (%)
Place of birth for the foreign-born population - India (%)
Place of birth for the foreign-born population - Iran (%)
Place of birth for the foreign-born population - Kazakhstan (%)
Place of birth for the foreign-born population - Nepal (%)
Place of birth for the foreign-born population - Pakistan (%)
Place of birth for the foreign-born population - Sri Lanka (%)
Place of birth for the foreign-born population - Uzbekistan (%)
Place of birth for the foreign-born population - Other South Central Asia (%)
Place of birth for the foreign-born population - Burma (%)
Place of birth for the foreign-born population - Cambodia (%)
Place of birth for the foreign-born population - Indonesia (%)
Place of birth for the foreign-born population - Laos (%)
Place of birth for the foreign-born population - Malaysia (%)
Place of birth for the foreign-born population - Philippines (%)
Place of birth for the foreign-born population - Singapore (%)
Place of birth for the foreign-born population - Thailand (%)
Place of birth for the foreign-born population - Vietnam (%)
Place of birth for the foreign-born population - Other South Eastern Asia (%)
Place of birth for the foreign-born population - Armenia (%)
Place of birth for the foreign-born population - Iraq (%)
Place of birth for the foreign-born population - Israel (%)
Place of birth for the foreign-born population - Jordan (%)
Place of birth for the foreign-born population - Kuwait (%)
Place of birth for the foreign-born population - Lebanon (%)
Place of birth for the foreign-born population - Saudi Arabia (%)
Place of birth for the foreign-born population - Syria (%)
Place of birth for the foreign-born population - Turkey (%)
Place of birth for the foreign-born population - Yemen (%)
Place of birth for the foreign-born population - Other Western Asia (%)
Place of birth for the foreign-born population - Eritrea (%)
Place of birth for the foreign-born population - Ethiopia (%)
Place of birth for the foreign-born population - Kenya (%)
Place of birth for the foreign-born population - Somalia (%)
Place of birth for the foreign-born population - Uganda (%)
Place of birth for the foreign-born population - Zimbabwe (%)
Place of birth for the foreign-born population - Other Eastern Africa (%)
Place of birth for the foreign-born population - Cameroon (%)
Place of birth for the foreign-born population - Congo (%)
Place of birth for the foreign-born population - Democratic Republic of Congo (Zaire) (%)
Place of birth for the foreign-born population - Other Middle Africa (%)
Place of birth for the foreign-born population - Egypt (%)
Place of birth for the foreign-born population - Morocco (%)
Place of birth for the foreign-born population - Sudan (%)
Place of birth for the foreign-born population - Other Northern Africa (%)
Place of birth for the foreign-born population - South Africa (%)
Place of birth for the foreign-born population - Other Southern Africa (%)
Place of birth for the foreign-born population - Cabo Verde (%)
Place of birth for the foreign-born population - Ghana (%)
Place of birth for the foreign-born population - Liberia (%)
Place of birth for the foreign-born population - Nigeria (%)
Place of birth for the foreign-born population - Senegal (%)
Place of birth for the foreign-born population - Sierra Leone (%)
Place of birth for the foreign-born population - Other Western Africa (%)
Place of birth for the foreign-born population - Australia (%)
Place of birth for the foreign-born population - New Zealand (%)
Place of birth for the foreign-born population - Fiji (%)
Place of birth for the foreign-born population - Micronesia (%)
Place of birth for the foreign-born population - Bahamas (%)
Place of birth for the foreign-born population - Barbados (%)
Place of birth for the foreign-born population - Cuba (%)
Place of birth for the foreign-born population - Dominica (%)
Place of birth for the foreign-born population - Dominican Republic (%)
Place of birth for the foreign-born population - Grenada (%)
Place of birth for the foreign-born population - Haiti (%)
Place of birth for the foreign-born population - Jamaica (%)
Place of birth for the foreign-born population - St. Vincent and the Grenadines (%)
Place of birth for the foreign-born population - Trinidad and Tobago (%)
Place of birth for the foreign-born population - West Indies (%)
Place of birth for the foreign-born population - Other Caribbean (%)
Place of birth for the foreign-born population - Belize (%)
Place of birth for the foreign-born population - Costa Rica (%)
Place of birth for the foreign-born population - El Salvador (%)
Place of birth for the foreign-born population - Guatemala (%)
Place of birth for the foreign-born population - Honduras (%)
Place of birth for the foreign-born population - Mexico (%)
Place of birth for the foreign-born population - Nicaragua (%)
Place of birth for the foreign-born population - Panama (%)
Place of birth for the foreign-born population - Other Central America (%)
Place of birth for the foreign-born population - Argentina (%)
Place of birth for the foreign-born population - Bolivia (%)
Place of birth for the foreign-born population - Brazil (%)
Place of birth for the foreign-born population - Chile (%)
Place of birth for the foreign-born population - Colombia (%)
Place of birth for the foreign-born population - Ecuador (%)
Place of birth for the foreign-born population - Guyana (%)
Place of birth for the foreign-born population - Peru (%)
Place of birth for the foreign-born population - Uruguay (%)
Place of birth for the foreign-born population - Venezuela (%)
Place of birth for the foreign-born population - Other South America (%)
Place of birth for the foreign-born population - Canada (%)
Place of birth for the foreign-born population - Other Northern America (%)
Place of birth for the foreign-born population - Other (%)
Latest news about races in Findlay, OH collected exclusively by city-data.com from local newspapers, TV, and radio stations
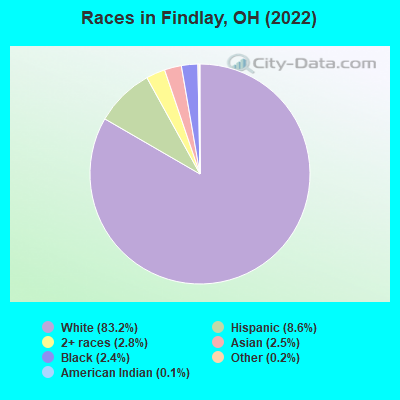
According to 2022 data, the most numerous races in Findlay, OH are White alone (33,555 residents), Black alone (987 residents), and Two or more races (1,135 residents). 93.2% of Findlay residents speak English at home. 4.1% of Findlay, OH residents are foreign-born (2.6% born in Asia, 0.8% born in Latin America), which is about the same as the foreign-born rate of 4.0% across the entire state of Ohio.
Race distribution in Findlay
2000 2022
9,538,111 84.0% White alone 1,290,662 11.4% Black alone 217,123 1.9% Hispanic 137,770 1.2% Two or more races 131,670 1.2% Asian alone 21,985 0.2% American Indian alone 13,483 0.1% Other race alone 2,336 0.02% Native Hawaiian and Other
8,948,793 76.1% White alone 1,401,403 11.9% Black alone 529,291 4.5% Two or more races 517,232 4.4% Hispanic 293,387 2.5% Asian alone 52,805 0.4% Other race alone 9,785 0.08% American Indian alone 3,362 0.03% Native Hawaiian and Other
Income and house value in Findlay Median household income in 2022 $58,539 White non-Hispanic householders$104,031 Black householders$68,397 Asian householders$61,532 Some other race householders$41,880 Two or more races householders$60,676 Hispanic or Latino race householdersMedian 2022 house value $193,496 White Non-Hispanic householders$162,482 Black or African American householders$123,081 American Indian or Alaska Native householders $238,360 Asian householders$132,638 Some other race householders$126,787 Two or more races householders$135,174 Hispanic or Latino householders
Median age by race in Findlay
40.4 Median age for White residents37.6 43.5 45.7 Median age for Black or African American residents33.7 48.4 39.6 Median age for American Indian / Alaska Native residents65.3 -658,163,264.6 16.8 Median age for Asian residents16.2 53.0 -666,666,666.0 Median age for Native Hawaiian / Pacific Islander residents-666,666,666.0 -666,666,666.0 34.3 Median age for Other race residents37.4 34.5 20.0 Median age for Two or more races residents12.1 31.9 41.0 Median age for White alone residents39.2 43.8 27.7 Median age for Hispanic or Latino residents28.0 32.7
Owner/renter occupied households by race in Findlay
House owners and renters - White residents 9,637 58.8% Owner occupied6,765 41.2% Renter occupiedHouse owners and renters - Black or African American residents 53 17.7% Owner occupied246 82.3% Renter occupiedHouse owners and renters - Asian residents 129 31.1% Owner occupied286 68.9% Renter occupiedHouse owners and renters - Native Hawaiian / Pacific Islander residents 17 100.0% Renter occupiedHouse owners and renters - Other race residents 250 57.2% Owner occupied187 42.8% Renter occupiedHouse owners and renters - Two or more races residents 391 45.2% Owner occupied474 54.8% Renter occupiedHouse owners and renters - White alone residents 9,562 59.9% Owner occupied6,414 40.1% Renter occupiedHouse owners and renters - Hispanic or Latino residents 495 37.4% Owner occupied829 62.6% Renter occupied
Language usage in Findlay
English speakers - Total 93.2% of residents of Findlay speak English at home.
3.3% of residents speak Spanish at home 870 70.4% Speak English very well366 29.6% Speak English less than very well3.4% of residents speak other language at home 818 63.2% Speak English very well477 36.8% Speak English less than very well
English speakers - Born in the United States 93.5% of residents of Findlay speak English at home.
4.6% of residents speak Spanish at home 259 79.0% Speak English very well69 21.0% Speak English less than very well2.0% of residents speak other language at home 137 97.2% Speak English very well4 2.8% Speak English less than very well
English speakers - Native, born elsewhere 90.2% of residents of Findlay speak English at home.
10.3% of residents speak Spanish at home 44 100.0% Speak English very well
English speakers - Foreign-born 17.6% of residents of Findlay speak English at home.
19.1% of residents speak Spanish at home 107 35.7% Speak English very well193 64.3% Speak English less than very well63.4% of residents speak other language at home 585 58.8% Speak English very well410 41.2% Speak English less than very well
White (Caucasian) - Speak only English Native:
98.8% (32,326)Foreign-born:
42.1% (135)
White (Caucasian) - Speak another language Native:
1.3% (426)Foreign-born:
58.9% (189)
Black or African American - Speak only English Native:
94.9% (685)Foreign-born:
72.7% (122)
Black or African American - Speak another language Native:
5.3% (38)Foreign-born:
31.8% (53)
Asian - Speak only English Native:
45.7% (59)Foreign-born:
3.3% (26)
Asian - Speak another language Native:
53.7% (70)Foreign-born:
97.7% (760)
Other race - Speak another language Native:
60.2% (661)Foreign-born:
100.0% (264)
Two or more races - Speak another language Native:
10.4% (167)Foreign-born:
100.0% (45)
White alone - Speak only English Native:
98.9% (31,361)Foreign-born:
38.2% (121)
White alone - Speak another language Native:
1.1% (342)Foreign-born:
61.9% (197)
Hispanic or Latino - Speak only English Native:
71.0% (1,951)Foreign-born:
6.5% (18)
Hispanic or Latino - Speak another language Native:
28.6% (785)Foreign-born:
93.6% (261)
Foreign-born residents in Findlay 1,640 residents are foreign born (2.6% Asia , 0.8% Latin America ).
Marital status for residents in Findlay Marital status - White (Caucasian) population 15 years and over
Males 36.7% Never married45.7% Now married2.3% Separated3.5% Widowed11.8% DivorcedFemales 29.7% Never married40.1% Now married2.0% Separated10.4% Widowed17.9% DivorcedWomen who gave birth in the past 12 months Now married:
89.2% (226)Unmarried:
10.8% (27)
Women who did not give birth in the past 12 months Now married:
39.4% (3,071)Unmarried:
60.6% (4,716)
Marital status - Black or African American population 15 years and over
Males 53.0% Never married32.9% Now married2.8% Separated0.0% Widowed11.2% DivorcedFemales 41.6% Never married25.7% Now married0.0% Separated5.9% Widowed26.8% DivorcedWomen who gave birth in the past 12 months Now married:
66.7% (37)Unmarried:
33.3% (19)
Women who did not give birth in the past 12 months Now married:
6.6% (11)Unmarried:
93.4% (151)
Marital status - American Indian / Alaska Native population 15 years and over
Males 23.5% Never married20.6% Now married0.0% Separated0.0% Widowed55.9% DivorcedFemales 0.0% Never married100.0% Now married0.0% Separated0.0% Widowed0.0% DivorcedWomen who did not give birth in the past 12 months Now married:
100.0% (24)Unmarried:
0.0% (0)
Marital status - Asian population 15 years and over
Males 47.1% Never married36.4% Now married0.0% Separated7.3% Widowed9.2% DivorcedFemales 29.7% Never married64.5% Now married0.0% Separated5.9% Widowed0.0% DivorcedWomen who gave birth in the past 12 months Now married:
100.0% (37)Unmarried:
0.0% (0)
Women who did not give birth in the past 12 months Now married:
55.2% (149)Unmarried:
44.8% (121)
Marital status - Other race population 15 years and over
Males 48.4% Never married34.2% Now married4.7% Separated0.0% Widowed12.7% DivorcedFemales 38.4% Never married41.0% Now married0.4% Separated12.2% Widowed8.0% DivorcedWomen who did not give birth in the past 12 months Now married:
42.0% (190)Unmarried:
58.0% (263)
Marital status - Two or more races population 15 years and over
Males 63.3% Never married18.3% Now married0.0% Separated1.7% Widowed16.6% DivorcedFemales 66.3% Never married7.7% Now married7.0% Separated6.6% Widowed12.4% DivorcedWomen who did not give birth in the past 12 months Now married:
11.2% (59)Unmarried:
88.8% (465)
Marital status - White alone, not Hispanic / Latino population 15 years and over
Males 35.8% Never married46.3% Now married2.4% Separated3.4% Widowed12.1% DivorcedFemales 29.7% Never married39.7% Now married2.1% Separated10.4% Widowed18.2% DivorcedWomen who gave birth in the past 12 months Now married:
89.2% (229)Unmarried:
10.8% (28)
Women who did not give birth in the past 12 months Now married:
38.5% (2,909)Unmarried:
61.5% (4,639)
Marital status - Hispanic or Latino population 15 years and over
Males 57.7% Never married27.3% Now married2.1% Separated4.3% Widowed8.6% DivorcedFemales 41.2% Never married40.0% Now married1.9% Separated10.3% Widowed6.6% DivorcedWomen who did not give birth in the past 12 months Now married:
42.5% (394)Unmarried:
57.5% (533)
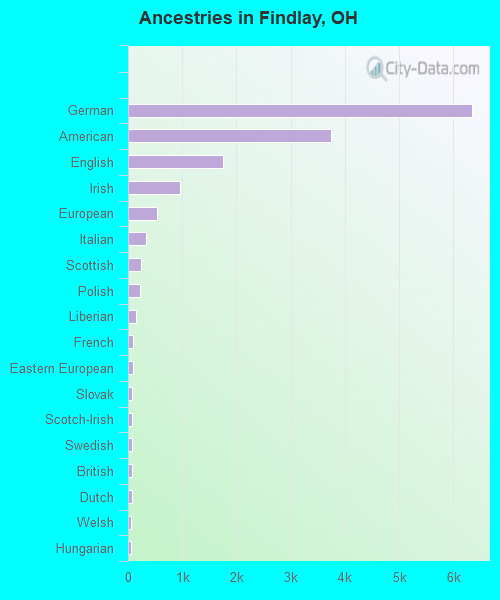
Ancestries in Findlay
6,339 31.8% German3,743 18.8% American1,752 8.8% English954 4.8% Irish529 2.7% European329 1.6% Italian231 1.2% Scottish218 1.1% Polish139 0.7% Liberian86 0.4% French85 0.4% Eastern European80 0.4% Slovak78 0.4% Scotch-Irish71 0.4% Swedish70 0.4% British67 0.3% Dutch60 0.3% Welsh58 0.3% Hungarian57 0.3% Romanian48 0.2% Scandinavian48 0.2% African45 0.2% Portuguese44 0.2% Swiss44 0.2% Ukrainian30 0.2% Lebanese28 0.1% Jordanian21 0.1% Russian18 0.09% Bulgarian17 0.09% Jamaican17 0.09% Norwegian14 0.07% Finnish14 0.07% Pennsylvania German13 0.07% Kenyan10 0.05% Guyanese8 0.04% Barbadian7 0.04% Northern European7 0.04% Slovene6 0.03% Syrian5 0.03% Lithuanian2 0.01% Ethiopian
Geographical mobility in Findlay Same house 1 year ago 28,941 83.9% White (Caucasian)759 78.7% Black or African American46 68.9% American Indian / Alaska Native806 83.6% Asian14 100.0% Native Hawaiian / Pacific Islander932 67.3% Other race1,389 70.2% Two or more races27,888 83.6% White alone, not Hispanic / Latino2,857 83.8% Hispanic or LatinoMoved within same county 2,277 6.6% White / Caucasian64 6.6% Black or African American14 20.3% American Indian / Alaska Native152 11.0% Other race287 14.5% Two or more races2,270 6.8% White alone, not Hispanic / Latino282 8.3% Hispanic or LatinoMoved within same state 2,877 8.3% White / Caucasian12 1.3% Black or African American281 20.3% Other race92 4.6% Two or more races2,770 8.3% White alone, not Hispanic / Latino207 6.1% Hispanic or LatinoMoved from different state 493 1.4% White / Caucasian122 12.7% Black or African American24 2.4% Asian24 1.8% Other race158 8.0% Two or more races447 1.3% White alone, not Hispanic / Latino37 1.1% Hispanic or LatinoMoved from abroad 17 0.0% White34 3.6% Black or African American137 14.2% Asian55 3.9% Other race19 0.1% White alone, not Hispanic / Latino38 1.1% Hispanic or Latino
Children Nativity (place of birth) in Findlay
Children under 6 years - Living with two parents Both parents native 1,530 100.0% NativeBoth parents foreign-born 198 78.1% Native56 21.9% Foreign-bornOne native, one foreign-born parent 182 100.0% NativeChildren under 6 years - Living with one parent Native parent 954 100.0% NativeChildren 6 to 17 years - Living with two parents Both parents native 2,742 99.1% Native26 0.9% Foreign-bornBoth parents foreign-born 144 84.6% Native26 15.4% Foreign-bornOne native, one foreign-born parent 162 100.0% NativeChildren 6 to 17 years - Living with one parent Native parent 1,658 100.0% Native
Grandparents responsible for own grandchildren in Findlay
Grandparents (30 to 59 years) White / Caucasian 73 32.0% Responsible for grandchildren156 68.0% Not responsible for grandchildrenBlack or African American 27 100.0% Not responsible for grandchildrenWhite alone, not Hispanic / Latino 47 22.8% Responsible for grandchildren158 77.2% Not responsible for grandchildrenHispanic or Latino 42 100.0% Responsible for grandchildrenGrandparents (60 years and over) White / Caucasian 59 22.5% Responsible for grandchildren204 77.5% Not responsible for grandchildrenWhite alone, not Hispanic / Latino 59 23.0% Responsible for grandchildren198 77.0% Not responsible for grandchildrenHispanic or Latino 22 45.9% Responsible for grandchildren25 54.1% Not responsible for grandchildren