Races in Fife, Washington (WA) Detailed Stats
Data:
Races - White alone (%)
Races - White alone (% change since 2000)
Races - Black alone (%)
Races - Black alone (% change since 2000)
Races - American Indian alone (%)
Races - American Indian alone (% change since 2000)
Races - Asian alone (%)
Races - Asian alone (% change since 2000)
Races - Hispanic (%)
Races - Hispanic (% change since 2000)
Races - Native Hawaiian and Other Pacific Islander alone (%)
Races - Native Hawaiian and Other Pacific Islander alone (% change since 2000)
Races - Two or more races(%)
Races - Two or more races(% change since 2000)
Races - Other race alone (%)
Races - Other race alone (% change since 2000)
Racial diversity
Place of birth - Born in state of residence (%)
Place of birth - Born in state of residence (%) - White
Place of birth - Born in state of residence (%) - Black or African American
Place of birth - Born in state of residence (%) - Asian
Place of birth - Born in state of residence (%) - Hispanic or Latino
Place of birth - Born in state of residence (%) - American Indian and Alaska Native
Place of birth - Born in state of residence (%) - Multirace
Place of birth - Born in state of residence (%) - Other Race
Place of birth - Born in other state (%)
Place of birth - Born in other state (%) - White
Place of birth - Born in other state (%) - Black or African American
Place of birth - Born in other state (%) - Asian
Place of birth - Born in other state (%) - Hispanic or Latino
Place of birth - Born in other state (%) - American Indian and Alaska Native
Place of birth - Born in other state (%) - Multirace
Place of birth - Born in other state (%) - Other Race
Place of birth - Native, outside of US (%)
Place of birth - Native, outside of US (%) - White
Place of birth - Native, outside of US (%) - Black or African American
Place of birth - Native, outside of US (%) - Asian
Place of birth - Native, outside of US (%) - Hispanic or Latino
Place of birth - Native, outside of US (%) - American Indian and Alaska Native
Place of birth - Native, outside of US (%) - Multirace
Place of birth - Native, outside of US (%) - Other Race
Place of birth - Foreign born (%)
Place of birth - Foreign born (%) - White
Place of birth - Foreign born (%) - Black or African American
Place of birth - Foreign born (%) - Asian
Place of birth - Foreign born (%) - Hispanic or Latino
Place of birth - Foreign born (%) - American Indian and Alaska Native
Place of birth - Foreign born (%) - Multirace
Place of birth - Foreign born (%) - Other Race
Residents speaking English at home (%)
Residents speaking English at home - Born in the United States (%)
Residents speaking English at home - Native, born elsewhere (%)
Residents speaking English at home - Foreign born (%)
Residents speaking Spanish at home (%)
Residents speaking Spanish at home - Born in the United States (%)
Residents speaking Spanish at home - Native, born elsewhere (%)
Residents speaking Spanish at home - Foreign born (%)
Residents speaking other language at home (%)
Residents speaking other language at home - Born in the United States (%)
Residents speaking other language at home - Native, born elsewhere (%)
Residents speaking other language at home - Foreign born (%)
Marital status - Never married (%)
Marital status - Now married (%)
Marital status - Separated (%)
Marital status - Widowed (%)
Marital status - Divorced (%)
Ancestries Reported - Arab (%)
Ancestries Reported - Czech (%)
Ancestries Reported - Danish (%)
Ancestries Reported - Dutch (%)
Ancestries Reported - English (%)
Ancestries Reported - French (%)
Ancestries Reported - French Canadian (%)
Ancestries Reported - German (%)
Ancestries Reported - Greek (%)
Ancestries Reported - Hungarian (%)
Ancestries Reported - Irish (%)
Ancestries Reported - Italian (%)
Ancestries Reported - Lithuanian (%)
Ancestries Reported - Norwegian (%)
Ancestries Reported - Polish (%)
Ancestries Reported - Portuguese (%)
Ancestries Reported - Russian (%)
Ancestries Reported - Scotch-Irish (%)
Ancestries Reported - Scottish (%)
Ancestries Reported - Slovak (%)
Ancestries Reported - Subsaharan African (%)
Ancestries Reported - Swedish (%)
Ancestries Reported - Swiss (%)
Ancestries Reported - Ukrainian (%)
Ancestries Reported - United States (%)
Ancestries Reported - Welsh (%)
Ancestries Reported - West Indian (%)
Ancestries Reported - Other (%)
Geographical mobility - Same house 1 year ago (%)
Geographical mobility - Same house 1 year ago (%) - White
Geographical mobility - Same house 1 year ago (%) - Black or African American
Geographical mobility - Same house 1 year ago (%) - Asian
Geographical mobility - Same house 1 year ago (%) - Hispanic or Latino
Geographical mobility - Same house 1 year ago (%) - American Indian and Alaska Native
Geographical mobility - Same house 1 year ago (%) - Multirace
Geographical mobility - Same house 1 year ago (%) - Other Race
Geographical mobility - Moved within same county (%)
Geographical mobility - Moved within same county (%) - White
Geographical mobility - Moved within same county (%) - Black or African American
Geographical mobility - Moved within same county (%) - Asian
Geographical mobility - Moved within same county (%) - Hispanic or Latino
Geographical mobility - Moved within same county (%) - American Indian and Alaska Native
Geographical mobility - Moved within same county (%) - Multirace
Geographical mobility - Moved within same county (%) - Other Race
Geographical mobility - Moved from different county within same state (%)
Geographical mobility - Moved from different county within same state (%) - White
Geographical mobility - Moved from different county within same state (%) - Black or African American
Geographical mobility - Moved from different county within same state (%) - Asian
Geographical mobility - Moved from different county within same state (%) - Hispanic or Latino
Geographical mobility - Moved from different county within same state (%) - American Indian and Alaska Native
Geographical mobility - Moved from different county within same state (%) - Multirace
Geographical mobility - Moved from different county within same state (%) - Other Race
Geographical mobility - Moved from different state (%)
Geographical mobility - Moved from different state (%) - White
Geographical mobility - Moved from different state (%) - Black or African American
Geographical mobility - Moved from different state (%) - Asian
Geographical mobility - Moved from different state (%) - Hispanic or Latino
Geographical mobility - Moved from different state (%) - American Indian and Alaska Native
Geographical mobility - Moved from different state (%) - Multirace
Geographical mobility - Moved from different state (%) - Other Race
Geographical mobility - Moved from abroad (%)
Geographical mobility - Moved from abroad (%) - White
Geographical mobility - Moved from abroad (%) - Black or African American
Geographical mobility - Moved from abroad (%) - Asian
Geographical mobility - Moved from abroad (%) - Hispanic or Latino
Geographical mobility - Moved from abroad (%) - American Indian and Alaska Native
Geographical mobility - Moved from abroad (%) - Multirace
Geographical mobility - Moved from abroad (%) - Other Race
Place of birth for the foreign-born population - Ireland (%)
Place of birth for the foreign-born population - Denmark (%)
Place of birth for the foreign-born population - Norway (%)
Place of birth for the foreign-born population - Sweden (%)
Place of birth for the foreign-born population - United Kingdom (%)
Place of birth for the foreign-born population - England (%)
Place of birth for the foreign-born population - Scotland (%)
Place of birth for the foreign-born population - Other Northern Europe (%)
Place of birth for the foreign-born population - Austria (%)
Place of birth for the foreign-born population - Belgium (%)
Place of birth for the foreign-born population - France (%)
Place of birth for the foreign-born population - Germany (%)
Place of birth for the foreign-born population - Netherlands (%)
Place of birth for the foreign-born population - Switzerland (%)
Place of birth for the foreign-born population - Other Western Europe (%)
Place of birth for the foreign-born population - Greece (%)
Place of birth for the foreign-born population - Italy (%)
Place of birth for the foreign-born population - Portugal (%)
Place of birth for the foreign-born population - Spain (%)
Place of birth for the foreign-born population - Other Southern Europe (%)
Place of birth for the foreign-born population - Albania (%)
Place of birth for the foreign-born population - Belarus (%)
Place of birth for the foreign-born population - Bosnia and Herzegovina (%)
Place of birth for the foreign-born population - Bulgaria (%)
Place of birth for the foreign-born population - Croatia (%)
Place of birth for the foreign-born population - Czechoslovakia (%)
Place of birth for the foreign-born population - Hungary (%)
Place of birth for the foreign-born population - Latvia (%)
Place of birth for the foreign-born population - Lithuania (%)
Place of birth for the foreign-born population - North Macedonia (Macedonia) (%)
Place of birth for the foreign-born population - Moldova (%)
Place of birth for the foreign-born population - Poland (%)
Place of birth for the foreign-born population - Romania (%)
Place of birth for the foreign-born population - Russia (%)
Place of birth for the foreign-born population - Serbia (%)
Place of birth for the foreign-born population - Ukraine (%)
Place of birth for the foreign-born population - Other Eastern Europe (%)
Place of birth for the foreign-born population - China (%)
Place of birth for the foreign-born population - Hong Kong (%)
Place of birth for the foreign-born population - Taiwan (%)
Place of birth for the foreign-born population - Japan (%)
Place of birth for the foreign-born population - Korea (%)
Place of birth for the foreign-born population - Other Eastern Asia (%)
Place of birth for the foreign-born population - Afghanistan (%)
Place of birth for the foreign-born population - Bangladesh (%)
Place of birth for the foreign-born population - India (%)
Place of birth for the foreign-born population - Iran (%)
Place of birth for the foreign-born population - Kazakhstan (%)
Place of birth for the foreign-born population - Nepal (%)
Place of birth for the foreign-born population - Pakistan (%)
Place of birth for the foreign-born population - Sri Lanka (%)
Place of birth for the foreign-born population - Uzbekistan (%)
Place of birth for the foreign-born population - Other South Central Asia (%)
Place of birth for the foreign-born population - Burma (%)
Place of birth for the foreign-born population - Cambodia (%)
Place of birth for the foreign-born population - Indonesia (%)
Place of birth for the foreign-born population - Laos (%)
Place of birth for the foreign-born population - Malaysia (%)
Place of birth for the foreign-born population - Philippines (%)
Place of birth for the foreign-born population - Singapore (%)
Place of birth for the foreign-born population - Thailand (%)
Place of birth for the foreign-born population - Vietnam (%)
Place of birth for the foreign-born population - Other South Eastern Asia (%)
Place of birth for the foreign-born population - Armenia (%)
Place of birth for the foreign-born population - Iraq (%)
Place of birth for the foreign-born population - Israel (%)
Place of birth for the foreign-born population - Jordan (%)
Place of birth for the foreign-born population - Kuwait (%)
Place of birth for the foreign-born population - Lebanon (%)
Place of birth for the foreign-born population - Saudi Arabia (%)
Place of birth for the foreign-born population - Syria (%)
Place of birth for the foreign-born population - Turkey (%)
Place of birth for the foreign-born population - Yemen (%)
Place of birth for the foreign-born population - Other Western Asia (%)
Place of birth for the foreign-born population - Eritrea (%)
Place of birth for the foreign-born population - Ethiopia (%)
Place of birth for the foreign-born population - Kenya (%)
Place of birth for the foreign-born population - Somalia (%)
Place of birth for the foreign-born population - Uganda (%)
Place of birth for the foreign-born population - Zimbabwe (%)
Place of birth for the foreign-born population - Other Eastern Africa (%)
Place of birth for the foreign-born population - Cameroon (%)
Place of birth for the foreign-born population - Congo (%)
Place of birth for the foreign-born population - Democratic Republic of Congo (Zaire) (%)
Place of birth for the foreign-born population - Other Middle Africa (%)
Place of birth for the foreign-born population - Egypt (%)
Place of birth for the foreign-born population - Morocco (%)
Place of birth for the foreign-born population - Sudan (%)
Place of birth for the foreign-born population - Other Northern Africa (%)
Place of birth for the foreign-born population - South Africa (%)
Place of birth for the foreign-born population - Other Southern Africa (%)
Place of birth for the foreign-born population - Cabo Verde (%)
Place of birth for the foreign-born population - Ghana (%)
Place of birth for the foreign-born population - Liberia (%)
Place of birth for the foreign-born population - Nigeria (%)
Place of birth for the foreign-born population - Senegal (%)
Place of birth for the foreign-born population - Sierra Leone (%)
Place of birth for the foreign-born population - Other Western Africa (%)
Place of birth for the foreign-born population - Australia (%)
Place of birth for the foreign-born population - New Zealand (%)
Place of birth for the foreign-born population - Fiji (%)
Place of birth for the foreign-born population - Micronesia (%)
Place of birth for the foreign-born population - Bahamas (%)
Place of birth for the foreign-born population - Barbados (%)
Place of birth for the foreign-born population - Cuba (%)
Place of birth for the foreign-born population - Dominica (%)
Place of birth for the foreign-born population - Dominican Republic (%)
Place of birth for the foreign-born population - Grenada (%)
Place of birth for the foreign-born population - Haiti (%)
Place of birth for the foreign-born population - Jamaica (%)
Place of birth for the foreign-born population - St. Vincent and the Grenadines (%)
Place of birth for the foreign-born population - Trinidad and Tobago (%)
Place of birth for the foreign-born population - West Indies (%)
Place of birth for the foreign-born population - Other Caribbean (%)
Place of birth for the foreign-born population - Belize (%)
Place of birth for the foreign-born population - Costa Rica (%)
Place of birth for the foreign-born population - El Salvador (%)
Place of birth for the foreign-born population - Guatemala (%)
Place of birth for the foreign-born population - Honduras (%)
Place of birth for the foreign-born population - Mexico (%)
Place of birth for the foreign-born population - Nicaragua (%)
Place of birth for the foreign-born population - Panama (%)
Place of birth for the foreign-born population - Other Central America (%)
Place of birth for the foreign-born population - Argentina (%)
Place of birth for the foreign-born population - Bolivia (%)
Place of birth for the foreign-born population - Brazil (%)
Place of birth for the foreign-born population - Chile (%)
Place of birth for the foreign-born population - Colombia (%)
Place of birth for the foreign-born population - Ecuador (%)
Place of birth for the foreign-born population - Guyana (%)
Place of birth for the foreign-born population - Peru (%)
Place of birth for the foreign-born population - Uruguay (%)
Place of birth for the foreign-born population - Venezuela (%)
Place of birth for the foreign-born population - Other South America (%)
Place of birth for the foreign-born population - Canada (%)
Place of birth for the foreign-born population - Other Northern America (%)
Place of birth for the foreign-born population - Other (%)
Latest news about races in Fife, WA collected exclusively by city-data.com from local newspapers, TV, and radio stations
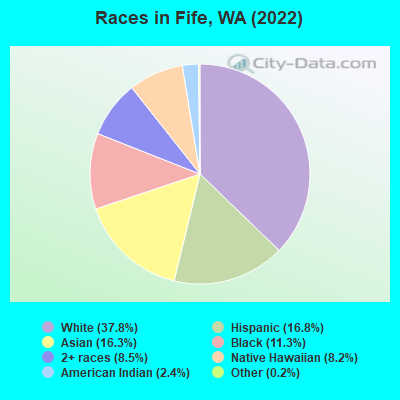
According to 2022 data, the most numerous races in Fife, WA are White alone (4,156 residents), Hispanic (1,842 residents), and Asian alone (1,788 residents). 68.6% of Fife residents speak English at home. 21.9% of Fife, WA residents are foreign-born (8.8% born in Asia, 4.7% born in Latin America, 2.7% born in Europe, 2.5% born in Oceania, 2.4% born in Africa), which is 31.5% greater than the foreign-born rate of 15.0% across the entire state of Washington.
Race distribution in Fife
2000 2022
4,652,490 78.9% White alone 441,509 7.5% Hispanic 319,401 5.4% Asian alone 184,631 3.1% Black alone 175,926 3.0% Two or more races 85,396 1.4% American Indian alone 22,779 0.4% Native Hawaiian and Other 11,989 0.2% Other race alone
4,941,456 63.5% White alone 1,093,313 14.0% Hispanic 755,832 9.7% Asian alone 523,448 6.7% Two or more races 299,537 3.8% Black alone 69,024 0.9% American Indian alone 52,231 0.7% Native Hawaiian and Other 50,945 0.7% Other race alone
Income and house value in Fife Median household income in 2022 $91,483 White non-Hispanic householders$73,730 Black householders$94,694 American Indian and Alaska Native householders$97,122 Asian householders$74,376 Native Hawaiian and other Pacific Islander householders$63,555 Some other race householders$123,912 Two or more races householders$77,111 Hispanic or Latino race householdersMedian 2022 house value $570,636 White Non-Hispanic householders$868,696 Black or African American householders$357,130 American Indian or Alaska Native householders $637,043 Asian householders$328,174 Native Hawaiian and other Pacific Islander householders$458,671 Some other race householders$550,174 Two or more races householders$434,348 Hispanic or Latino householders
Median age by race in Fife
36.9 Median age for White residents36.4 38.0 27.3 Median age for Black or African American residents23.2 31.3 23.2 Median age for American Indian / Alaska Native residents25.3 32.3 34.6 Median age for Asian residents34.6 37.0 29.2 Median age for Native Hawaiian / Pacific Islander residents35.7 24.2 37.3 Median age for Other race residents33.9 41.7 26.6 Median age for Two or more races residents25.8 28.5 37.8 Median age for White alone residents36.8 39.6 26.4 Median age for Hispanic or Latino residents26.2 28.3
Owner/renter occupied households by race in Fife
House owners and renters - White residents 1,122 52.8% Owner occupied1,004 47.2% Renter occupiedHouse owners and renters - Black or African American residents 107 27.1% Owner occupied287 72.9% Renter occupiedHouse owners and renters - American Indian / Alaska Native residents 39 53.1% Owner occupied34 46.9% Renter occupiedHouse owners and renters - Asian residents 334 46.7% Owner occupied382 53.3% Renter occupiedHouse owners and renters - Native Hawaiian / Pacific Islander residents 13 5.9% Owner occupied211 94.1% Renter occupiedHouse owners and renters - Other race residents 55 39.5% Owner occupied84 60.5% Renter occupiedHouse owners and renters - Two or more races residents 283 50.0% Owner occupied283 50.0% Renter occupiedHouse owners and renters - White alone residents 1,116 55.7% Owner occupied886 44.3% Renter occupiedHouse owners and renters - Hispanic or Latino residents 183 37.4% Owner occupied307 62.6% Renter occupied
Language usage in Fife
English speakers - Total 68.6% of residents of Fife speak English at home.
10.7% of residents speak Spanish at home 726 66.0% Speak English very well374 34.0% Speak English less than very well21.3% of residents speak other language at home 1,312 59.7% Speak English very well886 40.3% Speak English less than very well
English speakers - Born in the United States 86.2% of residents of Fife speak English at home.
8.6% of residents speak Spanish at home 239 90.9% Speak English very well24 9.1% Speak English less than very well5.5% of residents speak other language at home 102 60.4% Speak English very well67 39.6% Speak English less than very well
English speakers - Native, born elsewhere 75.7% of residents of Fife speak English at home.
1.6% of residents speak Spanish at home 7 100.0% Speak English very well25.7% of residents speak other language at home 106 93.0% Speak English very well8 7.0% Speak English less than very well
English speakers - Foreign-born 13.3% of residents of Fife speak English at home.
20.5% of residents speak Spanish at home 183 36.3% Speak English very well321 63.7% Speak English less than very well66.8% of residents speak other language at home 937 57.1% Speak English very well703 42.9% Speak English less than very well
White (Caucasian) - Speak only English Native:
94.3% (3,627)Foreign-born:
15.3% (77)
White (Caucasian) - Speak another language Native:
4.7% (182)Foreign-born:
87.3% (438)
Black or African American - Speak only English Native:
87.7% (889)Foreign-born:
0.4% (1)
Black or African American - Speak another language Native:
13.0% (131)Foreign-born:
100.0% (287)
Asian - Speak only English Native:
70.7% (516)Foreign-born:
17.2% (172)
Asian - Speak another language Native:
30.2% (220)Foreign-born:
81.8% (815)
Native Hawaiian / Pacific Islander - Speak only English Native:
69.7% (490)Foreign-born:
71.4% (117)
Native Hawaiian / Pacific Islander - Speak another language Native:
29.6% (208)Foreign-born:
46.4% (76)
Other race - Speak only English Native:
37.3% (93)Foreign-born:
5.6% (9)
Other race - Speak another language Native:
62.1% (155)Foreign-born:
93.9% (153)
Two or more races - Speak another language Native:
26.0% (355)Foreign-born:
100.0% (311)
White alone - Speak only English Native:
96.5% (3,501)Foreign-born:
21.2% (81)
White alone - Speak another language Native:
3.2% (116)Foreign-born:
82.8% (317)
Hispanic or Latino - Speak only English Native:
47.9% (575)Foreign-born:
1.8% (10)
Hispanic or Latino - Speak another language Native:
50.3% (605)Foreign-born:
99.6% (528)
Foreign-born residents in Fife 2,404 residents are foreign born (8.8% Asia , 4.7% Latin America , 2.7% Europe , 2.5% Oceania , 2.4% Africa ).
This city:
21.9%Washington:
14.9%
Marital status for residents in Fife Marital status - White (Caucasian) population 15 years and over
Males 36.7% Never married49.2% Now married1.0% Separated0.7% Widowed12.3% DivorcedFemales 25.1% Never married49.9% Now married0.0% Separated5.6% Widowed19.3% DivorcedWomen who gave birth in the past 12 months Now married:
93.4% (54)Unmarried:
6.6% (4)
Women who did not give birth in the past 12 months Now married:
49.6% (553)Unmarried:
50.4% (562)
Marital status - Black or African American population 15 years and over
Males 37.8% Never married52.6% Now married1.8% Separated0.0% Widowed7.8% DivorcedFemales 39.4% Never married42.6% Now married4.3% Separated3.5% Widowed10.2% DivorcedWomen who gave birth in the past 12 months Now married:
100.0% (48)Unmarried:
0.0% (0)
Women who did not give birth in the past 12 months Now married:
40.6% (104)Unmarried:
59.4% (152)
Marital status - American Indian / Alaska Native population 15 years and over
Males 53.8% Never married3.8% Now married20.2% Separated0.0% Widowed22.1% DivorcedFemales 36.8% Never married15.8% Now married0.0% Separated0.0% Widowed47.4% DivorcedWomen who did not give birth in the past 12 months Now married:
35.7% (15)Unmarried:
64.3% (27)
Marital status - Asian population 15 years and over
Males 30.8% Never married62.7% Now married0.0% Separated0.7% Widowed5.8% DivorcedFemales 24.5% Never married50.6% Now married4.4% Separated7.2% Widowed13.3% DivorcedWomen who gave birth in the past 12 months Now married:
100.0% (10)Unmarried:
0.0% (0)
Women who did not give birth in the past 12 months Now married:
49.5% (245)Unmarried:
50.5% (250)
Marital status - Native Hawaiian / Pacific Islander population 15 years and over
Males 48.6% Never married37.2% Now married0.0% Separated6.2% Widowed8.0% DivorcedFemales 53.3% Never married37.6% Now married5.2% Separated0.0% Widowed3.9% DivorcedWomen who did not give birth in the past 12 months Now married:
41.7% (122)Unmarried:
58.3% (170)
Marital status - Other race population 15 years and over
Males 36.6% Never married42.1% Now married18.3% Separated0.0% Widowed3.0% DivorcedFemales 48.5% Never married41.7% Now married0.0% Separated6.9% Widowed2.9% DivorcedWomen who gave birth in the past 12 months Now married:
0.0% (0)Unmarried:
100.0% (8)
Women who did not give birth in the past 12 months Now married:
42.9% (75)Unmarried:
57.1% (100)
Marital status - Two or more races population 15 years and over
Males 49.9% Never married35.8% Now married0.0% Separated6.3% Widowed8.0% DivorcedFemales 37.5% Never married56.9% Now married0.0% Separated3.9% Widowed1.7% DivorcedWomen who gave birth in the past 12 months Now married:
73.3% (14)Unmarried:
26.7% (5)
Women who did not give birth in the past 12 months Now married:
53.2% (211)Unmarried:
46.8% (186)
Marital status - White alone, not Hispanic / Latino population 15 years and over
Males 35.0% Never married49.7% Now married1.1% Separated0.8% Widowed13.5% DivorcedFemales 25.1% Never married48.6% Now married0.0% Separated5.7% Widowed20.7% DivorcedWomen who gave birth in the past 12 months Now married:
93.4% (55)Unmarried:
6.6% (4)
Women who did not give birth in the past 12 months Now married:
47.3% (488)Unmarried:
52.7% (544)
Marital status - Hispanic or Latino population 15 years and over
Males 48.0% Never married44.9% Now married6.1% Separated0.0% Widowed1.0% DivorcedFemales 33.5% Never married58.7% Now married0.0% Separated6.7% Widowed1.1% DivorcedWomen who gave birth in the past 12 months Now married:
0.0% (0)Unmarried:
100.0% (8)
Women who did not give birth in the past 12 months Now married:
60.3% (269)Unmarried:
39.7% (177)
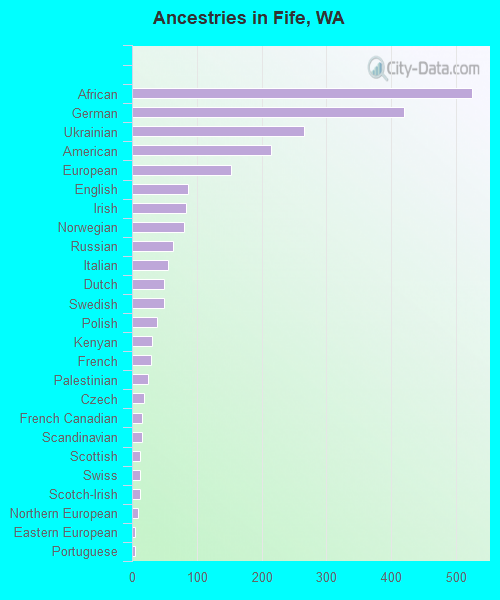
Ancestries in Fife
525 8.7% African420 6.9% German266 4.4% Ukrainian214 3.5% American153 2.5% European87 1.4% English83 1.4% Irish80 1.3% Norwegian64 1.1% Russian55 0.9% Italian50 0.8% Dutch49 0.8% Swedish38 0.6% Polish31 0.5% Kenyan30 0.5% French25 0.4% Palestinian19 0.3% Czech16 0.3% French Canadian16 0.3% Scandinavian13 0.2% Scottish13 0.2% Swiss12 0.2% Scotch-Irish10 0.2% Northern European5 0.08% Eastern European5 0.08% Portuguese4 0.07% Bulgarian4 0.07% Danish4 0.07% Finnish4 0.07% West Indian2 0.03% Arab
Geographical mobility in Fife Same house 1 year ago 3,813 84.6% White (Caucasian)1,374 97.0% Black or African American244 91.0% American Indian / Alaska Native1,370 75.6% Asian423 49.6% Native Hawaiian / Pacific Islander352 77.2% Other race1,641 93.7% Two or more races3,461 83.8% White alone, not Hispanic / Latino1,638 89.3% Hispanic or LatinoMoved within same county 328 7.3% White / Caucasian27 1.9% Black or African American24 9.1% American Indian / Alaska Native186 10.2% Asian301 35.3% Native Hawaiian / Pacific Islander50 11.1% Other race68 3.9% Two or more races328 7.9% White alone, not Hispanic / Latino91 5.0% Hispanic or LatinoMoved within same state 223 4.9% White / Caucasian11 0.8% Black or African American4 1.6% American Indian / Alaska Native246 13.5% Asian103 12.0% Native Hawaiian / Pacific Islander66 14.6% Other race39 2.2% Two or more races214 5.2% White alone, not Hispanic / Latino90 4.9% Hispanic or LatinoMoved from different state 93 2.1% White / Caucasian39 2.8% Black or African American12 0.6% Asian12 1.4% Native Hawaiian / Pacific Islander75 1.8% White alone, not Hispanic / Latino16 0.9% Hispanic or LatinoMoved from abroad 26 0.6% White5 0.3% Black or African American36 2.0% Asian26 1.5% Two or more races26 0.6% White alone, not Hispanic / Latino
Children Nativity (place of birth) in Fife
Children under 6 years - Living with two parents Both parents native 480 100.0% NativeBoth parents foreign-born 160 100.0% NativeOne native, one foreign-born parent 79 100.0% NativeChildren under 6 years - Living with one parent Native parent 242 100.0% NativeForeign-born parent 23 37.5% Native38 62.5% Foreign-bornChildren 6 to 17 years - Living with two parents Both parents native 530 100.0% NativeBoth parents foreign-born 354 57.0% Native267 43.0% Foreign-bornOne native, one foreign-born parent 112 100.0% NativeChildren 6 to 17 years - Living with one parent Native parent 232 100.0% NativeForeign-born parent 126 56.0% Native99 44.0% Foreign-born
Grandparents responsible for own grandchildren in Fife
Grandparents (30 to 59 years) White / Caucasian 9 69.2% Responsible for grandchildren4 30.8% Not responsible for grandchildrenBlack or African American 41 100.0% Responsible for grandchildrenAmerican Indian / Alaska Native 6 100.0% Responsible for grandchildrenAsian 5 100.0% Not responsible for grandchildrenNative Hawaiian / Pacific Islander 47 100.0% Not responsible for grandchildrenWhite alone, not Hispanic / Latino 8 65.7% Responsible for grandchildren4 34.3% Not responsible for grandchildren
Grandparents (60 years and over) White / Caucasian 23 100.0% Not responsible for grandchildrenBlack or African American 35 100.0% Responsible for grandchildrenAmerican Indian / Alaska Native 10 100.0% Not responsible for grandchildrenAsian 12 100.0% Not responsible for grandchildrenWhite alone, not Hispanic / Latino 23 100.0% Not responsible for grandchildren