Races in Federal Way, Washington (WA) Detailed Stats
Data:
Races - White alone (%)
Races - White alone (% change since 2000)
Races - Black alone (%)
Races - Black alone (% change since 2000)
Races - American Indian alone (%)
Races - American Indian alone (% change since 2000)
Races - Asian alone (%)
Races - Asian alone (% change since 2000)
Races - Hispanic (%)
Races - Hispanic (% change since 2000)
Races - Native Hawaiian and Other Pacific Islander alone (%)
Races - Native Hawaiian and Other Pacific Islander alone (% change since 2000)
Races - Two or more races(%)
Races - Two or more races(% change since 2000)
Races - Other race alone (%)
Races - Other race alone (% change since 2000)
Racial diversity
Place of birth - Born in state of residence (%)
Place of birth - Born in state of residence (%) - White
Place of birth - Born in state of residence (%) - Black or African American
Place of birth - Born in state of residence (%) - Asian
Place of birth - Born in state of residence (%) - Hispanic or Latino
Place of birth - Born in state of residence (%) - American Indian and Alaska Native
Place of birth - Born in state of residence (%) - Multirace
Place of birth - Born in state of residence (%) - Other Race
Place of birth - Born in other state (%)
Place of birth - Born in other state (%) - White
Place of birth - Born in other state (%) - Black or African American
Place of birth - Born in other state (%) - Asian
Place of birth - Born in other state (%) - Hispanic or Latino
Place of birth - Born in other state (%) - American Indian and Alaska Native
Place of birth - Born in other state (%) - Multirace
Place of birth - Born in other state (%) - Other Race
Place of birth - Native, outside of US (%)
Place of birth - Native, outside of US (%) - White
Place of birth - Native, outside of US (%) - Black or African American
Place of birth - Native, outside of US (%) - Asian
Place of birth - Native, outside of US (%) - Hispanic or Latino
Place of birth - Native, outside of US (%) - American Indian and Alaska Native
Place of birth - Native, outside of US (%) - Multirace
Place of birth - Native, outside of US (%) - Other Race
Place of birth - Foreign born (%)
Place of birth - Foreign born (%) - White
Place of birth - Foreign born (%) - Black or African American
Place of birth - Foreign born (%) - Asian
Place of birth - Foreign born (%) - Hispanic or Latino
Place of birth - Foreign born (%) - American Indian and Alaska Native
Place of birth - Foreign born (%) - Multirace
Place of birth - Foreign born (%) - Other Race
Residents speaking English at home (%)
Residents speaking English at home - Born in the United States (%)
Residents speaking English at home - Native, born elsewhere (%)
Residents speaking English at home - Foreign born (%)
Residents speaking Spanish at home (%)
Residents speaking Spanish at home - Born in the United States (%)
Residents speaking Spanish at home - Native, born elsewhere (%)
Residents speaking Spanish at home - Foreign born (%)
Residents speaking other language at home (%)
Residents speaking other language at home - Born in the United States (%)
Residents speaking other language at home - Native, born elsewhere (%)
Residents speaking other language at home - Foreign born (%)
Marital status - Never married (%)
Marital status - Now married (%)
Marital status - Separated (%)
Marital status - Widowed (%)
Marital status - Divorced (%)
Ancestries Reported - Arab (%)
Ancestries Reported - Czech (%)
Ancestries Reported - Danish (%)
Ancestries Reported - Dutch (%)
Ancestries Reported - English (%)
Ancestries Reported - French (%)
Ancestries Reported - French Canadian (%)
Ancestries Reported - German (%)
Ancestries Reported - Greek (%)
Ancestries Reported - Hungarian (%)
Ancestries Reported - Irish (%)
Ancestries Reported - Italian (%)
Ancestries Reported - Lithuanian (%)
Ancestries Reported - Norwegian (%)
Ancestries Reported - Polish (%)
Ancestries Reported - Portuguese (%)
Ancestries Reported - Russian (%)
Ancestries Reported - Scotch-Irish (%)
Ancestries Reported - Scottish (%)
Ancestries Reported - Slovak (%)
Ancestries Reported - Subsaharan African (%)
Ancestries Reported - Swedish (%)
Ancestries Reported - Swiss (%)
Ancestries Reported - Ukrainian (%)
Ancestries Reported - United States (%)
Ancestries Reported - Welsh (%)
Ancestries Reported - West Indian (%)
Ancestries Reported - Other (%)
Geographical mobility - Same house 1 year ago (%)
Geographical mobility - Same house 1 year ago (%) - White
Geographical mobility - Same house 1 year ago (%) - Black or African American
Geographical mobility - Same house 1 year ago (%) - Asian
Geographical mobility - Same house 1 year ago (%) - Hispanic or Latino
Geographical mobility - Same house 1 year ago (%) - American Indian and Alaska Native
Geographical mobility - Same house 1 year ago (%) - Multirace
Geographical mobility - Same house 1 year ago (%) - Other Race
Geographical mobility - Moved within same county (%)
Geographical mobility - Moved within same county (%) - White
Geographical mobility - Moved within same county (%) - Black or African American
Geographical mobility - Moved within same county (%) - Asian
Geographical mobility - Moved within same county (%) - Hispanic or Latino
Geographical mobility - Moved within same county (%) - American Indian and Alaska Native
Geographical mobility - Moved within same county (%) - Multirace
Geographical mobility - Moved within same county (%) - Other Race
Geographical mobility - Moved from different county within same state (%)
Geographical mobility - Moved from different county within same state (%) - White
Geographical mobility - Moved from different county within same state (%) - Black or African American
Geographical mobility - Moved from different county within same state (%) - Asian
Geographical mobility - Moved from different county within same state (%) - Hispanic or Latino
Geographical mobility - Moved from different county within same state (%) - American Indian and Alaska Native
Geographical mobility - Moved from different county within same state (%) - Multirace
Geographical mobility - Moved from different county within same state (%) - Other Race
Geographical mobility - Moved from different state (%)
Geographical mobility - Moved from different state (%) - White
Geographical mobility - Moved from different state (%) - Black or African American
Geographical mobility - Moved from different state (%) - Asian
Geographical mobility - Moved from different state (%) - Hispanic or Latino
Geographical mobility - Moved from different state (%) - American Indian and Alaska Native
Geographical mobility - Moved from different state (%) - Multirace
Geographical mobility - Moved from different state (%) - Other Race
Geographical mobility - Moved from abroad (%)
Geographical mobility - Moved from abroad (%) - White
Geographical mobility - Moved from abroad (%) - Black or African American
Geographical mobility - Moved from abroad (%) - Asian
Geographical mobility - Moved from abroad (%) - Hispanic or Latino
Geographical mobility - Moved from abroad (%) - American Indian and Alaska Native
Geographical mobility - Moved from abroad (%) - Multirace
Geographical mobility - Moved from abroad (%) - Other Race
Place of birth for the foreign-born population - Ireland (%)
Place of birth for the foreign-born population - Denmark (%)
Place of birth for the foreign-born population - Norway (%)
Place of birth for the foreign-born population - Sweden (%)
Place of birth for the foreign-born population - United Kingdom (%)
Place of birth for the foreign-born population - England (%)
Place of birth for the foreign-born population - Scotland (%)
Place of birth for the foreign-born population - Other Northern Europe (%)
Place of birth for the foreign-born population - Austria (%)
Place of birth for the foreign-born population - Belgium (%)
Place of birth for the foreign-born population - France (%)
Place of birth for the foreign-born population - Germany (%)
Place of birth for the foreign-born population - Netherlands (%)
Place of birth for the foreign-born population - Switzerland (%)
Place of birth for the foreign-born population - Other Western Europe (%)
Place of birth for the foreign-born population - Greece (%)
Place of birth for the foreign-born population - Italy (%)
Place of birth for the foreign-born population - Portugal (%)
Place of birth for the foreign-born population - Spain (%)
Place of birth for the foreign-born population - Other Southern Europe (%)
Place of birth for the foreign-born population - Albania (%)
Place of birth for the foreign-born population - Belarus (%)
Place of birth for the foreign-born population - Bosnia and Herzegovina (%)
Place of birth for the foreign-born population - Bulgaria (%)
Place of birth for the foreign-born population - Croatia (%)
Place of birth for the foreign-born population - Czechoslovakia (%)
Place of birth for the foreign-born population - Hungary (%)
Place of birth for the foreign-born population - Latvia (%)
Place of birth for the foreign-born population - Lithuania (%)
Place of birth for the foreign-born population - North Macedonia (Macedonia) (%)
Place of birth for the foreign-born population - Moldova (%)
Place of birth for the foreign-born population - Poland (%)
Place of birth for the foreign-born population - Romania (%)
Place of birth for the foreign-born population - Russia (%)
Place of birth for the foreign-born population - Serbia (%)
Place of birth for the foreign-born population - Ukraine (%)
Place of birth for the foreign-born population - Other Eastern Europe (%)
Place of birth for the foreign-born population - China (%)
Place of birth for the foreign-born population - Hong Kong (%)
Place of birth for the foreign-born population - Taiwan (%)
Place of birth for the foreign-born population - Japan (%)
Place of birth for the foreign-born population - Korea (%)
Place of birth for the foreign-born population - Other Eastern Asia (%)
Place of birth for the foreign-born population - Afghanistan (%)
Place of birth for the foreign-born population - Bangladesh (%)
Place of birth for the foreign-born population - India (%)
Place of birth for the foreign-born population - Iran (%)
Place of birth for the foreign-born population - Kazakhstan (%)
Place of birth for the foreign-born population - Nepal (%)
Place of birth for the foreign-born population - Pakistan (%)
Place of birth for the foreign-born population - Sri Lanka (%)
Place of birth for the foreign-born population - Uzbekistan (%)
Place of birth for the foreign-born population - Other South Central Asia (%)
Place of birth for the foreign-born population - Burma (%)
Place of birth for the foreign-born population - Cambodia (%)
Place of birth for the foreign-born population - Indonesia (%)
Place of birth for the foreign-born population - Laos (%)
Place of birth for the foreign-born population - Malaysia (%)
Place of birth for the foreign-born population - Philippines (%)
Place of birth for the foreign-born population - Singapore (%)
Place of birth for the foreign-born population - Thailand (%)
Place of birth for the foreign-born population - Vietnam (%)
Place of birth for the foreign-born population - Other South Eastern Asia (%)
Place of birth for the foreign-born population - Armenia (%)
Place of birth for the foreign-born population - Iraq (%)
Place of birth for the foreign-born population - Israel (%)
Place of birth for the foreign-born population - Jordan (%)
Place of birth for the foreign-born population - Kuwait (%)
Place of birth for the foreign-born population - Lebanon (%)
Place of birth for the foreign-born population - Saudi Arabia (%)
Place of birth for the foreign-born population - Syria (%)
Place of birth for the foreign-born population - Turkey (%)
Place of birth for the foreign-born population - Yemen (%)
Place of birth for the foreign-born population - Other Western Asia (%)
Place of birth for the foreign-born population - Eritrea (%)
Place of birth for the foreign-born population - Ethiopia (%)
Place of birth for the foreign-born population - Kenya (%)
Place of birth for the foreign-born population - Somalia (%)
Place of birth for the foreign-born population - Uganda (%)
Place of birth for the foreign-born population - Zimbabwe (%)
Place of birth for the foreign-born population - Other Eastern Africa (%)
Place of birth for the foreign-born population - Cameroon (%)
Place of birth for the foreign-born population - Congo (%)
Place of birth for the foreign-born population - Democratic Republic of Congo (Zaire) (%)
Place of birth for the foreign-born population - Other Middle Africa (%)
Place of birth for the foreign-born population - Egypt (%)
Place of birth for the foreign-born population - Morocco (%)
Place of birth for the foreign-born population - Sudan (%)
Place of birth for the foreign-born population - Other Northern Africa (%)
Place of birth for the foreign-born population - South Africa (%)
Place of birth for the foreign-born population - Other Southern Africa (%)
Place of birth for the foreign-born population - Cabo Verde (%)
Place of birth for the foreign-born population - Ghana (%)
Place of birth for the foreign-born population - Liberia (%)
Place of birth for the foreign-born population - Nigeria (%)
Place of birth for the foreign-born population - Senegal (%)
Place of birth for the foreign-born population - Sierra Leone (%)
Place of birth for the foreign-born population - Other Western Africa (%)
Place of birth for the foreign-born population - Australia (%)
Place of birth for the foreign-born population - New Zealand (%)
Place of birth for the foreign-born population - Fiji (%)
Place of birth for the foreign-born population - Micronesia (%)
Place of birth for the foreign-born population - Bahamas (%)
Place of birth for the foreign-born population - Barbados (%)
Place of birth for the foreign-born population - Cuba (%)
Place of birth for the foreign-born population - Dominica (%)
Place of birth for the foreign-born population - Dominican Republic (%)
Place of birth for the foreign-born population - Grenada (%)
Place of birth for the foreign-born population - Haiti (%)
Place of birth for the foreign-born population - Jamaica (%)
Place of birth for the foreign-born population - St. Vincent and the Grenadines (%)
Place of birth for the foreign-born population - Trinidad and Tobago (%)
Place of birth for the foreign-born population - West Indies (%)
Place of birth for the foreign-born population - Other Caribbean (%)
Place of birth for the foreign-born population - Belize (%)
Place of birth for the foreign-born population - Costa Rica (%)
Place of birth for the foreign-born population - El Salvador (%)
Place of birth for the foreign-born population - Guatemala (%)
Place of birth for the foreign-born population - Honduras (%)
Place of birth for the foreign-born population - Mexico (%)
Place of birth for the foreign-born population - Nicaragua (%)
Place of birth for the foreign-born population - Panama (%)
Place of birth for the foreign-born population - Other Central America (%)
Place of birth for the foreign-born population - Argentina (%)
Place of birth for the foreign-born population - Bolivia (%)
Place of birth for the foreign-born population - Brazil (%)
Place of birth for the foreign-born population - Chile (%)
Place of birth for the foreign-born population - Colombia (%)
Place of birth for the foreign-born population - Ecuador (%)
Place of birth for the foreign-born population - Guyana (%)
Place of birth for the foreign-born population - Peru (%)
Place of birth for the foreign-born population - Uruguay (%)
Place of birth for the foreign-born population - Venezuela (%)
Place of birth for the foreign-born population - Other South America (%)
Place of birth for the foreign-born population - Canada (%)
Place of birth for the foreign-born population - Other Northern America (%)
Place of birth for the foreign-born population - Other (%)
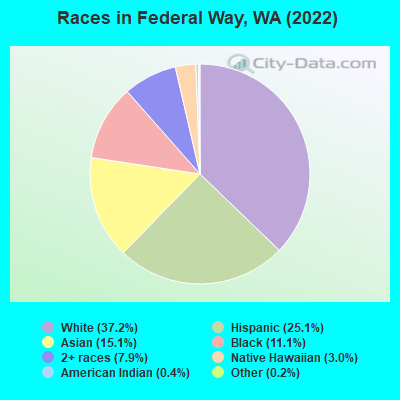
According to 2022 data, the most numerous races in Federal Way, WA are White alone (36,370 residents), Hispanic (24,529 residents), and Asian alone (14,812 residents). 59.5% of Federal Way residents speak English at home. 28.9% of Federal Way, WA residents are foreign-born (11.4% born in Asia, 7.8% born in Latin America, 4.3% born in Africa), which is 48.0% greater than the foreign-born rate of 15.0% across the entire state of Washington.
Race distribution in Federal Way
2000 2022
55,050 66.1% White alone 10,156 12.2% Asian alone 6,439 7.7% Black alone 6,266 7.5% Hispanic 3,701 4.4% Two or more races 840 1.0% Native Hawaiian and Other 639 0.8% American Indian alone 168 0.2% Other race alone
36,370 37.2% White alone 24,529 25.1% Hispanic 14,812 15.1% Asian alone 10,847 11.1% Black alone 7,743 7.9% Two or more races 2,974 3.0% Native Hawaiian and Other 376 0.4% American Indian alone 212 0.2% Other race alone
2000 2022
4,652,490 78.9% White alone 441,509 7.5% Hispanic 319,401 5.4% Asian alone 184,631 3.1% Black alone 175,926 3.0% Two or more races 85,396 1.4% American Indian alone 22,779 0.4% Native Hawaiian and Other 11,989 0.2% Other race alone
4,941,456 63.5% White alone 1,093,313 14.0% Hispanic 755,832 9.7% Asian alone 523,448 6.7% Two or more races 299,537 3.8% Black alone 69,024 0.9% American Indian alone 52,231 0.7% Native Hawaiian and Other 50,945 0.7% Other race alone
Income and house value in Federal Way Median household income in 2022 $81,811 White non-Hispanic householders$65,765 Black householders$21,109 American Indian and Alaska Native householders$75,805 Asian householders$72,340 Native Hawaiian and other Pacific Islander householders$76,273 Some other race householders$96,789 Two or more races householders$95,216 Hispanic or Latino race householdersMedian 2022 house value $589,137 White Non-Hispanic householders$560,146 Black or African American householders$671,968 American Indian or Alaska Native householders $642,632 Asian householders$568,084 Native Hawaiian and other Pacific Islander householders$582,924 Some other race householders$616,747 Two or more races householders$573,606 Hispanic or Latino householders
Median age by race in Federal Way
52.3 Median age for White residents53.0 51.9 39.3 Median age for Black or African American residents34.5 41.9 36.8 Median age for American Indian / Alaska Native residents54.1 35.1 49.4 Median age for Asian residents37.6 57.1 48.1 Median age for Native Hawaiian / Pacific Islander residents38.2 48.9 20.9 Median age for Other race residents23.4 19.0 30.0 Median age for Two or more races residents30.1 27.8 52.5 Median age for White alone residents52.8 52.3 23.1 Median age for Hispanic or Latino residents23.8 20.5
Owner/renter occupied households by race in Federal Way
House owners and renters - White residents 11,455 64.9% Owner occupied6,203 35.1% Renter occupiedHouse owners and renters - Black or African American residents 1,477 30.4% Owner occupied3,387 69.6% Renter occupiedHouse owners and renters - American Indian / Alaska Native residents 98 29.0% Owner occupied240 71.0% Renter occupiedHouse owners and renters - Asian residents 3,774 69.3% Owner occupied1,672 30.7% Renter occupiedHouse owners and renters - Native Hawaiian / Pacific Islander residents 357 46.7% Owner occupied407 53.3% Renter occupiedHouse owners and renters - Other race residents 834 27.8% Owner occupied2,161 72.2% Renter occupiedHouse owners and renters - Two or more races residents 2,365 57.1% Owner occupied1,776 42.9% Renter occupiedHouse owners and renters - White alone residents 11,455 65.2% Owner occupied6,108 34.8% Renter occupiedHouse owners and renters - Hispanic or Latino residents 2,138 45.0% Owner occupied2,618 55.0% Renter occupied
Language usage in Federal Way
English speakers - Total 59.5% of residents of Federal Way speak English at home.
20.7% of residents speak Spanish at home 8,751 45.5% Speak English very well10,463 54.5% Speak English less than very well19.8% of residents speak other language at home 9,180 50.1% Speak English very well9,152 49.9% Speak English less than very well
English speakers - Born in the United States 89.4% of residents of Federal Way speak English at home.
9.1% of residents speak Spanish at home 1,548 76.5% Speak English very well475 23.5% Speak English less than very well1.5% of residents speak other language at home 238 69.6% Speak English very well104 30.4% Speak English less than very well
English speakers - Native, born elsewhere 74.2% of residents of Federal Way speak English at home.
10.6% of residents speak Spanish at home 54 38.3% Speak English very well87 61.7% Speak English less than very well15.1% of residents speak other language at home 200 100.0% Speak English very well
English speakers - Foreign-born 13.1% of residents of Federal Way speak English at home.
36.4% of residents speak Spanish at home 2,859 24.9% Speak English very well8,606 75.1% Speak English less than very well50.6% of residents speak other language at home 7,403 46.4% Speak English very well8,539 53.6% Speak English less than very well
White (Caucasian) - Speak only English Native:
98.4% (32,175)Foreign-born:
34.5% (1,038)
White (Caucasian) - Speak another language Native:
1.6% (511)Foreign-born:
65.5% (1,970)
Black or African American - Speak only English Native:
97.9% (7,257)Foreign-born:
21.1% (609)
Black or African American - Speak another language Native:
2.1% (158)Foreign-born:
78.9% (2,277)
American Indian / Alaska Native - Speak another language Native:
6.3% (52)Foreign-born:
100.0% (144)
Asian - Speak only English Native:
55.2% (1,932)Foreign-born:
8.6% (955)
Asian - Speak another language Native:
44.8% (1,569)Foreign-born:
91.4% (10,164)
Native Hawaiian / Pacific Islander - Speak only English Native:
51.2% (434)Foreign-born:
19.9% (313)
Native Hawaiian / Pacific Islander - Speak another language Native:
54.2% (459)Foreign-born:
79.3% (1,247)
Other race - Speak only English Native:
20.8% (1,280)Foreign-born:
1.5% (131)
Other race - Speak another language Native:
79.2% (4,862)Foreign-born:
98.5% (8,367)
Two or more races - Speak only English Native:
71.9% (7,581)Foreign-born:
6.0% (204)
Two or more races - Speak another language Native:
28.1% (2,962)Foreign-born:
94.0% (3,215)
White alone - Speak only English Native:
98.4% (31,956)Foreign-born:
34.3% (1,027)
White alone - Speak another language Native:
1.6% (511)Foreign-born:
65.7% (1,970)
Hispanic or Latino - Speak only English Native:
28.8% (3,039)Foreign-born:
2.4% (278)
Hispanic or Latino - Speak another language Native:
71.2% (7,520)Foreign-born:
97.6% (11,177)
Foreign-born residents in Federal Way 28,900 residents are foreign born (11.4% Asia , 7.8% Latin America , 4.3% Africa ).
This city:
28.9%Washington:
14.9%
Marital status for residents in Federal Way Marital status - White (Caucasian) population 15 years and over
Males 33.2% Never married52.1% Now married1.1% Separated3.9% Widowed9.7% DivorcedFemales 30.8% Never married45.9% Now married0.7% Separated7.6% Widowed15.1% DivorcedWomen who gave birth in the past 12 months Now married:
54.2% (252)Unmarried:
45.8% (213)
Women who did not give birth in the past 12 months Now married:
32.0% (2,171)Unmarried:
68.0% (4,618)
Marital status - Black or African American population 15 years and over
Males 43.7% Never married37.3% Now married1.5% Separated0.0% Widowed17.6% DivorcedFemales 49.8% Never married26.5% Now married1.0% Separated0.0% Widowed22.8% DivorcedWomen who gave birth in the past 12 months Now married:
76.5% (363)Unmarried:
23.5% (111)
Women who did not give birth in the past 12 months Now married:
32.7% (1,168)Unmarried:
67.3% (2,401)
Marital status - American Indian / Alaska Native population 15 years and over
Males 59.5% Never married26.8% Now married0.0% Separated0.0% Widowed13.8% DivorcedFemales 38.0% Never married33.2% Now married0.0% Separated0.0% Widowed28.8% DivorcedWomen who gave birth in the past 12 months Now married:
0.0% (0)Unmarried:
100.0% (16)
Women who did not give birth in the past 12 months Now married:
38.2% (79)Unmarried:
61.8% (128)
Marital status - Asian population 15 years and over
Males 43.6% Never married54.0% Now married0.0% Separated1.5% Widowed0.9% DivorcedFemales 20.0% Never married52.7% Now married0.6% Separated8.6% Widowed18.0% DivorcedWomen who gave birth in the past 12 months Now married:
100.0% (104)Unmarried:
0.0% (0)
Women who did not give birth in the past 12 months Now married:
57.9% (1,333)Unmarried:
42.1% (969)
Marital status - Native Hawaiian / Pacific Islander population 15 years and over
Males 38.7% Never married61.3% Now married0.0% Separated0.0% Widowed0.0% DivorcedFemales 38.8% Never married41.3% Now married0.0% Separated13.2% Widowed6.6% DivorcedWomen who gave birth in the past 12 months Now married:
21.7% (11)Unmarried:
78.3% (39)
Women who did not give birth in the past 12 months Now married:
42.5% (321)Unmarried:
57.5% (434)
Marital status - Other race population 15 years and over
Males 49.6% Never married43.7% Now married1.4% Separated0.8% Widowed4.5% DivorcedFemales 43.1% Never married43.6% Now married4.7% Separated0.9% Widowed7.7% DivorcedWomen who gave birth in the past 12 months Now married:
0.0% (0)Unmarried:
100.0% (104)
Women who did not give birth in the past 12 months Now married:
45.3% (1,447)Unmarried:
54.7% (1,744)
Marital status - Two or more races population 15 years and over
Males 51.0% Never married40.2% Now married0.0% Separated1.2% Widowed7.7% DivorcedFemales 29.9% Never married52.7% Now married1.1% Separated4.1% Widowed12.2% DivorcedWomen who gave birth in the past 12 months Now married:
100.0% (54)Unmarried:
0.0% (0)
Women who did not give birth in the past 12 months Now married:
36.9% (1,292)Unmarried:
63.1% (2,214)
Marital status - White alone, not Hispanic / Latino population 15 years and over
Males 33.2% Never married52.6% Now married1.1% Separated3.9% Widowed9.3% DivorcedFemales 30.4% Never married46.1% Now married0.7% Separated7.6% Widowed15.2% DivorcedWomen who gave birth in the past 12 months Now married:
54.2% (252)Unmarried:
45.8% (213)
Women who did not give birth in the past 12 months Now married:
32.4% (2,171)Unmarried:
67.6% (4,523)
Marital status - Hispanic or Latino population 15 years and over
Males 52.1% Never married43.4% Now married0.7% Separated1.4% Widowed2.5% DivorcedFemales 45.3% Never married44.0% Now married1.4% Separated2.7% Widowed6.5% DivorcedWomen who gave birth in the past 12 months Now married:
34.3% (74)Unmarried:
65.7% (141)
Women who did not give birth in the past 12 months Now married:
46.1% (2,159)Unmarried:
53.9% (2,523)
Ancestries in Federal Way
2,482 4.6% American1,894 3.5% German1,662 3.1% European1,404 2.6% English1,339 2.5% Ukrainian1,206 2.3% African1,035 1.9% Turkish877 1.6% Kenyan845 1.6% Irish680 1.3% Italian601 1.1% Norwegian585 1.1% Nigerian575 1.1% Ethiopian526 1.0% Russian302 0.6% Ghanaian261 0.5% Dutch245 0.5% Polish224 0.4% Ugandan199 0.4% British196 0.4% Scottish170 0.3% Swedish167 0.3% French166 0.3% Armenian158 0.3% French Canadian155 0.3% Romanian152 0.3% Scandinavian152 0.3% Afghan142 0.3% Somali140 0.3% Danish117 0.2% Canadian108 0.2% Serbian88 0.2% Liberian87 0.2% Slavic86 0.2% Northern European80 0.1% Brazilian79 0.1% Austrian76 0.1% Iranian75 0.1% Jamaican73 0.1% Eastern European57 0.1% Yugoslavian53 0.10% Haitian48 0.09% Portuguese48 0.09% Guyanese48 0.09% Welsh46 0.09% Swiss45 0.08% Greek45 0.08% Barbadian44 0.08% Hungarian41 0.08% Scotch-Irish34 0.06% Assyrian31 0.06% Lebanese29 0.05% Croatian28 0.05% Latvian27 0.05% Lithuanian25 0.05% Maltese22 0.04% Czech18 0.03% Slovak18 0.03% Slovene17 0.03% Israeli14 0.03% Icelander13 0.02% Czechoslovakian12 0.02% Finnish9 0.02% South African7 0.01% Celtic
Geographical mobility in Federal Way Same house 1 year ago 32,927 89.9% White (Caucasian)12,415 76.0% Black or African American708 71.7% American Indian / Alaska Native12,852 85.5% Asian2,049 88.3% Native Hawaiian / Pacific Islander9,088 79.7% Other race13,851 89.6% Two or more races32,701 90.0% White alone, not Hispanic / Latino15,364 82.3% Hispanic or LatinoMoved within same county 1,494 4.1% White / Caucasian2,247 13.8% Black or African American180 18.2% American Indian / Alaska Native971 6.5% Asian256 11.0% Native Hawaiian / Pacific Islander1,878 16.5% Other race860 5.6% Two or more races1,494 4.1% White alone, not Hispanic / Latino2,574 13.8% Hispanic or LatinoMoved within same state 1,740 4.7% White / Caucasian573 3.5% Black or African American37 3.8% American Indian / Alaska Native381 2.5% Asian21 0.9% Native Hawaiian / Pacific Islander158 1.4% Other race695 4.5% Two or more races1,645 4.5% White alone, not Hispanic / Latino481 2.6% Hispanic or LatinoMoved from different state 421 1.1% White / Caucasian637 3.9% Black or African American65 6.6% American Indian / Alaska Native598 4.0% Asian12 0.5% Native Hawaiian / Pacific Islander257 2.3% Other race219 1.4% Two or more races421 1.2% White alone, not Hispanic / Latino222 1.2% Hispanic or LatinoMoved from abroad 59 0.2% White315 1.9% Black or African American233 1.5% Asian113 0.7% Two or more races59 0.2% White alone, not Hispanic / Latino55 0.3% Hispanic or Latino
Children Nativity (place of birth) in Federal Way
Children under 6 years - Living with two parents Both parents native 1,313 100.0% NativeBoth parents foreign-born 2,219 89.7% Native255 10.3% Foreign-bornOne native, one foreign-born parent 927 100.0% NativeChildren under 6 years - Living with one parent Native parent 615 100.0% NativeForeign-born parent 584 100.0% NativeChildren 6 to 17 years - Living with two parents Both parents native 1,657 100.0% NativeBoth parents foreign-born 4,755 65.5% Native2,506 34.5% Foreign-bornOne native, one foreign-born parent 1,051 100.0% NativeChildren 6 to 17 years - Living with one parent Native parent 1,357 100.0% NativeForeign-born parent 1,676 50.6% Native1,637 49.4% Foreign-born
Place of birth for residents in Federal Way 11,942 Asia8,558 Americas8,186 Latin America6,689 Central America5,154 South Eastern Asia4,581 Eastern Asia4,500 Africa3,071 Eastern Africa2,580 Europe2,196 Eastern Europe2,066 South Central Asia1,363 China1,319 Oceania919 South America834 Western Africa577 Caribbean465 Middle Africa371 Northern America187 Northern Europe173 Western Europe140 Western Asia120 Australia and New Zealand Subregion24 Northern Africa23 Southern Europe13 Southern Africa4,767 Mexico2,953 Korea2,744 Philippines2,319 Kenya1,885 Vietnam1,012 Ukraine900 China745 Afghanistan601 El Salvador564 Honduras563 Russia492 Guatemala486 Uzbekistan482 Ethiopia451 Micronesia417 Haiti407 India371 Canada350 Democratic Republic of Congo (Zaire)347 Hong Kong285 Moldova282 Liberia277 Marshall Islands245 Nigeria239 Venezuela230 Ghana213 Japan205 Brazil198 Pakistan169 Kazakhstan167 Cambodia153 Somalia134 Thailand116 Peru115 Taiwan111 Costa Rica100 Laos98 Uganda98 Germany95 Belarus94 Congo89 New Zealand89 United Kingdom88 Poland88 Colombia87 Chile76 Dominican Republic71 Indonesia70 Ecuador69 Nicaragua68 Panama66 Jamaica58 Iran50 Guyana46 Armenia44 Bosnia and Herzegovina40 Latvia38 Belgium37 Burma (Myanmar)36 Turkey35 Togo35 England31 Australia31 Bolivia30 United Arab Emirates28 Romania27 Saudi Arabia26 Fiji25 Denmark24 Morocco23 Italy22 Scotland18 Switzerland17 Cuba16 Austria15 Ireland14 Serbia14 Belize13 South Africa13 Malaysia10 Argentina6 Czechoslovakia
Grandparents responsible for own grandchildren in Federal Way
Grandparents (30 to 59 years) White / Caucasian 44 13.8% Responsible for grandchildren277 86.2% Not responsible for grandchildrenBlack or African American 103 91.4% Responsible for grandchildren10 8.6% Not responsible for grandchildrenAmerican Indian / Alaska Native 14 100.0% Responsible for grandchildrenAsian 6 21.4% Responsible for grandchildren23 78.6% Not responsible for grandchildrenOther race 183 86.1% Responsible for grandchildren29 13.9% Not responsible for grandchildrenTwo or more races 95 35.3% Responsible for grandchildren175 64.7% Not responsible for grandchildrenWhite alone, not Hispanic / Latino 44 13.8% Responsible for grandchildren272 86.2% Not responsible for grandchildrenHispanic or Latino 60 24.4% Responsible for grandchildren186 75.6% Not responsible for grandchildrenGrandparents (60 years and over) White / Caucasian 414 56.3% Responsible for grandchildren321 43.7% Not responsible for grandchildrenBlack or African American 86 72.6% Responsible for grandchildren32 27.4% Not responsible for grandchildrenAmerican Indian / Alaska Native 25 100.0% Not responsible for grandchildrenAsian 127 25.3% Responsible for grandchildren374 74.7% Not responsible for grandchildrenOther race 19 19.7% Responsible for grandchildren76 80.3% Not responsible for grandchildrenTwo or more races 3 3.3% Responsible for grandchildren80 96.7% Not responsible for grandchildrenWhite alone, not Hispanic / Latino 411 57.3% Responsible for grandchildren306 42.7% Not responsible for grandchildrenHispanic or Latino 43 20.9% Responsible for grandchildren163 79.1% Not responsible for grandchildren