Races in Elyria, Ohio (OH) Detailed Stats
Data:
Races - White alone (%)
Races - White alone (% change since 2000)
Races - Black alone (%)
Races - Black alone (% change since 2000)
Races - American Indian alone (%)
Races - American Indian alone (% change since 2000)
Races - Asian alone (%)
Races - Asian alone (% change since 2000)
Races - Hispanic (%)
Races - Hispanic (% change since 2000)
Races - Native Hawaiian and Other Pacific Islander alone (%)
Races - Native Hawaiian and Other Pacific Islander alone (% change since 2000)
Races - Two or more races(%)
Races - Two or more races(% change since 2000)
Races - Other race alone (%)
Races - Other race alone (% change since 2000)
Racial diversity
Place of birth - Born in state of residence (%)
Place of birth - Born in state of residence (%) - White
Place of birth - Born in state of residence (%) - Black or African American
Place of birth - Born in state of residence (%) - Asian
Place of birth - Born in state of residence (%) - Hispanic or Latino
Place of birth - Born in state of residence (%) - American Indian and Alaska Native
Place of birth - Born in state of residence (%) - Multirace
Place of birth - Born in state of residence (%) - Other Race
Place of birth - Born in other state (%)
Place of birth - Born in other state (%) - White
Place of birth - Born in other state (%) - Black or African American
Place of birth - Born in other state (%) - Asian
Place of birth - Born in other state (%) - Hispanic or Latino
Place of birth - Born in other state (%) - American Indian and Alaska Native
Place of birth - Born in other state (%) - Multirace
Place of birth - Born in other state (%) - Other Race
Place of birth - Native, outside of US (%)
Place of birth - Native, outside of US (%) - White
Place of birth - Native, outside of US (%) - Black or African American
Place of birth - Native, outside of US (%) - Asian
Place of birth - Native, outside of US (%) - Hispanic or Latino
Place of birth - Native, outside of US (%) - American Indian and Alaska Native
Place of birth - Native, outside of US (%) - Multirace
Place of birth - Native, outside of US (%) - Other Race
Place of birth - Foreign born (%)
Place of birth - Foreign born (%) - White
Place of birth - Foreign born (%) - Black or African American
Place of birth - Foreign born (%) - Asian
Place of birth - Foreign born (%) - Hispanic or Latino
Place of birth - Foreign born (%) - American Indian and Alaska Native
Place of birth - Foreign born (%) - Multirace
Place of birth - Foreign born (%) - Other Race
Residents speaking English at home (%)
Residents speaking English at home - Born in the United States (%)
Residents speaking English at home - Native, born elsewhere (%)
Residents speaking English at home - Foreign born (%)
Residents speaking Spanish at home (%)
Residents speaking Spanish at home - Born in the United States (%)
Residents speaking Spanish at home - Native, born elsewhere (%)
Residents speaking Spanish at home - Foreign born (%)
Residents speaking other language at home (%)
Residents speaking other language at home - Born in the United States (%)
Residents speaking other language at home - Native, born elsewhere (%)
Residents speaking other language at home - Foreign born (%)
Marital status - Never married (%)
Marital status - Now married (%)
Marital status - Separated (%)
Marital status - Widowed (%)
Marital status - Divorced (%)
Ancestries Reported - Arab (%)
Ancestries Reported - Czech (%)
Ancestries Reported - Danish (%)
Ancestries Reported - Dutch (%)
Ancestries Reported - English (%)
Ancestries Reported - French (%)
Ancestries Reported - French Canadian (%)
Ancestries Reported - German (%)
Ancestries Reported - Greek (%)
Ancestries Reported - Hungarian (%)
Ancestries Reported - Irish (%)
Ancestries Reported - Italian (%)
Ancestries Reported - Lithuanian (%)
Ancestries Reported - Norwegian (%)
Ancestries Reported - Polish (%)
Ancestries Reported - Portuguese (%)
Ancestries Reported - Russian (%)
Ancestries Reported - Scotch-Irish (%)
Ancestries Reported - Scottish (%)
Ancestries Reported - Slovak (%)
Ancestries Reported - Subsaharan African (%)
Ancestries Reported - Swedish (%)
Ancestries Reported - Swiss (%)
Ancestries Reported - Ukrainian (%)
Ancestries Reported - United States (%)
Ancestries Reported - Welsh (%)
Ancestries Reported - West Indian (%)
Ancestries Reported - Other (%)
Geographical mobility - Same house 1 year ago (%)
Geographical mobility - Same house 1 year ago (%) - White
Geographical mobility - Same house 1 year ago (%) - Black or African American
Geographical mobility - Same house 1 year ago (%) - Asian
Geographical mobility - Same house 1 year ago (%) - Hispanic or Latino
Geographical mobility - Same house 1 year ago (%) - American Indian and Alaska Native
Geographical mobility - Same house 1 year ago (%) - Multirace
Geographical mobility - Same house 1 year ago (%) - Other Race
Geographical mobility - Moved within same county (%)
Geographical mobility - Moved within same county (%) - White
Geographical mobility - Moved within same county (%) - Black or African American
Geographical mobility - Moved within same county (%) - Asian
Geographical mobility - Moved within same county (%) - Hispanic or Latino
Geographical mobility - Moved within same county (%) - American Indian and Alaska Native
Geographical mobility - Moved within same county (%) - Multirace
Geographical mobility - Moved within same county (%) - Other Race
Geographical mobility - Moved from different county within same state (%)
Geographical mobility - Moved from different county within same state (%) - White
Geographical mobility - Moved from different county within same state (%) - Black or African American
Geographical mobility - Moved from different county within same state (%) - Asian
Geographical mobility - Moved from different county within same state (%) - Hispanic or Latino
Geographical mobility - Moved from different county within same state (%) - American Indian and Alaska Native
Geographical mobility - Moved from different county within same state (%) - Multirace
Geographical mobility - Moved from different county within same state (%) - Other Race
Geographical mobility - Moved from different state (%)
Geographical mobility - Moved from different state (%) - White
Geographical mobility - Moved from different state (%) - Black or African American
Geographical mobility - Moved from different state (%) - Asian
Geographical mobility - Moved from different state (%) - Hispanic or Latino
Geographical mobility - Moved from different state (%) - American Indian and Alaska Native
Geographical mobility - Moved from different state (%) - Multirace
Geographical mobility - Moved from different state (%) - Other Race
Geographical mobility - Moved from abroad (%)
Geographical mobility - Moved from abroad (%) - White
Geographical mobility - Moved from abroad (%) - Black or African American
Geographical mobility - Moved from abroad (%) - Asian
Geographical mobility - Moved from abroad (%) - Hispanic or Latino
Geographical mobility - Moved from abroad (%) - American Indian and Alaska Native
Geographical mobility - Moved from abroad (%) - Multirace
Geographical mobility - Moved from abroad (%) - Other Race
Place of birth for the foreign-born population - Ireland (%)
Place of birth for the foreign-born population - Denmark (%)
Place of birth for the foreign-born population - Norway (%)
Place of birth for the foreign-born population - Sweden (%)
Place of birth for the foreign-born population - United Kingdom (%)
Place of birth for the foreign-born population - England (%)
Place of birth for the foreign-born population - Scotland (%)
Place of birth for the foreign-born population - Other Northern Europe (%)
Place of birth for the foreign-born population - Austria (%)
Place of birth for the foreign-born population - Belgium (%)
Place of birth for the foreign-born population - France (%)
Place of birth for the foreign-born population - Germany (%)
Place of birth for the foreign-born population - Netherlands (%)
Place of birth for the foreign-born population - Switzerland (%)
Place of birth for the foreign-born population - Other Western Europe (%)
Place of birth for the foreign-born population - Greece (%)
Place of birth for the foreign-born population - Italy (%)
Place of birth for the foreign-born population - Portugal (%)
Place of birth for the foreign-born population - Spain (%)
Place of birth for the foreign-born population - Other Southern Europe (%)
Place of birth for the foreign-born population - Albania (%)
Place of birth for the foreign-born population - Belarus (%)
Place of birth for the foreign-born population - Bosnia and Herzegovina (%)
Place of birth for the foreign-born population - Bulgaria (%)
Place of birth for the foreign-born population - Croatia (%)
Place of birth for the foreign-born population - Czechoslovakia (%)
Place of birth for the foreign-born population - Hungary (%)
Place of birth for the foreign-born population - Latvia (%)
Place of birth for the foreign-born population - Lithuania (%)
Place of birth for the foreign-born population - North Macedonia (Macedonia) (%)
Place of birth for the foreign-born population - Moldova (%)
Place of birth for the foreign-born population - Poland (%)
Place of birth for the foreign-born population - Romania (%)
Place of birth for the foreign-born population - Russia (%)
Place of birth for the foreign-born population - Serbia (%)
Place of birth for the foreign-born population - Ukraine (%)
Place of birth for the foreign-born population - Other Eastern Europe (%)
Place of birth for the foreign-born population - China (%)
Place of birth for the foreign-born population - Hong Kong (%)
Place of birth for the foreign-born population - Taiwan (%)
Place of birth for the foreign-born population - Japan (%)
Place of birth for the foreign-born population - Korea (%)
Place of birth for the foreign-born population - Other Eastern Asia (%)
Place of birth for the foreign-born population - Afghanistan (%)
Place of birth for the foreign-born population - Bangladesh (%)
Place of birth for the foreign-born population - India (%)
Place of birth for the foreign-born population - Iran (%)
Place of birth for the foreign-born population - Kazakhstan (%)
Place of birth for the foreign-born population - Nepal (%)
Place of birth for the foreign-born population - Pakistan (%)
Place of birth for the foreign-born population - Sri Lanka (%)
Place of birth for the foreign-born population - Uzbekistan (%)
Place of birth for the foreign-born population - Other South Central Asia (%)
Place of birth for the foreign-born population - Burma (%)
Place of birth for the foreign-born population - Cambodia (%)
Place of birth for the foreign-born population - Indonesia (%)
Place of birth for the foreign-born population - Laos (%)
Place of birth for the foreign-born population - Malaysia (%)
Place of birth for the foreign-born population - Philippines (%)
Place of birth for the foreign-born population - Singapore (%)
Place of birth for the foreign-born population - Thailand (%)
Place of birth for the foreign-born population - Vietnam (%)
Place of birth for the foreign-born population - Other South Eastern Asia (%)
Place of birth for the foreign-born population - Armenia (%)
Place of birth for the foreign-born population - Iraq (%)
Place of birth for the foreign-born population - Israel (%)
Place of birth for the foreign-born population - Jordan (%)
Place of birth for the foreign-born population - Kuwait (%)
Place of birth for the foreign-born population - Lebanon (%)
Place of birth for the foreign-born population - Saudi Arabia (%)
Place of birth for the foreign-born population - Syria (%)
Place of birth for the foreign-born population - Turkey (%)
Place of birth for the foreign-born population - Yemen (%)
Place of birth for the foreign-born population - Other Western Asia (%)
Place of birth for the foreign-born population - Eritrea (%)
Place of birth for the foreign-born population - Ethiopia (%)
Place of birth for the foreign-born population - Kenya (%)
Place of birth for the foreign-born population - Somalia (%)
Place of birth for the foreign-born population - Uganda (%)
Place of birth for the foreign-born population - Zimbabwe (%)
Place of birth for the foreign-born population - Other Eastern Africa (%)
Place of birth for the foreign-born population - Cameroon (%)
Place of birth for the foreign-born population - Congo (%)
Place of birth for the foreign-born population - Democratic Republic of Congo (Zaire) (%)
Place of birth for the foreign-born population - Other Middle Africa (%)
Place of birth for the foreign-born population - Egypt (%)
Place of birth for the foreign-born population - Morocco (%)
Place of birth for the foreign-born population - Sudan (%)
Place of birth for the foreign-born population - Other Northern Africa (%)
Place of birth for the foreign-born population - South Africa (%)
Place of birth for the foreign-born population - Other Southern Africa (%)
Place of birth for the foreign-born population - Cabo Verde (%)
Place of birth for the foreign-born population - Ghana (%)
Place of birth for the foreign-born population - Liberia (%)
Place of birth for the foreign-born population - Nigeria (%)
Place of birth for the foreign-born population - Senegal (%)
Place of birth for the foreign-born population - Sierra Leone (%)
Place of birth for the foreign-born population - Other Western Africa (%)
Place of birth for the foreign-born population - Australia (%)
Place of birth for the foreign-born population - New Zealand (%)
Place of birth for the foreign-born population - Fiji (%)
Place of birth for the foreign-born population - Micronesia (%)
Place of birth for the foreign-born population - Bahamas (%)
Place of birth for the foreign-born population - Barbados (%)
Place of birth for the foreign-born population - Cuba (%)
Place of birth for the foreign-born population - Dominica (%)
Place of birth for the foreign-born population - Dominican Republic (%)
Place of birth for the foreign-born population - Grenada (%)
Place of birth for the foreign-born population - Haiti (%)
Place of birth for the foreign-born population - Jamaica (%)
Place of birth for the foreign-born population - St. Vincent and the Grenadines (%)
Place of birth for the foreign-born population - Trinidad and Tobago (%)
Place of birth for the foreign-born population - West Indies (%)
Place of birth for the foreign-born population - Other Caribbean (%)
Place of birth for the foreign-born population - Belize (%)
Place of birth for the foreign-born population - Costa Rica (%)
Place of birth for the foreign-born population - El Salvador (%)
Place of birth for the foreign-born population - Guatemala (%)
Place of birth for the foreign-born population - Honduras (%)
Place of birth for the foreign-born population - Mexico (%)
Place of birth for the foreign-born population - Nicaragua (%)
Place of birth for the foreign-born population - Panama (%)
Place of birth for the foreign-born population - Other Central America (%)
Place of birth for the foreign-born population - Argentina (%)
Place of birth for the foreign-born population - Bolivia (%)
Place of birth for the foreign-born population - Brazil (%)
Place of birth for the foreign-born population - Chile (%)
Place of birth for the foreign-born population - Colombia (%)
Place of birth for the foreign-born population - Ecuador (%)
Place of birth for the foreign-born population - Guyana (%)
Place of birth for the foreign-born population - Peru (%)
Place of birth for the foreign-born population - Uruguay (%)
Place of birth for the foreign-born population - Venezuela (%)
Place of birth for the foreign-born population - Other South America (%)
Place of birth for the foreign-born population - Canada (%)
Place of birth for the foreign-born population - Other Northern America (%)
Place of birth for the foreign-born population - Other (%)
Latest news about races in Elyria, OH collected exclusively by city-data.com from local newspapers, TV, and radio stations
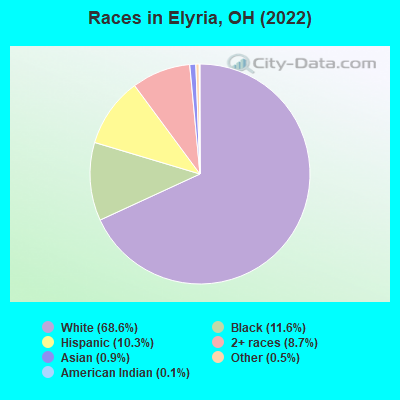
According to 2022 data, the most numerous races in Elyria, OH are White alone (36,556 residents), Black alone (6,197 residents), and Two or more races (4,615 residents). 93.4% of Elyria residents speak English at home. 2.3% of Elyria, OH residents are foreign-born (0.8% born in Latin America, 0.7% born in Asia, 0.5% born in Europe), which is 76.7% less than the foreign-born rate of 4.0% across the entire state of Ohio.
Race distribution in Elyria
2000 2022
9,538,111 84.0% White alone 1,290,662 11.4% Black alone 217,123 1.9% Hispanic 137,770 1.2% Two or more races 131,670 1.2% Asian alone 21,985 0.2% American Indian alone 13,483 0.1% Other race alone 2,336 0.02% Native Hawaiian and Other
8,948,793 76.1% White alone 1,401,403 11.9% Black alone 529,291 4.5% Two or more races 517,232 4.4% Hispanic 293,387 2.5% Asian alone 52,805 0.4% Other race alone 9,785 0.08% American Indian alone 3,362 0.03% Native Hawaiian and Other
Income and house value in Elyria Median household income in 2022 $53,829 White non-Hispanic householders$26,163 Black householders$49,507 American Indian and Alaska Native householders$69,292 Asian householders$33,055 Some other race householders$43,176 Two or more races householders$43,205 Hispanic or Latino race householdersMedian 2022 house value $149,433 White Non-Hispanic householders$132,033 Black or African American householders$145,007 American Indian or Alaska Native householders $116,158 Asian householders$99,215 Some other race householders$117,684 Two or more races householders$122,722 Hispanic or Latino householders
Median age by race in Elyria
44.2 Median age for White residents43.4 44.8 38.6 Median age for Black or African American residents36.5 39.7 54.1 Median age for American Indian / Alaska Native residents59.8 -708,672,086.0 66.2 Median age for Asian residents60.1 80.0 -666,666,666.0 Median age for Native Hawaiian / Pacific Islander residents-666,666,666.0 -666,666,666.0 46.6 Median age for Other race residents44.9 62.2 21.5 Median age for Two or more races residents19.6 24.2 45.1 Median age for White alone residents44.6 45.8 25.1 Median age for Hispanic or Latino residents23.5 25.7
Owner/renter occupied households by race in Elyria
House owners and renters - White residents 11,630 66.8% Owner occupied5,770 33.2% Renter occupiedHouse owners and renters - Black or African American residents 1,029 38.0% Owner occupied1,680 62.0% Renter occupiedHouse owners and renters - American Indian / Alaska Native residents 18 24.5% Owner occupied55 75.5% Renter occupiedHouse owners and renters - Asian residents 184 69.6% Owner occupied80 30.4% Renter occupiedHouse owners and renters - Other race residents 55 13.3% Owner occupied359 86.7% Renter occupiedHouse owners and renters - Two or more races residents 1,104 45.7% Owner occupied1,310 54.3% Renter occupiedHouse owners and renters - White alone residents 11,405 66.3% Owner occupied5,810 33.7% Renter occupiedHouse owners and renters - Hispanic or Latino residents 787 46.3% Owner occupied912 53.7% Renter occupied
Language usage in Elyria
English speakers - Total 93.4% of residents of Elyria speak English at home.
4.6% of residents speak Spanish at home 1,462 62.7% Speak English very well868 37.3% Speak English less than very well1.8% of residents speak other language at home 815 90.1% Speak English very well90 9.9% Speak English less than very well
English speakers - Born in the United States 92.8% of residents of Elyria speak English at home.
6.1% of residents speak Spanish at home 554 96.2% Speak English very well22 3.8% Speak English less than very well1.0% of residents speak other language at home 63 67.7% Speak English very well30 32.3% Speak English less than very well
English speakers - Native, born elsewhere 18.8% of residents of Elyria speak English at home.
78.5% of residents speak Spanish at home 234 36.4% Speak English very well408 63.6% Speak English less than very well3.5% of residents speak other language at home 29 100.0% Speak English very well
English speakers - Foreign-born 13.1% of residents of Elyria speak English at home.
53.0% of residents speak Spanish at home 481 83.4% Speak English very well96 16.6% Speak English less than very well43.8% of residents speak other language at home 401 84.2% Speak English very well75 15.8% Speak English less than very well
White (Caucasian) - Speak only English Native:
98.2% (35,311)Foreign-born:
80.3% (251)
White (Caucasian) - Speak another language Native:
1.8% (646)Foreign-born:
63.4% (199)
Black or African American - Speak only English Native:
97.4% (5,836)Foreign-born:
58.7% (58)
Black or African American - Speak another language Native:
2.6% (157)Foreign-born:
44.4% (44)
Asian - Speak only English Native:
33.4% (40)Foreign-born:
5.9% (20)
Asian - Speak another language Native:
68.4% (83)Foreign-born:
95.5% (328)
Other race - Speak another language Native:
32.8% (166)Foreign-born:
100.0% (82)
Two or more races - Speak only English Native:
84.6% (5,957)Foreign-born:
0.2% (0)
Two or more races - Speak another language Native:
14.3% (1,007)Foreign-born:
100.0% (288)
White alone - Speak only English Native:
98.9% (34,322)Foreign-born:
89.1% (258)
White alone - Speak another language Native:
1.0% (336)Foreign-born:
56.3% (163)
Hispanic or Latino - Speak another language Native:
29.5% (1,333)Foreign-born:
100.0% (495)
Foreign-born residents in Elyria 1,207 residents are foreign born (0.8% Latin America , 0.7% Asia , 0.5% Europe ).
Marital status for residents in Elyria Marital status - White (Caucasian) population 15 years and over
Males 36.6% Never married44.8% Now married0.9% Separated3.8% Widowed13.9% DivorcedFemales 32.8% Never married40.5% Now married1.7% Separated11.0% Widowed14.0% DivorcedWomen who gave birth in the past 12 months Now married:
34.9% (350)Unmarried:
65.1% (653)
Women who did not give birth in the past 12 months Now married:
36.6% (2,888)Unmarried:
63.4% (4,993)
Marital status - Black or African American population 15 years and over
Males 61.0% Never married22.3% Now married1.7% Separated4.4% Widowed10.5% DivorcedFemales 62.0% Never married20.2% Now married3.7% Separated3.9% Widowed10.3% DivorcedWomen who gave birth in the past 12 months Now married:
0.0% (0)Unmarried:
100.0% (55)
Women who did not give birth in the past 12 months Now married:
16.0% (210)Unmarried:
84.0% (1,105)
Marital status - American Indian / Alaska Native population 15 years and over
Males 91.1% Never married8.9% Now married0.0% Separated0.0% Widowed0.0% DivorcedFemales 100.0% Never married0.0% Now married0.0% Separated0.0% Widowed0.0% DivorcedWomen who did not give birth in the past 12 months Now married:
0.0% (0)Unmarried:
100.0% (51)
Marital status - Asian population 15 years and over
Males 22.7% Never married44.3% Now married0.0% Separated15.5% Widowed17.5% DivorcedFemales 24.0% Never married31.3% Now married3.2% Separated14.3% Widowed27.2% DivorcedWomen who did not give birth in the past 12 months Now married:
37.0% (34)Unmarried:
63.0% (58)
Marital status - Other race population 15 years and over
Males 54.9% Never married20.1% Now married2.8% Separated0.0% Widowed22.2% DivorcedFemales 31.0% Never married26.9% Now married0.0% Separated20.3% Widowed21.8% DivorcedWomen who did not give birth in the past 12 months Now married:
17.6% (17)Unmarried:
82.4% (81)
Marital status - Two or more races population 15 years and over
Males 67.0% Never married22.6% Now married0.3% Separated1.7% Widowed8.4% DivorcedFemales 46.0% Never married30.9% Now married8.0% Separated6.7% Widowed8.4% DivorcedWomen who gave birth in the past 12 months Now married:
55.3% (90)Unmarried:
44.7% (73)
Women who did not give birth in the past 12 months Now married:
35.0% (770)Unmarried:
65.0% (1,430)
Marital status - White alone, not Hispanic / Latino population 15 years and over
Males 35.7% Never married45.5% Now married1.0% Separated4.0% Widowed13.8% DivorcedFemales 31.0% Never married41.4% Now married1.7% Separated11.4% Widowed14.4% DivorcedWomen who gave birth in the past 12 months Now married:
41.1% (337)Unmarried:
58.9% (484)
Women who did not give birth in the past 12 months Now married:
37.5% (2,900)Unmarried:
62.5% (4,832)
Marital status - Hispanic or Latino population 15 years and over
Males 58.0% Never married25.6% Now married0.8% Separated0.0% Widowed15.6% DivorcedFemales 61.7% Never married20.3% Now married8.2% Separated3.4% Widowed6.5% DivorcedWomen who gave birth in the past 12 months Now married:
10.1% (28)Unmarried:
89.9% (248)
Women who did not give birth in the past 12 months Now married:
25.6% (285)Unmarried:
74.4% (827)
Ancestries in Elyria
4,218 18.3% American2,554 11.1% German1,740 7.6% English1,199 5.2% Irish977 4.2% Italian911 4.0% Polish421 1.8% Hungarian277 1.2% Scottish231 1.0% African230 1.0% European170 0.7% Slovak105 0.5% Eastern European93 0.4% French Canadian82 0.4% Russian81 0.4% Dutch65 0.3% Scotch-Irish52 0.2% Croatian45 0.2% Bulgarian42 0.2% Czechoslovakian40 0.2% British40 0.2% Cypriot40 0.2% Czech39 0.2% Pennsylvania German39 0.2% Romanian36 0.2% Slavic35 0.2% Greek29 0.1% Swiss27 0.1% French26 0.1% Slovene23 0.10% Ukrainian21 0.09% Portuguese19 0.08% Macedonian15 0.07% Finnish15 0.07% Welsh11 0.05% Danish9 0.04% Austrian8 0.03% Northern European8 0.03% Norwegian6 0.03% Jamaican5 0.02% Jordanian
Geographical mobility in Elyria Same house 1 year ago 33,476 89.3% White (Caucasian)5,300 83.1% Black or African American110 98.2% American Indian / Alaska Native357 83.4% Asian555 73.8% Other race6,784 83.9% Two or more races32,511 90.0% White alone, not Hispanic / Latino4,224 79.7% Hispanic or LatinoMoved within same county 1,715 4.6% White / Caucasian464 7.3% Black or African American5 4.4% American Indian / Alaska Native58 13.5% Asian64 8.6% Other race1,095 13.6% Two or more races1,713 4.7% White alone, not Hispanic / Latino592 11.2% Hispanic or LatinoMoved within same state 910 2.4% White / Caucasian284 4.5% Black or African American42 5.6% Other race69 0.9% Two or more races734 2.0% White alone, not Hispanic / Latino289 5.5% Hispanic or LatinoMoved from different state 488 1.3% White / Caucasian62 1.0% Black or African American10 2.3% Asian204 2.5% Two or more races378 1.0% White alone, not Hispanic / Latino174 3.3% Hispanic or LatinoMoved from abroad 44 0.1% White36 0.6% Black or African American149 19.8% Other race15 0.0% White alone, not Hispanic / Latino97 1.8% Hispanic or Latino
Children Nativity (place of birth) in Elyria
Children under 6 years - Living with two parents Both parents native 1,517 100.0% NativeBoth parents foreign-born 12 100.0% NativeOne native, one foreign-born parent 70 100.0% NativeChildren under 6 years - Living with one parent Native parent 1,937 100.0% NativeForeign-born parent 33 100.0% NativeChildren 6 to 17 years - Living with two parents Both parents native 2,678 100.0% NativeBoth parents foreign-born 37 100.0% NativeOne native, one foreign-born parent 136 92.3% Native11 7.7% Foreign-bornChildren 6 to 17 years - Living with one parent Native parent 3,657 100.0% NativeForeign-born parent 101 53.6% Native87 46.4% Foreign-born
Grandparents responsible for own grandchildren in Elyria
Grandparents (30 to 59 years) White / Caucasian 205 83.7% Responsible for grandchildren40 16.3% Not responsible for grandchildrenBlack or African American 33 43.3% Responsible for grandchildren43 56.7% Not responsible for grandchildrenTwo or more races 106 100.0% Not responsible for grandchildrenWhite alone, not Hispanic / Latino 214 83.3% Responsible for grandchildren43 16.7% Not responsible for grandchildrenHispanic or Latino 83 100.0% Not responsible for grandchildrenGrandparents (60 years and over) White / Caucasian 54 26.8% Responsible for grandchildren149 73.2% Not responsible for grandchildrenBlack or African American 25 18.9% Responsible for grandchildren107 81.1% Not responsible for grandchildrenTwo or more races 126 95.8% Responsible for grandchildren6 4.2% Not responsible for grandchildrenWhite alone, not Hispanic / Latino 52 25.9% Responsible for grandchildren150 74.1% Not responsible for grandchildrenHispanic or Latino 56 85.2% Responsible for grandchildren10 14.8% Not responsible for grandchildren