Races in Elizabethtown, Kentucky (KY) Detailed Stats
Data:
Races - White alone (%)
Races - White alone (% change since 2000)
Races - Black alone (%)
Races - Black alone (% change since 2000)
Races - American Indian alone (%)
Races - American Indian alone (% change since 2000)
Races - Asian alone (%)
Races - Asian alone (% change since 2000)
Races - Hispanic (%)
Races - Hispanic (% change since 2000)
Races - Native Hawaiian and Other Pacific Islander alone (%)
Races - Native Hawaiian and Other Pacific Islander alone (% change since 2000)
Races - Two or more races(%)
Races - Two or more races(% change since 2000)
Races - Other race alone (%)
Races - Other race alone (% change since 2000)
Racial diversity
Place of birth - Born in state of residence (%)
Place of birth - Born in state of residence (%) - White
Place of birth - Born in state of residence (%) - Black or African American
Place of birth - Born in state of residence (%) - Asian
Place of birth - Born in state of residence (%) - Hispanic or Latino
Place of birth - Born in state of residence (%) - American Indian and Alaska Native
Place of birth - Born in state of residence (%) - Multirace
Place of birth - Born in state of residence (%) - Other Race
Place of birth - Born in other state (%)
Place of birth - Born in other state (%) - White
Place of birth - Born in other state (%) - Black or African American
Place of birth - Born in other state (%) - Asian
Place of birth - Born in other state (%) - Hispanic or Latino
Place of birth - Born in other state (%) - American Indian and Alaska Native
Place of birth - Born in other state (%) - Multirace
Place of birth - Born in other state (%) - Other Race
Place of birth - Native, outside of US (%)
Place of birth - Native, outside of US (%) - White
Place of birth - Native, outside of US (%) - Black or African American
Place of birth - Native, outside of US (%) - Asian
Place of birth - Native, outside of US (%) - Hispanic or Latino
Place of birth - Native, outside of US (%) - American Indian and Alaska Native
Place of birth - Native, outside of US (%) - Multirace
Place of birth - Native, outside of US (%) - Other Race
Place of birth - Foreign born (%)
Place of birth - Foreign born (%) - White
Place of birth - Foreign born (%) - Black or African American
Place of birth - Foreign born (%) - Asian
Place of birth - Foreign born (%) - Hispanic or Latino
Place of birth - Foreign born (%) - American Indian and Alaska Native
Place of birth - Foreign born (%) - Multirace
Place of birth - Foreign born (%) - Other Race
Residents speaking English at home (%)
Residents speaking English at home - Born in the United States (%)
Residents speaking English at home - Native, born elsewhere (%)
Residents speaking English at home - Foreign born (%)
Residents speaking Spanish at home (%)
Residents speaking Spanish at home - Born in the United States (%)
Residents speaking Spanish at home - Native, born elsewhere (%)
Residents speaking Spanish at home - Foreign born (%)
Residents speaking other language at home (%)
Residents speaking other language at home - Born in the United States (%)
Residents speaking other language at home - Native, born elsewhere (%)
Residents speaking other language at home - Foreign born (%)
Marital status - Never married (%)
Marital status - Now married (%)
Marital status - Separated (%)
Marital status - Widowed (%)
Marital status - Divorced (%)
Ancestries Reported - Arab (%)
Ancestries Reported - Czech (%)
Ancestries Reported - Danish (%)
Ancestries Reported - Dutch (%)
Ancestries Reported - English (%)
Ancestries Reported - French (%)
Ancestries Reported - French Canadian (%)
Ancestries Reported - German (%)
Ancestries Reported - Greek (%)
Ancestries Reported - Hungarian (%)
Ancestries Reported - Irish (%)
Ancestries Reported - Italian (%)
Ancestries Reported - Lithuanian (%)
Ancestries Reported - Norwegian (%)
Ancestries Reported - Polish (%)
Ancestries Reported - Portuguese (%)
Ancestries Reported - Russian (%)
Ancestries Reported - Scotch-Irish (%)
Ancestries Reported - Scottish (%)
Ancestries Reported - Slovak (%)
Ancestries Reported - Subsaharan African (%)
Ancestries Reported - Swedish (%)
Ancestries Reported - Swiss (%)
Ancestries Reported - Ukrainian (%)
Ancestries Reported - United States (%)
Ancestries Reported - Welsh (%)
Ancestries Reported - West Indian (%)
Ancestries Reported - Other (%)
Geographical mobility - Same house 1 year ago (%)
Geographical mobility - Same house 1 year ago (%) - White
Geographical mobility - Same house 1 year ago (%) - Black or African American
Geographical mobility - Same house 1 year ago (%) - Asian
Geographical mobility - Same house 1 year ago (%) - Hispanic or Latino
Geographical mobility - Same house 1 year ago (%) - American Indian and Alaska Native
Geographical mobility - Same house 1 year ago (%) - Multirace
Geographical mobility - Same house 1 year ago (%) - Other Race
Geographical mobility - Moved within same county (%)
Geographical mobility - Moved within same county (%) - White
Geographical mobility - Moved within same county (%) - Black or African American
Geographical mobility - Moved within same county (%) - Asian
Geographical mobility - Moved within same county (%) - Hispanic or Latino
Geographical mobility - Moved within same county (%) - American Indian and Alaska Native
Geographical mobility - Moved within same county (%) - Multirace
Geographical mobility - Moved within same county (%) - Other Race
Geographical mobility - Moved from different county within same state (%)
Geographical mobility - Moved from different county within same state (%) - White
Geographical mobility - Moved from different county within same state (%) - Black or African American
Geographical mobility - Moved from different county within same state (%) - Asian
Geographical mobility - Moved from different county within same state (%) - Hispanic or Latino
Geographical mobility - Moved from different county within same state (%) - American Indian and Alaska Native
Geographical mobility - Moved from different county within same state (%) - Multirace
Geographical mobility - Moved from different county within same state (%) - Other Race
Geographical mobility - Moved from different state (%)
Geographical mobility - Moved from different state (%) - White
Geographical mobility - Moved from different state (%) - Black or African American
Geographical mobility - Moved from different state (%) - Asian
Geographical mobility - Moved from different state (%) - Hispanic or Latino
Geographical mobility - Moved from different state (%) - American Indian and Alaska Native
Geographical mobility - Moved from different state (%) - Multirace
Geographical mobility - Moved from different state (%) - Other Race
Geographical mobility - Moved from abroad (%)
Geographical mobility - Moved from abroad (%) - White
Geographical mobility - Moved from abroad (%) - Black or African American
Geographical mobility - Moved from abroad (%) - Asian
Geographical mobility - Moved from abroad (%) - Hispanic or Latino
Geographical mobility - Moved from abroad (%) - American Indian and Alaska Native
Geographical mobility - Moved from abroad (%) - Multirace
Geographical mobility - Moved from abroad (%) - Other Race
Place of birth for the foreign-born population - Ireland (%)
Place of birth for the foreign-born population - Denmark (%)
Place of birth for the foreign-born population - Norway (%)
Place of birth for the foreign-born population - Sweden (%)
Place of birth for the foreign-born population - United Kingdom (%)
Place of birth for the foreign-born population - England (%)
Place of birth for the foreign-born population - Scotland (%)
Place of birth for the foreign-born population - Other Northern Europe (%)
Place of birth for the foreign-born population - Austria (%)
Place of birth for the foreign-born population - Belgium (%)
Place of birth for the foreign-born population - France (%)
Place of birth for the foreign-born population - Germany (%)
Place of birth for the foreign-born population - Netherlands (%)
Place of birth for the foreign-born population - Switzerland (%)
Place of birth for the foreign-born population - Other Western Europe (%)
Place of birth for the foreign-born population - Greece (%)
Place of birth for the foreign-born population - Italy (%)
Place of birth for the foreign-born population - Portugal (%)
Place of birth for the foreign-born population - Spain (%)
Place of birth for the foreign-born population - Other Southern Europe (%)
Place of birth for the foreign-born population - Albania (%)
Place of birth for the foreign-born population - Belarus (%)
Place of birth for the foreign-born population - Bosnia and Herzegovina (%)
Place of birth for the foreign-born population - Bulgaria (%)
Place of birth for the foreign-born population - Croatia (%)
Place of birth for the foreign-born population - Czechoslovakia (%)
Place of birth for the foreign-born population - Hungary (%)
Place of birth for the foreign-born population - Latvia (%)
Place of birth for the foreign-born population - Lithuania (%)
Place of birth for the foreign-born population - North Macedonia (Macedonia) (%)
Place of birth for the foreign-born population - Moldova (%)
Place of birth for the foreign-born population - Poland (%)
Place of birth for the foreign-born population - Romania (%)
Place of birth for the foreign-born population - Russia (%)
Place of birth for the foreign-born population - Serbia (%)
Place of birth for the foreign-born population - Ukraine (%)
Place of birth for the foreign-born population - Other Eastern Europe (%)
Place of birth for the foreign-born population - China (%)
Place of birth for the foreign-born population - Hong Kong (%)
Place of birth for the foreign-born population - Taiwan (%)
Place of birth for the foreign-born population - Japan (%)
Place of birth for the foreign-born population - Korea (%)
Place of birth for the foreign-born population - Other Eastern Asia (%)
Place of birth for the foreign-born population - Afghanistan (%)
Place of birth for the foreign-born population - Bangladesh (%)
Place of birth for the foreign-born population - India (%)
Place of birth for the foreign-born population - Iran (%)
Place of birth for the foreign-born population - Kazakhstan (%)
Place of birth for the foreign-born population - Nepal (%)
Place of birth for the foreign-born population - Pakistan (%)
Place of birth for the foreign-born population - Sri Lanka (%)
Place of birth for the foreign-born population - Uzbekistan (%)
Place of birth for the foreign-born population - Other South Central Asia (%)
Place of birth for the foreign-born population - Burma (%)
Place of birth for the foreign-born population - Cambodia (%)
Place of birth for the foreign-born population - Indonesia (%)
Place of birth for the foreign-born population - Laos (%)
Place of birth for the foreign-born population - Malaysia (%)
Place of birth for the foreign-born population - Philippines (%)
Place of birth for the foreign-born population - Singapore (%)
Place of birth for the foreign-born population - Thailand (%)
Place of birth for the foreign-born population - Vietnam (%)
Place of birth for the foreign-born population - Other South Eastern Asia (%)
Place of birth for the foreign-born population - Armenia (%)
Place of birth for the foreign-born population - Iraq (%)
Place of birth for the foreign-born population - Israel (%)
Place of birth for the foreign-born population - Jordan (%)
Place of birth for the foreign-born population - Kuwait (%)
Place of birth for the foreign-born population - Lebanon (%)
Place of birth for the foreign-born population - Saudi Arabia (%)
Place of birth for the foreign-born population - Syria (%)
Place of birth for the foreign-born population - Turkey (%)
Place of birth for the foreign-born population - Yemen (%)
Place of birth for the foreign-born population - Other Western Asia (%)
Place of birth for the foreign-born population - Eritrea (%)
Place of birth for the foreign-born population - Ethiopia (%)
Place of birth for the foreign-born population - Kenya (%)
Place of birth for the foreign-born population - Somalia (%)
Place of birth for the foreign-born population - Uganda (%)
Place of birth for the foreign-born population - Zimbabwe (%)
Place of birth for the foreign-born population - Other Eastern Africa (%)
Place of birth for the foreign-born population - Cameroon (%)
Place of birth for the foreign-born population - Congo (%)
Place of birth for the foreign-born population - Democratic Republic of Congo (Zaire) (%)
Place of birth for the foreign-born population - Other Middle Africa (%)
Place of birth for the foreign-born population - Egypt (%)
Place of birth for the foreign-born population - Morocco (%)
Place of birth for the foreign-born population - Sudan (%)
Place of birth for the foreign-born population - Other Northern Africa (%)
Place of birth for the foreign-born population - South Africa (%)
Place of birth for the foreign-born population - Other Southern Africa (%)
Place of birth for the foreign-born population - Cabo Verde (%)
Place of birth for the foreign-born population - Ghana (%)
Place of birth for the foreign-born population - Liberia (%)
Place of birth for the foreign-born population - Nigeria (%)
Place of birth for the foreign-born population - Senegal (%)
Place of birth for the foreign-born population - Sierra Leone (%)
Place of birth for the foreign-born population - Other Western Africa (%)
Place of birth for the foreign-born population - Australia (%)
Place of birth for the foreign-born population - New Zealand (%)
Place of birth for the foreign-born population - Fiji (%)
Place of birth for the foreign-born population - Micronesia (%)
Place of birth for the foreign-born population - Bahamas (%)
Place of birth for the foreign-born population - Barbados (%)
Place of birth for the foreign-born population - Cuba (%)
Place of birth for the foreign-born population - Dominica (%)
Place of birth for the foreign-born population - Dominican Republic (%)
Place of birth for the foreign-born population - Grenada (%)
Place of birth for the foreign-born population - Haiti (%)
Place of birth for the foreign-born population - Jamaica (%)
Place of birth for the foreign-born population - St. Vincent and the Grenadines (%)
Place of birth for the foreign-born population - Trinidad and Tobago (%)
Place of birth for the foreign-born population - West Indies (%)
Place of birth for the foreign-born population - Other Caribbean (%)
Place of birth for the foreign-born population - Belize (%)
Place of birth for the foreign-born population - Costa Rica (%)
Place of birth for the foreign-born population - El Salvador (%)
Place of birth for the foreign-born population - Guatemala (%)
Place of birth for the foreign-born population - Honduras (%)
Place of birth for the foreign-born population - Mexico (%)
Place of birth for the foreign-born population - Nicaragua (%)
Place of birth for the foreign-born population - Panama (%)
Place of birth for the foreign-born population - Other Central America (%)
Place of birth for the foreign-born population - Argentina (%)
Place of birth for the foreign-born population - Bolivia (%)
Place of birth for the foreign-born population - Brazil (%)
Place of birth for the foreign-born population - Chile (%)
Place of birth for the foreign-born population - Colombia (%)
Place of birth for the foreign-born population - Ecuador (%)
Place of birth for the foreign-born population - Guyana (%)
Place of birth for the foreign-born population - Peru (%)
Place of birth for the foreign-born population - Uruguay (%)
Place of birth for the foreign-born population - Venezuela (%)
Place of birth for the foreign-born population - Other South America (%)
Place of birth for the foreign-born population - Canada (%)
Place of birth for the foreign-born population - Other Northern America (%)
Place of birth for the foreign-born population - Other (%)
Latest news about races in Elizabethtown, KY collected exclusively by city-data.com from local newspapers, TV, and radio stations
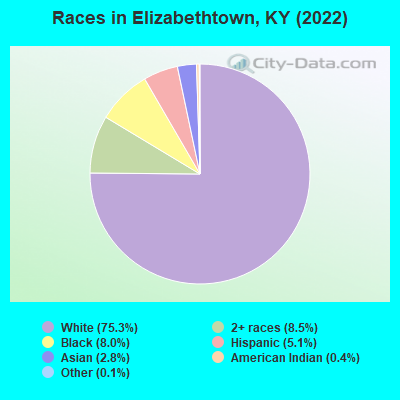
According to 2022 data, the most numerous races in Elizabethtown, KY are White alone (23,857 residents), Black alone (2,532 residents), and Hispanic (1,602 residents). 93.0% of Elizabethtown residents speak English at home. 4.7% of Elizabethtown, KY residents are foreign-born (2.1% born in Asia, 1.1% born in Europe, 1.0% born in Latin America), which is 14.5% greater than the foreign-born rate of 4.0% across the entire state of Kentucky.
Race distribution in Elizabethtown
2000 2022
3,608,013 89.3% White alone 293,639 7.3% Black alone 59,939 1.5% Hispanic 37,750 0.9% Two or more races 29,368 0.7% Asian alone 7,939 0.2% American Indian alone 3,846 0.10% Other race alone 1,275 0.03% Native Hawaiian and Other
3,710,998 82.2% White alone 343,194 7.6% Black alone 187,483 4.2% Hispanic 187,394 4.2% Two or more races 62,240 1.4% Asian alone 13,529 0.3% Other race alone 4,302 0.10% American Indian alone 3,170 0.07% Native Hawaiian and Other
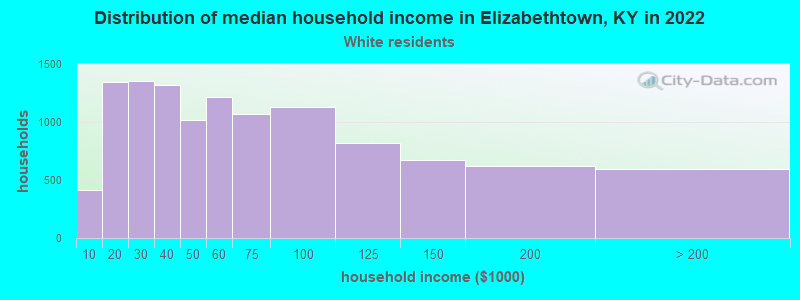
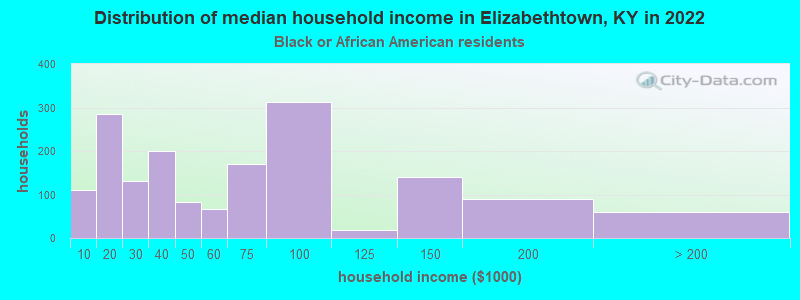
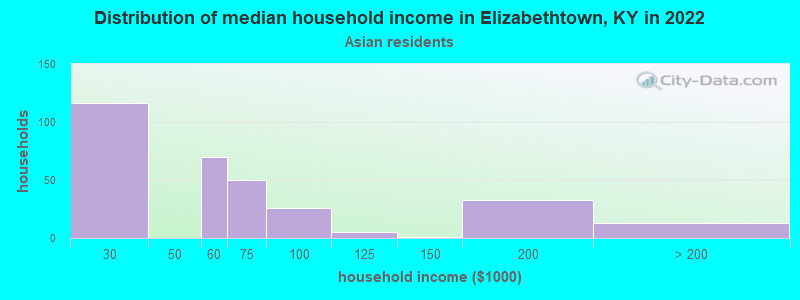
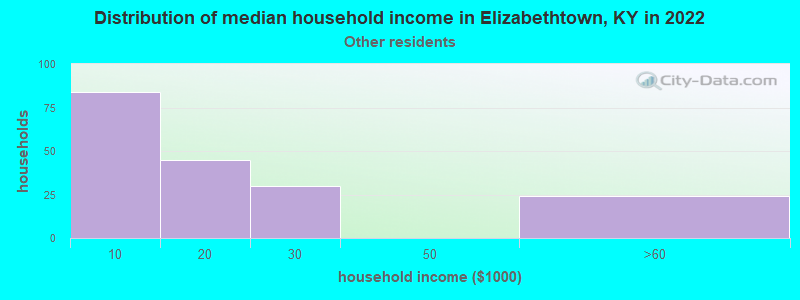
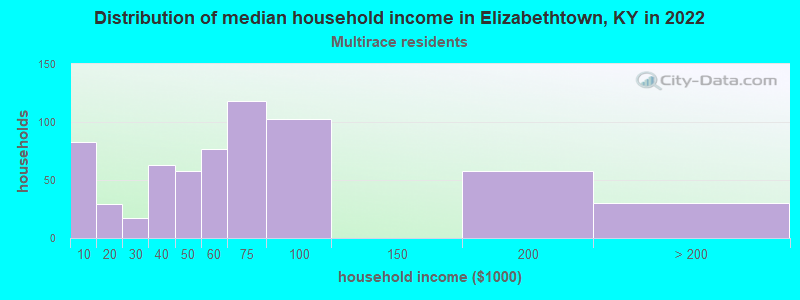
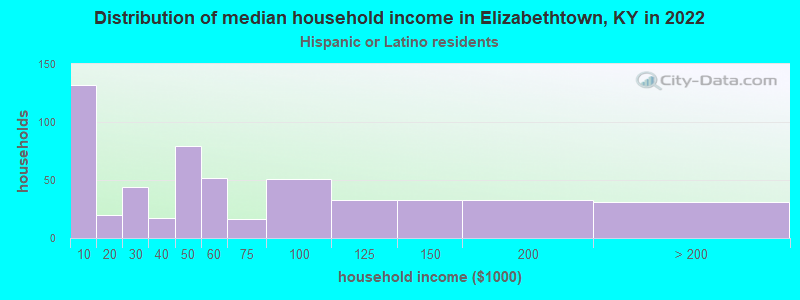
Income and house value in Elizabethtown Median household income in 2022 $51,562 White non-Hispanic householders$56,649 Black householders$43,139 Asian householders$72,724 Two or more races householders$34,935 Hispanic or Latino race householdersMedian 2022 house value $236,123 White Non-Hispanic householders$193,344 Black or African American householders$155,344 American Indian or Alaska Native householders $305,192 Asian householders$328,613 Some other race householders$283,921 Two or more races householders$177,809 Hispanic or Latino householders
Median age by race in Elizabethtown
39.1 Median age for White residents38.2 39.4 42.4 Median age for Black or African American residents45.7 47.0 40.5 Median age for American Indian / Alaska Native residents-607,449,856.1 49.1 37.9 Median age for Asian residents18.1 59.2 -295,081,966.9 Median age for Native Hawaiian / Pacific Islander residents-304,444,444.1 -853,801,168.7 26.2 Median age for Other race residents47.5 17.5 29.4 Median age for Two or more races residents35.7 19.4 38.8 Median age for White alone residents38.4 39.0 32.0 Median age for Hispanic or Latino residents38.0 13.2
Owner/renter occupied households by race in Elizabethtown
House owners and renters - White residents 6,062 53.7% Owner occupied5,218 46.3% Renter occupiedHouse owners and renters - Black or African American residents 604 42.5% Owner occupied818 57.5% Renter occupiedHouse owners and renters - American Indian / Alaska Native residents 23 100.0% Renter occupiedHouse owners and renters - Asian residents 93 35.1% Owner occupied172 64.9% Renter occupiedHouse owners and renters - Native Hawaiian / Pacific Islander residents 13 100.0% Owner occupiedHouse owners and renters - Other race residents 202 100.0% Renter occupiedHouse owners and renters - Two or more races residents 230 40.5% Owner occupied338 59.5% Renter occupiedHouse owners and renters - White alone residents 5,938 54.0% Owner occupied5,065 46.0% Renter occupiedHouse owners and renters - Hispanic or Latino residents 205 37.9% Owner occupied336 62.1% Renter occupied
Language usage in Elizabethtown
English speakers - Total 93.0% of residents of Elizabethtown speak English at home.
2.4% of residents speak Spanish at home 393 55.1% Speak English very well320 44.9% Speak English less than very well4.9% of residents speak other language at home 926 62.5% Speak English very well555 37.5% Speak English less than very well
English speakers - Born in the United States 95.9% of residents of Elizabethtown speak English at home.
3.3% of residents speak Spanish at home 186 51.4% Speak English very well176 48.6% Speak English less than very well1.5% of residents speak other language at home 169 100.0% Speak English very well
English speakers - Native, born elsewhere 74.7% of residents of Elizabethtown speak English at home.
16.1% of residents speak Spanish at home 98 61.6% Speak English very well61 38.4% Speak English less than very well8.1% of residents speak other language at home 69 86.2% Speak English very well11 13.8% Speak English less than very well
English speakers - Foreign-born 17.7% of residents of Elizabethtown speak English at home.
19.8% of residents speak Spanish at home 117 41.2% Speak English very well167 58.8% Speak English less than very well76.6% of residents speak other language at home 554 50.5% Speak English very well543 49.5% Speak English less than very well
White (Caucasian) - Speak only English Native:
98.6% (22,133)Foreign-born:
36.8% (169)
White (Caucasian) - Speak another language Native:
1.5% (339)Foreign-born:
62.5% (287)
Black or African American - Speak another language Native:
0.7% (23)Foreign-born:
97.0% (125)
Asian - Speak only English Native:
57.6% (132)Foreign-born:
10.0% (54)
Asian - Speak another language Native:
42.0% (96)Foreign-born:
90.3% (488)
Native Hawaiian / Pacific Islander - Speak only English Native:
99.5% (12)Foreign-born:
96.3% (34)
Other race - Speak another language Native:
74.6% (354)Foreign-born:
98.6% (105)
Two or more races - Speak only English Native:
100.0% (2,381)Foreign-born:
4.7% (11)
Two or more races - Speak another language Native:
2.1% (50)Foreign-born:
94.6% (224)
White alone - Speak only English Native:
99.5% (21,985)Foreign-born:
44.0% (169)
White alone - Speak another language Native:
0.7% (156)Foreign-born:
56.1% (215)
Hispanic or Latino - Speak only English Native:
64.9% (873)Foreign-born:
2.6% (8)
Hispanic or Latino - Speak another language Native:
34.4% (464)Foreign-born:
96.8% (303)
Foreign-born residents in Elizabethtown 1,481 residents are foreign born (2.1% Asia , 1.1% Europe , 1.0% Latin America ).
This city:
4.7%Kentucky:
4.1%
Marital status for residents in Elizabethtown Marital status - White (Caucasian) population 15 years and over
Males 32.4% Never married46.8% Now married1.5% Separated4.9% Widowed14.3% DivorcedFemales 25.3% Never married41.6% Now married2.0% Separated16.0% Widowed15.0% DivorcedWomen who gave birth in the past 12 months Now married:
36.2% (92)Unmarried:
63.8% (162)
Women who did not give birth in the past 12 months Now married:
45.1% (2,400)Unmarried:
54.9% (2,926)
Marital status - Black or African American population 15 years and over
Males 43.3% Never married42.2% Now married1.6% Separated3.6% Widowed9.3% DivorcedFemales 51.6% Never married17.2% Now married0.2% Separated3.3% Widowed27.7% DivorcedWomen who gave birth in the past 12 months Now married:
95.8% (46)Unmarried:
4.2% (2)
Women who did not give birth in the past 12 months Now married:
2.5% (26)Unmarried:
97.5% (1,021)
Marital status - American Indian / Alaska Native population 15 years and over
Males 57.1% Never married0.0% Now married42.9% Separated0.0% Widowed0.0% DivorcedFemales 0.0% Never married67.9% Now married0.0% Separated0.0% Widowed32.1% DivorcedWomen who did not give birth in the past 12 months Now married:
100.0% (12)Unmarried:
0.0% (0)
Marital status - Asian population 15 years and over
Males 38.2% Never married56.8% Now married4.9% Separated0.0% Widowed0.0% DivorcedFemales 19.5% Never married64.9% Now married0.0% Separated14.1% Widowed1.6% DivorcedWomen who gave birth in the past 12 months Now married:
100.0% (20)Unmarried:
0.0% (0)
Women who did not give birth in the past 12 months Now married:
69.5% (190)Unmarried:
30.5% (83)
Marital status - Native Hawaiian / Pacific Islander population 15 years and over
Males 0.0% Never married100.0% Now married0.0% Separated0.0% Widowed0.0% DivorcedFemales 0.0% Never married100.0% Now married0.0% Separated0.0% Widowed0.0% DivorcedWomen who did not give birth in the past 12 months Now married:
100.0% (36)Unmarried:
0.0% (0)
Marital status - Other race population 15 years and over
Males 38.5% Never married60.4% Now married0.0% Separated0.0% Widowed1.1% DivorcedFemales 52.4% Never married39.5% Now married8.1% Separated0.0% Widowed0.0% DivorcedWomen who did not give birth in the past 12 months Now married:
43.0% (109)Unmarried:
57.0% (145)
Marital status - Two or more races population 15 years and over
Males 39.9% Never married49.5% Now married8.1% Separated0.0% Widowed2.6% DivorcedFemales 67.5% Never married17.2% Now married1.0% Separated8.8% Widowed5.6% DivorcedWomen who did not give birth in the past 12 months Now married:
14.9% (112)Unmarried:
85.1% (639)
Marital status - White alone, not Hispanic / Latino population 15 years and over
Males 32.2% Never married47.2% Now married1.6% Separated5.1% Widowed14.0% DivorcedFemales 25.4% Never married41.7% Now married1.6% Separated16.3% Widowed15.0% DivorcedWomen who gave birth in the past 12 months Now married:
36.2% (92)Unmarried:
63.8% (163)
Women who did not give birth in the past 12 months Now married:
45.2% (2,390)Unmarried:
54.8% (2,899)
Marital status - Hispanic or Latino population 15 years and over
Males 35.1% Never married53.8% Now married0.0% Separated0.0% Widowed11.1% DivorcedFemales 36.9% Never married37.6% Now married15.6% Separated0.0% Widowed10.0% DivorcedWomen who gave birth in the past 12 months Now married:
0.0% (0)Unmarried:
100.0% (2)
Women who did not give birth in the past 12 months Now married:
43.8% (139)Unmarried:
56.2% (178)
Ancestries in Elizabethtown
2,219 15.3% American1,876 12.9% German1,830 12.6% English1,577 10.9% Irish576 4.0% European363 2.5% West Indian220 1.5% Polish217 1.5% Scottish185 1.3% Italian175 1.2% Romanian149 1.0% Scotch-Irish145 1.0% Nigerian128 0.9% African89 0.6% Russian52 0.4% Canadian39 0.3% Norwegian35 0.2% Dutch35 0.2% French34 0.2% Welsh32 0.2% British32 0.2% Swedish28 0.2% Ukrainian25 0.2% Lebanese21 0.1% Serbian21 0.1% Yugoslavian20 0.1% Haitian17 0.1% Somali14 0.10% Czech12 0.08% Armenian10 0.07% Slavic7 0.05% French Canadian
Geographical mobility in Elizabethtown Same house 1 year ago 20,313 84.3% White (Caucasian)2,571 91.9% Black or African American36 51.9% American Indian / Alaska Native535 66.6% Asian48 100.0% Native Hawaiian / Pacific Islander305 47.7% Other race2,019 66.3% Two or more races19,816 83.8% White alone, not Hispanic / Latino1,014 64.7% Hispanic or LatinoMoved within same county 1,252 5.2% White / Caucasian242 8.6% Black or African American44 63.4% American Indian / Alaska Native174 21.6% Asian28 4.4% Other race143 4.7% Two or more races1,280 5.4% White alone, not Hispanic / Latino35 2.2% Hispanic or LatinoMoved within same state 1,445 6.0% White / Caucasian181 6.5% Black or African American80 9.9% Asian437 14.4% Two or more races1,495 6.3% White alone, not Hispanic / Latino250 16.0% Hispanic or LatinoMoved from different state 603 2.5% White / Caucasian68 2.4% Black or African American20 2.5% Asian316 49.4% Other race3 0.1% Two or more races618 2.6% White alone, not Hispanic / Latino300 19.2% Hispanic or LatinoMoved from abroad 131 0.5% White83 3.0% Black or African American62 2.0% Two or more races118 0.5% White alone, not Hispanic / Latino
Children Nativity (place of birth) in Elizabethtown
Children under 6 years - Living with two parents Both parents native 1,108 100.0% NativeBoth parents foreign-born 34 100.0% NativeOne native, one foreign-born parent 97 100.0% NativeChildren under 6 years - Living with one parent Native parent 830 100.0% NativeForeign-born parent 10 91.3% Native1 8.7% Foreign-bornChildren 6 to 17 years - Living with two parents Both parents native 2,662 100.0% Native0 0.0% Foreign-bornBoth parents foreign-born 41 30.4% Native94 69.6% Foreign-bornOne native, one foreign-born parent 258 100.0% NativeChildren 6 to 17 years - Living with one parent Native parent 1,820 100.0% NativeForeign-born parent 106 49.5% Native107 50.5% Foreign-born
Grandparents responsible for own grandchildren in Elizabethtown
Grandparents (30 to 59 years) White / Caucasian 48 41.0% Responsible for grandchildren70 59.0% Not responsible for grandchildrenBlack or African American 65 92.4% Responsible for grandchildren5 7.6% Not responsible for grandchildrenWhite alone, not Hispanic / Latino 49 40.6% Responsible for grandchildren71 59.4% Not responsible for grandchildrenGrandparents (60 years and over) White / Caucasian 40 32.8% Responsible for grandchildren83 67.2% Not responsible for grandchildrenBlack or African American 97 100.0% Responsible for grandchildrenWhite alone, not Hispanic / Latino 40 32.6% Responsible for grandchildren84 67.4% Not responsible for grandchildren