Races in East Massapequa, New York (NY) Detailed Stats
Data:
Races - White alone (%)
Races - White alone (% change since 2000)
Races - Black alone (%)
Races - Black alone (% change since 2000)
Races - American Indian alone (%)
Races - American Indian alone (% change since 2000)
Races - Asian alone (%)
Races - Asian alone (% change since 2000)
Races - Hispanic (%)
Races - Hispanic (% change since 2000)
Races - Native Hawaiian and Other Pacific Islander alone (%)
Races - Native Hawaiian and Other Pacific Islander alone (% change since 2000)
Races - Two or more races(%)
Races - Two or more races(% change since 2000)
Races - Other race alone (%)
Races - Other race alone (% change since 2000)
Racial diversity
Place of birth - Born in state of residence (%)
Place of birth - Born in state of residence (%) - White
Place of birth - Born in state of residence (%) - Black or African American
Place of birth - Born in state of residence (%) - Asian
Place of birth - Born in state of residence (%) - Hispanic or Latino
Place of birth - Born in state of residence (%) - American Indian and Alaska Native
Place of birth - Born in state of residence (%) - Multirace
Place of birth - Born in state of residence (%) - Other Race
Place of birth - Born in other state (%)
Place of birth - Born in other state (%) - White
Place of birth - Born in other state (%) - Black or African American
Place of birth - Born in other state (%) - Asian
Place of birth - Born in other state (%) - Hispanic or Latino
Place of birth - Born in other state (%) - American Indian and Alaska Native
Place of birth - Born in other state (%) - Multirace
Place of birth - Born in other state (%) - Other Race
Place of birth - Native, outside of US (%)
Place of birth - Native, outside of US (%) - White
Place of birth - Native, outside of US (%) - Black or African American
Place of birth - Native, outside of US (%) - Asian
Place of birth - Native, outside of US (%) - Hispanic or Latino
Place of birth - Native, outside of US (%) - American Indian and Alaska Native
Place of birth - Native, outside of US (%) - Multirace
Place of birth - Native, outside of US (%) - Other Race
Place of birth - Foreign born (%)
Place of birth - Foreign born (%) - White
Place of birth - Foreign born (%) - Black or African American
Place of birth - Foreign born (%) - Asian
Place of birth - Foreign born (%) - Hispanic or Latino
Place of birth - Foreign born (%) - American Indian and Alaska Native
Place of birth - Foreign born (%) - Multirace
Place of birth - Foreign born (%) - Other Race
Residents speaking English at home (%)
Residents speaking English at home - Born in the United States (%)
Residents speaking English at home - Native, born elsewhere (%)
Residents speaking English at home - Foreign born (%)
Residents speaking Spanish at home (%)
Residents speaking Spanish at home - Born in the United States (%)
Residents speaking Spanish at home - Native, born elsewhere (%)
Residents speaking Spanish at home - Foreign born (%)
Residents speaking other language at home (%)
Residents speaking other language at home - Born in the United States (%)
Residents speaking other language at home - Native, born elsewhere (%)
Residents speaking other language at home - Foreign born (%)
Marital status - Never married (%)
Marital status - Now married (%)
Marital status - Separated (%)
Marital status - Widowed (%)
Marital status - Divorced (%)
Ancestries Reported - Arab (%)
Ancestries Reported - Czech (%)
Ancestries Reported - Danish (%)
Ancestries Reported - Dutch (%)
Ancestries Reported - English (%)
Ancestries Reported - French (%)
Ancestries Reported - French Canadian (%)
Ancestries Reported - German (%)
Ancestries Reported - Greek (%)
Ancestries Reported - Hungarian (%)
Ancestries Reported - Irish (%)
Ancestries Reported - Italian (%)
Ancestries Reported - Lithuanian (%)
Ancestries Reported - Norwegian (%)
Ancestries Reported - Polish (%)
Ancestries Reported - Portuguese (%)
Ancestries Reported - Russian (%)
Ancestries Reported - Scotch-Irish (%)
Ancestries Reported - Scottish (%)
Ancestries Reported - Slovak (%)
Ancestries Reported - Subsaharan African (%)
Ancestries Reported - Swedish (%)
Ancestries Reported - Swiss (%)
Ancestries Reported - Ukrainian (%)
Ancestries Reported - United States (%)
Ancestries Reported - Welsh (%)
Ancestries Reported - West Indian (%)
Ancestries Reported - Other (%)
Geographical mobility - Same house 1 year ago (%)
Geographical mobility - Same house 1 year ago (%) - White
Geographical mobility - Same house 1 year ago (%) - Black or African American
Geographical mobility - Same house 1 year ago (%) - Asian
Geographical mobility - Same house 1 year ago (%) - Hispanic or Latino
Geographical mobility - Same house 1 year ago (%) - American Indian and Alaska Native
Geographical mobility - Same house 1 year ago (%) - Multirace
Geographical mobility - Same house 1 year ago (%) - Other Race
Geographical mobility - Moved within same county (%)
Geographical mobility - Moved within same county (%) - White
Geographical mobility - Moved within same county (%) - Black or African American
Geographical mobility - Moved within same county (%) - Asian
Geographical mobility - Moved within same county (%) - Hispanic or Latino
Geographical mobility - Moved within same county (%) - American Indian and Alaska Native
Geographical mobility - Moved within same county (%) - Multirace
Geographical mobility - Moved within same county (%) - Other Race
Geographical mobility - Moved from different county within same state (%)
Geographical mobility - Moved from different county within same state (%) - White
Geographical mobility - Moved from different county within same state (%) - Black or African American
Geographical mobility - Moved from different county within same state (%) - Asian
Geographical mobility - Moved from different county within same state (%) - Hispanic or Latino
Geographical mobility - Moved from different county within same state (%) - American Indian and Alaska Native
Geographical mobility - Moved from different county within same state (%) - Multirace
Geographical mobility - Moved from different county within same state (%) - Other Race
Geographical mobility - Moved from different state (%)
Geographical mobility - Moved from different state (%) - White
Geographical mobility - Moved from different state (%) - Black or African American
Geographical mobility - Moved from different state (%) - Asian
Geographical mobility - Moved from different state (%) - Hispanic or Latino
Geographical mobility - Moved from different state (%) - American Indian and Alaska Native
Geographical mobility - Moved from different state (%) - Multirace
Geographical mobility - Moved from different state (%) - Other Race
Geographical mobility - Moved from abroad (%)
Geographical mobility - Moved from abroad (%) - White
Geographical mobility - Moved from abroad (%) - Black or African American
Geographical mobility - Moved from abroad (%) - Asian
Geographical mobility - Moved from abroad (%) - Hispanic or Latino
Geographical mobility - Moved from abroad (%) - American Indian and Alaska Native
Geographical mobility - Moved from abroad (%) - Multirace
Geographical mobility - Moved from abroad (%) - Other Race
Place of birth for the foreign-born population - Ireland (%)
Place of birth for the foreign-born population - Denmark (%)
Place of birth for the foreign-born population - Norway (%)
Place of birth for the foreign-born population - Sweden (%)
Place of birth for the foreign-born population - United Kingdom (%)
Place of birth for the foreign-born population - England (%)
Place of birth for the foreign-born population - Scotland (%)
Place of birth for the foreign-born population - Other Northern Europe (%)
Place of birth for the foreign-born population - Austria (%)
Place of birth for the foreign-born population - Belgium (%)
Place of birth for the foreign-born population - France (%)
Place of birth for the foreign-born population - Germany (%)
Place of birth for the foreign-born population - Netherlands (%)
Place of birth for the foreign-born population - Switzerland (%)
Place of birth for the foreign-born population - Other Western Europe (%)
Place of birth for the foreign-born population - Greece (%)
Place of birth for the foreign-born population - Italy (%)
Place of birth for the foreign-born population - Portugal (%)
Place of birth for the foreign-born population - Spain (%)
Place of birth for the foreign-born population - Other Southern Europe (%)
Place of birth for the foreign-born population - Albania (%)
Place of birth for the foreign-born population - Belarus (%)
Place of birth for the foreign-born population - Bosnia and Herzegovina (%)
Place of birth for the foreign-born population - Bulgaria (%)
Place of birth for the foreign-born population - Croatia (%)
Place of birth for the foreign-born population - Czechoslovakia (%)
Place of birth for the foreign-born population - Hungary (%)
Place of birth for the foreign-born population - Latvia (%)
Place of birth for the foreign-born population - Lithuania (%)
Place of birth for the foreign-born population - North Macedonia (Macedonia) (%)
Place of birth for the foreign-born population - Moldova (%)
Place of birth for the foreign-born population - Poland (%)
Place of birth for the foreign-born population - Romania (%)
Place of birth for the foreign-born population - Russia (%)
Place of birth for the foreign-born population - Serbia (%)
Place of birth for the foreign-born population - Ukraine (%)
Place of birth for the foreign-born population - Other Eastern Europe (%)
Place of birth for the foreign-born population - China (%)
Place of birth for the foreign-born population - Hong Kong (%)
Place of birth for the foreign-born population - Taiwan (%)
Place of birth for the foreign-born population - Japan (%)
Place of birth for the foreign-born population - Korea (%)
Place of birth for the foreign-born population - Other Eastern Asia (%)
Place of birth for the foreign-born population - Afghanistan (%)
Place of birth for the foreign-born population - Bangladesh (%)
Place of birth for the foreign-born population - India (%)
Place of birth for the foreign-born population - Iran (%)
Place of birth for the foreign-born population - Kazakhstan (%)
Place of birth for the foreign-born population - Nepal (%)
Place of birth for the foreign-born population - Pakistan (%)
Place of birth for the foreign-born population - Sri Lanka (%)
Place of birth for the foreign-born population - Uzbekistan (%)
Place of birth for the foreign-born population - Other South Central Asia (%)
Place of birth for the foreign-born population - Burma (%)
Place of birth for the foreign-born population - Cambodia (%)
Place of birth for the foreign-born population - Indonesia (%)
Place of birth for the foreign-born population - Laos (%)
Place of birth for the foreign-born population - Malaysia (%)
Place of birth for the foreign-born population - Philippines (%)
Place of birth for the foreign-born population - Singapore (%)
Place of birth for the foreign-born population - Thailand (%)
Place of birth for the foreign-born population - Vietnam (%)
Place of birth for the foreign-born population - Other South Eastern Asia (%)
Place of birth for the foreign-born population - Armenia (%)
Place of birth for the foreign-born population - Iraq (%)
Place of birth for the foreign-born population - Israel (%)
Place of birth for the foreign-born population - Jordan (%)
Place of birth for the foreign-born population - Kuwait (%)
Place of birth for the foreign-born population - Lebanon (%)
Place of birth for the foreign-born population - Saudi Arabia (%)
Place of birth for the foreign-born population - Syria (%)
Place of birth for the foreign-born population - Turkey (%)
Place of birth for the foreign-born population - Yemen (%)
Place of birth for the foreign-born population - Other Western Asia (%)
Place of birth for the foreign-born population - Eritrea (%)
Place of birth for the foreign-born population - Ethiopia (%)
Place of birth for the foreign-born population - Kenya (%)
Place of birth for the foreign-born population - Somalia (%)
Place of birth for the foreign-born population - Uganda (%)
Place of birth for the foreign-born population - Zimbabwe (%)
Place of birth for the foreign-born population - Other Eastern Africa (%)
Place of birth for the foreign-born population - Cameroon (%)
Place of birth for the foreign-born population - Congo (%)
Place of birth for the foreign-born population - Democratic Republic of Congo (Zaire) (%)
Place of birth for the foreign-born population - Other Middle Africa (%)
Place of birth for the foreign-born population - Egypt (%)
Place of birth for the foreign-born population - Morocco (%)
Place of birth for the foreign-born population - Sudan (%)
Place of birth for the foreign-born population - Other Northern Africa (%)
Place of birth for the foreign-born population - South Africa (%)
Place of birth for the foreign-born population - Other Southern Africa (%)
Place of birth for the foreign-born population - Cabo Verde (%)
Place of birth for the foreign-born population - Ghana (%)
Place of birth for the foreign-born population - Liberia (%)
Place of birth for the foreign-born population - Nigeria (%)
Place of birth for the foreign-born population - Senegal (%)
Place of birth for the foreign-born population - Sierra Leone (%)
Place of birth for the foreign-born population - Other Western Africa (%)
Place of birth for the foreign-born population - Australia (%)
Place of birth for the foreign-born population - New Zealand (%)
Place of birth for the foreign-born population - Fiji (%)
Place of birth for the foreign-born population - Micronesia (%)
Place of birth for the foreign-born population - Bahamas (%)
Place of birth for the foreign-born population - Barbados (%)
Place of birth for the foreign-born population - Cuba (%)
Place of birth for the foreign-born population - Dominica (%)
Place of birth for the foreign-born population - Dominican Republic (%)
Place of birth for the foreign-born population - Grenada (%)
Place of birth for the foreign-born population - Haiti (%)
Place of birth for the foreign-born population - Jamaica (%)
Place of birth for the foreign-born population - St. Vincent and the Grenadines (%)
Place of birth for the foreign-born population - Trinidad and Tobago (%)
Place of birth for the foreign-born population - West Indies (%)
Place of birth for the foreign-born population - Other Caribbean (%)
Place of birth for the foreign-born population - Belize (%)
Place of birth for the foreign-born population - Costa Rica (%)
Place of birth for the foreign-born population - El Salvador (%)
Place of birth for the foreign-born population - Guatemala (%)
Place of birth for the foreign-born population - Honduras (%)
Place of birth for the foreign-born population - Mexico (%)
Place of birth for the foreign-born population - Nicaragua (%)
Place of birth for the foreign-born population - Panama (%)
Place of birth for the foreign-born population - Other Central America (%)
Place of birth for the foreign-born population - Argentina (%)
Place of birth for the foreign-born population - Bolivia (%)
Place of birth for the foreign-born population - Brazil (%)
Place of birth for the foreign-born population - Chile (%)
Place of birth for the foreign-born population - Colombia (%)
Place of birth for the foreign-born population - Ecuador (%)
Place of birth for the foreign-born population - Guyana (%)
Place of birth for the foreign-born population - Peru (%)
Place of birth for the foreign-born population - Uruguay (%)
Place of birth for the foreign-born population - Venezuela (%)
Place of birth for the foreign-born population - Other South America (%)
Place of birth for the foreign-born population - Canada (%)
Place of birth for the foreign-born population - Other Northern America (%)
Place of birth for the foreign-born population - Other (%)
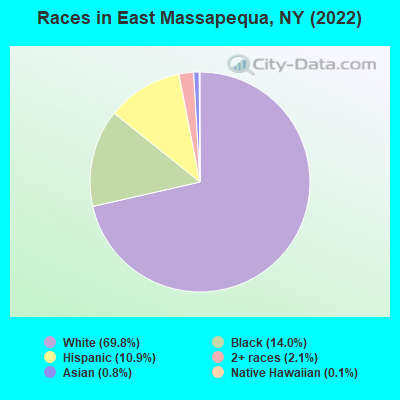
According to 2022 data, the most numerous races in East Massapequa, NY are White alone (13,558 residents), Hispanic (2,122 residents), and Black alone (2,720 residents). 87.1% of East Massapequa residents speak English at home. 10.3% of East Massapequa, NY residents are foreign-born (6.7% born in Latin America, 2.1% born in Europe), which is 113.6% less than the foreign-born rate of 22.0% across the entire state of New York.
Race distribution in East Massapequa
2000 2022
11,760,981 62.0% White alone 2,867,583 15.1% Hispanic 2,812,623 14.8% Black alone 1,035,926 5.5% Asian alone 366,116 1.9% Two or more races 75,499 0.4% Other race alone 52,499 0.3% American Indian alone 5,230 0.03% Native Hawaiian and Other
10,408,933 52.9% White alone 3,867,299 19.7% Hispanic 2,633,840 13.4% Black alone 1,776,286 9.0% Asian alone 732,670 3.7% Two or more races 216,110 1.1% Other race alone 35,082 0.2% American Indian alone 6,931 0.04% Native Hawaiian and Other
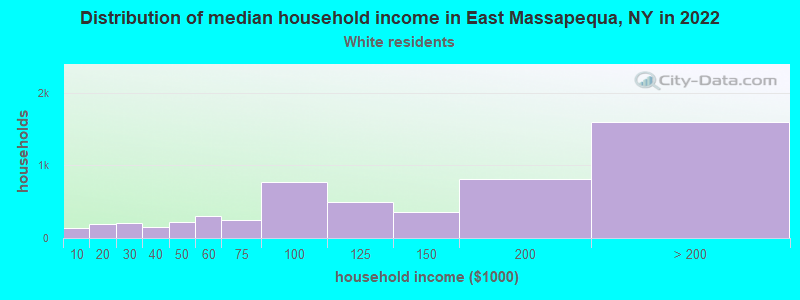
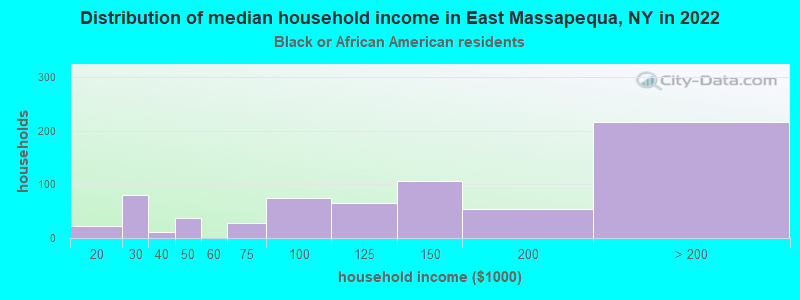
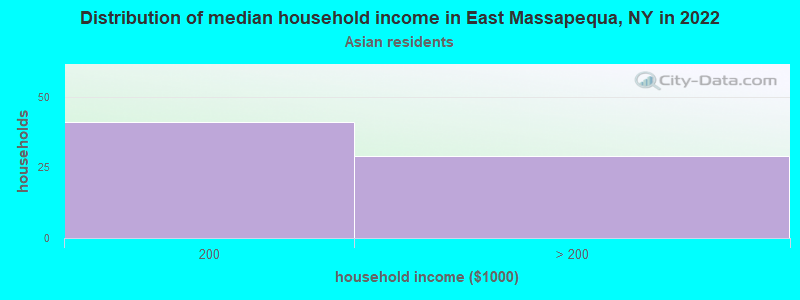
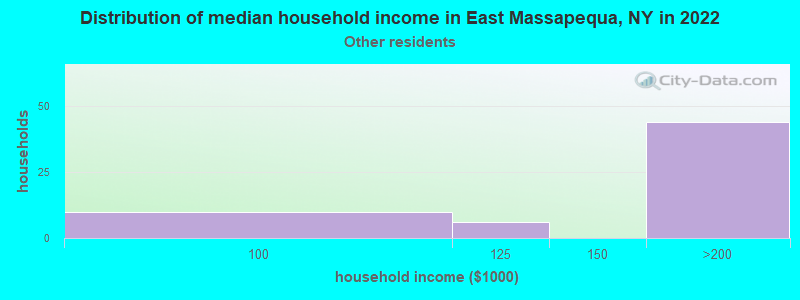
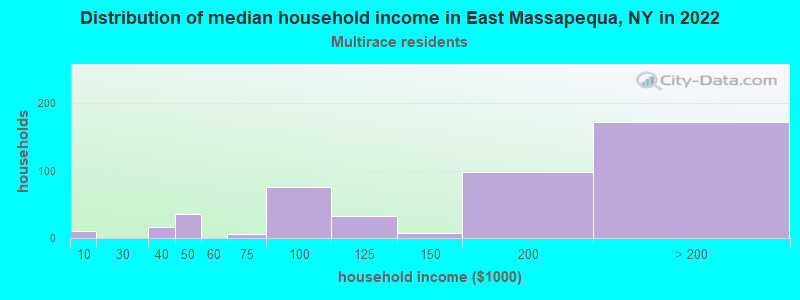
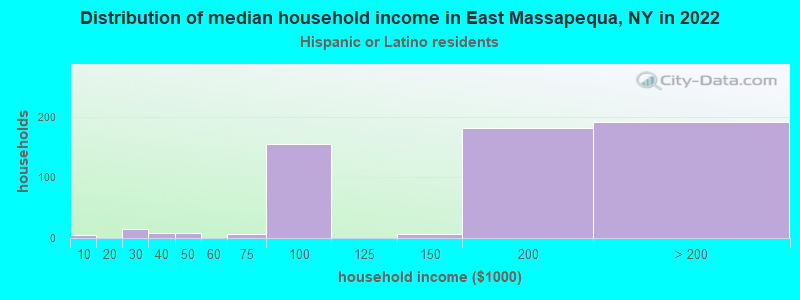
Income and house value in East Massapequa Median household income in 2022 $129,926 White non-Hispanic householders$146,297 Black householders$183,677 Some other race householders$182,218 Two or more races householders$179,583 Hispanic or Latino race householdersMedian 2022 house value $612,973 White Non-Hispanic householders$446,464 Black or African American householders$620,815 American Indian or Alaska Native householders $468,421 Asian householders$32,674 Native Hawaiian and other Pacific Islander householders$485,935 Some other race householders$469,206 Two or more races householders$484,889 Hispanic or Latino householders
Median age by race in East Massapequa
50.3 Median age for White residents47.5 52.2 45.8 Median age for Black or African American residents47.8 37.5 -855,158,729.3 Median age for American Indian / Alaska Native residents-607,543,322.5 -837,121,211.3 30.1 Median age for Asian residents-692,098,092.0 29.5 -487,992,314.6 Median age for Native Hawaiian / Pacific Islander residents-477,502,295.2 -497,387,669.3 52.1 Median age for Other race residents39.2 58.3 34.1 Median age for Two or more races residents32.7 36.8 50.4 Median age for White alone residents49.2 52.2 37.2 Median age for Hispanic or Latino residents35.6 43.1
Owner/renter occupied households by race in East Massapequa
House owners and renters - White residents 4,824 88.0% Owner occupied661 12.0% Renter occupiedHouse owners and renters - Black or African American residents 768 100.0% Owner occupiedHouse owners and renters - Asian residents 28 41.4% Owner occupied40 58.6% Renter occupiedHouse owners and renters - Native Hawaiian / Pacific Islander residents 30 100.0% Owner occupiedHouse owners and renters - Other race residents 64 100.0% Owner occupiedHouse owners and renters - Two or more races residents 454 99.4% Owner occupied3 0.6% Renter occupiedHouse owners and renters - White alone residents 4,744 87.8% Owner occupied658 12.2% Renter occupiedHouse owners and renters - Hispanic or Latino residents 537 91.5% Owner occupied50 8.5% Renter occupied
Language usage in East Massapequa
English speakers - Total 87.1% of residents of East Massapequa speak English at home.
5.4% of residents speak Spanish at home 728 73.2% Speak English very well267 26.8% Speak English less than very well6.7% of residents speak other language at home 955 77.3% Speak English very well280 22.7% Speak English less than very well
English speakers - Born in the United States 91.3% of residents of East Massapequa speak English at home.
6.6% of residents speak Spanish at home 76 100.0% Speak English very well2.8% of residents speak other language at home 32 100.0% Speak English very well
English speakers - Native, born elsewhere 84.7% of residents of East Massapequa speak English at home.
11.7% of residents speak Spanish at home 13 100.0% Speak English less than very well
English speakers - Foreign-born 40.2% of residents of East Massapequa speak English at home.
20.9% of residents speak Spanish at home 246 56.9% Speak English very well186 43.1% Speak English less than very well36.2% of residents speak other language at home 502 67.0% Speak English very well247 33.0% Speak English less than very well
White (Caucasian) - Speak only English Native:
96.9% (12,336)Foreign-born:
37.7% (208)
White (Caucasian) - Speak another language Native:
3.8% (489)Foreign-born:
64.1% (354)
Black or African American - Speak only English Native:
90.5% (1,507)Foreign-born:
55.2% (459)
Black or African American - Speak another language Native:
9.4% (156)Foreign-born:
44.9% (373)
Asian - Speak another language Native:
96.6% (72)Foreign-born:
46.0% (35)
Other race - Speak only English Native:
63.8% (104)Foreign-born:
13.5% (4)
Other race - Speak another language Native:
39.9% (65)Foreign-born:
84.6% (26)
Two or more races - Speak only English Native:
84.1% (1,158)Foreign-born:
31.2% (146)
Two or more races - Speak another language Native:
11.4% (156)Foreign-born:
66.8% (313)
White alone - Speak only English Native:
96.5% (12,050)Foreign-born:
44.0% (221)
White alone - Speak another language Native:
3.7% (457)Foreign-born:
55.6% (279)
Hispanic or Latino - Speak only English Native:
77.2% (1,087)Foreign-born:
21.7% (119)
Hispanic or Latino - Speak another language Native:
22.1% (311)Foreign-born:
78.3% (429)
Foreign-born residents in East Massapequa 2,001 residents are foreign born (6.7% Latin America , 2.1% Europe ).
This city:
10.3%New York:
22.6%
Marital status for residents in East Massapequa Marital status - White (Caucasian) population 15 years and over
Males 28.4% Never married60.1% Now married2.1% Separated2.3% Widowed7.1% DivorcedFemales 23.6% Never married56.0% Now married1.3% Separated9.5% Widowed9.7% DivorcedWomen who gave birth in the past 12 months Now married:
100.0% (205)Unmarried:
0.0% (0)
Women who did not give birth in the past 12 months Now married:
45.3% (1,090)Unmarried:
54.7% (1,314)
Marital status - Black or African American population 15 years and over
Males 36.2% Never married36.0% Now married15.3% Separated0.8% Widowed11.8% DivorcedFemales 46.1% Never married34.6% Now married7.6% Separated10.5% Widowed1.3% DivorcedWomen who did not give birth in the past 12 months Now married:
32.7% (226)Unmarried:
67.3% (465)
Marital status - Asian population 15 years and over
Males 0.0% Never married100.0% Now married0.0% Separated0.0% Widowed0.0% DivorcedFemales 38.2% Never married61.8% Now married0.0% Separated0.0% Widowed0.0% DivorcedWomen who did not give birth in the past 12 months Now married:
59.8% (64)Unmarried:
40.2% (43)
Marital status - Other race population 15 years and over
Males 29.1% Never married70.9% Now married0.0% Separated0.0% Widowed0.0% DivorcedFemales 0.0% Never married60.4% Now married20.8% Separated0.0% Widowed18.9% DivorcedWomen who did not give birth in the past 12 months Now married:
100.0% (26)Unmarried:
0.0% (0)
Marital status - Two or more races population 15 years and over
Males 41.1% Never married48.2% Now married0.0% Separated4.5% Widowed6.2% DivorcedFemales 8.3% Never married65.0% Now married2.9% Separated2.9% Widowed20.9% DivorcedWomen who gave birth in the past 12 months Now married:
100.0% (59)Unmarried:
0.0% (0)
Women who did not give birth in the past 12 months Now married:
61.0% (172)Unmarried:
39.0% (110)
Marital status - White alone, not Hispanic / Latino population 15 years and over
Males 27.8% Never married61.2% Now married2.0% Separated2.4% Widowed6.7% DivorcedFemales 23.4% Never married56.4% Now married1.1% Separated9.6% Widowed9.5% DivorcedWomen who gave birth in the past 12 months Now married:
100.0% (219)Unmarried:
0.0% (0)
Women who did not give birth in the past 12 months Now married:
45.2% (1,064)Unmarried:
54.8% (1,292)
Marital status - Hispanic or Latino population 15 years and over
Males 37.6% Never married48.5% Now married1.5% Separated3.4% Widowed9.0% DivorcedFemales 17.1% Never married54.5% Now married5.9% Separated4.7% Widowed17.7% DivorcedWomen who gave birth in the past 12 months Now married:
100.0% (39)Unmarried:
0.0% (0)
Women who did not give birth in the past 12 months Now married:
53.2% (213)Unmarried:
46.8% (187)
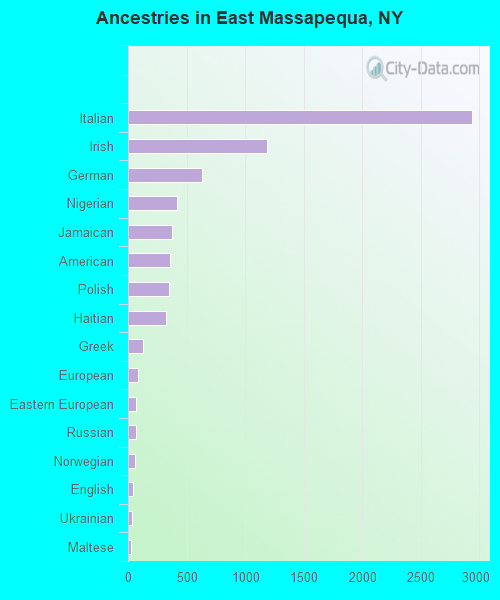
Ancestries in East Massapequa
2,937 31.6% Italian1,186 12.8% Irish636 6.9% German422 4.5% Nigerian373 4.0% Jamaican359 3.9% American347 3.7% Polish328 3.5% Haitian128 1.4% Greek87 0.9% European70 0.8% Eastern European65 0.7% Russian60 0.6% Norwegian40 0.4% English37 0.4% Ukrainian28 0.3% Maltese26 0.3% Romanian23 0.2% Scottish23 0.2% West Indian21 0.2% Lebanese20 0.2% Hungarian16 0.2% Iranian14 0.2% Armenian14 0.2% Czechoslovakian12 0.1% Israeli10 0.1% French Canadian7 0.08% Yugoslavian6 0.06% Dutch6 0.06% French6 0.06% Luxembourger5 0.05% Austrian5 0.05% Croatian
Children Nativity (place of birth) in East Massapequa
Children under 6 years - Living with two parents Both parents native 791 100.0% NativeBoth parents foreign-born 165 100.0% NativeOne native, one foreign-born parent 153 100.0% NativeChildren under 6 years - Living with one parent Native parent 60 100.0% NativeChildren 6 to 17 years - Living with two parents Both parents native 1,400 100.0% NativeBoth parents foreign-born 226 100.0% NativeOne native, one foreign-born parent 154 100.0% NativeChildren 6 to 17 years - Living with one parent Native parent 395 100.0% NativeForeign-born parent 134 50.8% Native130 49.2% Foreign-born
Grandparents responsible for own grandchildren in East Massapequa
Grandparents (30 to 59 years) White / Caucasian 18 73.0% Responsible for grandchildren6 27.0% Not responsible for grandchildrenWhite alone, not Hispanic / Latino 19 82.0% Responsible for grandchildren4 18.0% Not responsible for grandchildrenGrandparents (60 years and over) White / Caucasian 23 23.6% Responsible for grandchildren75 76.4% Not responsible for grandchildrenWhite alone, not Hispanic / Latino 22 22.7% Responsible for grandchildren74 77.3% Not responsible for grandchildren