Races in East Cameron, Texas (TX) Detailed Stats
Ancestries, Foreign-born residents, place of birth
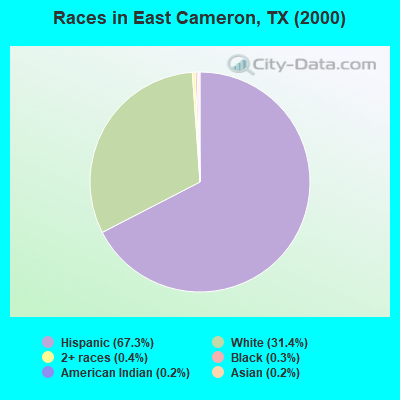
Race distribution in East Cameron

- 12,34967.3%Hispanic
- 5,77031.4%White alone
- 820.4%Two or more races
- 580.3%Black alone
- 380.2%Asian alone
- 450.2%American Indian alone
- 70.04%Other race alone
- 70.04%Native Hawaiian and Other
Pacific Islander alone
2000
2022
-
- 10,933,31352.4%White alone
- 6,669,66632.0%Hispanic
- 2,364,25511.3%Black alone
- 554,4452.7%Asian alone
- 230,5671.1%Two or more races
- 68,8590.3%American Indian alone
- 19,9580.10%Other race alone
- 10,7570.05%Native Hawaiian and Other
Pacific Islander alone

-
- 12,070,64240.2%Hispanic
- 11,683,43038.9%White alone
- 3,508,70611.7%Black alone
- 1,608,1735.4%Asian alone
- 956,5603.2%Two or more races
- 125,7630.4%Other race alone
- 47,0230.2%American Indian alone
- 29,2750.10%Native Hawaiian and Other
Pacific Islander alone

Income and house value in East Cameron
- Median household income in 2022
- $64,877White non-Hispanic householders
- $31,909Black householders
- $45,023American Indian and Alaska Native householders
- $55,648Asian householders
- $41,028Some other race householders
- $51,712Two or more races householders
- $47,136Hispanic or Latino race householders
- Median 2022 house value
- $376,855White Non-Hispanic householders
- $180,645Black or African American householders
- $625,312American Indian or Alaska Native householders
- $289,589Asian householders
- $135,623Some other race householders
- $177,588Two or more races householders
- $143,960Hispanic or Latino householders
Household income for White non-Hispanic householders

Household income for Black householders

Household income for American Indian and Alaska Native householders

Household income for Asian householders

Household income for Two or more races householders

Household income for Hispanic or Latino race householders
