Races in Coral Terrace, Florida (FL) Detailed Stats
Data:
Races - White alone (%)
Races - White alone (% change since 2000)
Races - Black alone (%)
Races - Black alone (% change since 2000)
Races - American Indian alone (%)
Races - American Indian alone (% change since 2000)
Races - Asian alone (%)
Races - Asian alone (% change since 2000)
Races - Hispanic (%)
Races - Hispanic (% change since 2000)
Races - Native Hawaiian and Other Pacific Islander alone (%)
Races - Native Hawaiian and Other Pacific Islander alone (% change since 2000)
Races - Two or more races(%)
Races - Two or more races(% change since 2000)
Races - Other race alone (%)
Races - Other race alone (% change since 2000)
Racial diversity
Place of birth - Born in state of residence (%)
Place of birth - Born in state of residence (%) - White
Place of birth - Born in state of residence (%) - Black or African American
Place of birth - Born in state of residence (%) - Asian
Place of birth - Born in state of residence (%) - Hispanic or Latino
Place of birth - Born in state of residence (%) - American Indian and Alaska Native
Place of birth - Born in state of residence (%) - Multirace
Place of birth - Born in state of residence (%) - Other Race
Place of birth - Born in other state (%)
Place of birth - Born in other state (%) - White
Place of birth - Born in other state (%) - Black or African American
Place of birth - Born in other state (%) - Asian
Place of birth - Born in other state (%) - Hispanic or Latino
Place of birth - Born in other state (%) - American Indian and Alaska Native
Place of birth - Born in other state (%) - Multirace
Place of birth - Born in other state (%) - Other Race
Place of birth - Native, outside of US (%)
Place of birth - Native, outside of US (%) - White
Place of birth - Native, outside of US (%) - Black or African American
Place of birth - Native, outside of US (%) - Asian
Place of birth - Native, outside of US (%) - Hispanic or Latino
Place of birth - Native, outside of US (%) - American Indian and Alaska Native
Place of birth - Native, outside of US (%) - Multirace
Place of birth - Native, outside of US (%) - Other Race
Place of birth - Foreign born (%)
Place of birth - Foreign born (%) - White
Place of birth - Foreign born (%) - Black or African American
Place of birth - Foreign born (%) - Asian
Place of birth - Foreign born (%) - Hispanic or Latino
Place of birth - Foreign born (%) - American Indian and Alaska Native
Place of birth - Foreign born (%) - Multirace
Place of birth - Foreign born (%) - Other Race
Residents speaking English at home (%)
Residents speaking English at home - Born in the United States (%)
Residents speaking English at home - Native, born elsewhere (%)
Residents speaking English at home - Foreign born (%)
Residents speaking Spanish at home (%)
Residents speaking Spanish at home - Born in the United States (%)
Residents speaking Spanish at home - Native, born elsewhere (%)
Residents speaking Spanish at home - Foreign born (%)
Residents speaking other language at home (%)
Residents speaking other language at home - Born in the United States (%)
Residents speaking other language at home - Native, born elsewhere (%)
Residents speaking other language at home - Foreign born (%)
Marital status - Never married (%)
Marital status - Now married (%)
Marital status - Separated (%)
Marital status - Widowed (%)
Marital status - Divorced (%)
Ancestries Reported - Arab (%)
Ancestries Reported - Czech (%)
Ancestries Reported - Danish (%)
Ancestries Reported - Dutch (%)
Ancestries Reported - English (%)
Ancestries Reported - French (%)
Ancestries Reported - French Canadian (%)
Ancestries Reported - German (%)
Ancestries Reported - Greek (%)
Ancestries Reported - Hungarian (%)
Ancestries Reported - Irish (%)
Ancestries Reported - Italian (%)
Ancestries Reported - Lithuanian (%)
Ancestries Reported - Norwegian (%)
Ancestries Reported - Polish (%)
Ancestries Reported - Portuguese (%)
Ancestries Reported - Russian (%)
Ancestries Reported - Scotch-Irish (%)
Ancestries Reported - Scottish (%)
Ancestries Reported - Slovak (%)
Ancestries Reported - Subsaharan African (%)
Ancestries Reported - Swedish (%)
Ancestries Reported - Swiss (%)
Ancestries Reported - Ukrainian (%)
Ancestries Reported - United States (%)
Ancestries Reported - Welsh (%)
Ancestries Reported - West Indian (%)
Ancestries Reported - Other (%)
Geographical mobility - Same house 1 year ago (%)
Geographical mobility - Same house 1 year ago (%) - White
Geographical mobility - Same house 1 year ago (%) - Black or African American
Geographical mobility - Same house 1 year ago (%) - Asian
Geographical mobility - Same house 1 year ago (%) - Hispanic or Latino
Geographical mobility - Same house 1 year ago (%) - American Indian and Alaska Native
Geographical mobility - Same house 1 year ago (%) - Multirace
Geographical mobility - Same house 1 year ago (%) - Other Race
Geographical mobility - Moved within same county (%)
Geographical mobility - Moved within same county (%) - White
Geographical mobility - Moved within same county (%) - Black or African American
Geographical mobility - Moved within same county (%) - Asian
Geographical mobility - Moved within same county (%) - Hispanic or Latino
Geographical mobility - Moved within same county (%) - American Indian and Alaska Native
Geographical mobility - Moved within same county (%) - Multirace
Geographical mobility - Moved within same county (%) - Other Race
Geographical mobility - Moved from different county within same state (%)
Geographical mobility - Moved from different county within same state (%) - White
Geographical mobility - Moved from different county within same state (%) - Black or African American
Geographical mobility - Moved from different county within same state (%) - Asian
Geographical mobility - Moved from different county within same state (%) - Hispanic or Latino
Geographical mobility - Moved from different county within same state (%) - American Indian and Alaska Native
Geographical mobility - Moved from different county within same state (%) - Multirace
Geographical mobility - Moved from different county within same state (%) - Other Race
Geographical mobility - Moved from different state (%)
Geographical mobility - Moved from different state (%) - White
Geographical mobility - Moved from different state (%) - Black or African American
Geographical mobility - Moved from different state (%) - Asian
Geographical mobility - Moved from different state (%) - Hispanic or Latino
Geographical mobility - Moved from different state (%) - American Indian and Alaska Native
Geographical mobility - Moved from different state (%) - Multirace
Geographical mobility - Moved from different state (%) - Other Race
Geographical mobility - Moved from abroad (%)
Geographical mobility - Moved from abroad (%) - White
Geographical mobility - Moved from abroad (%) - Black or African American
Geographical mobility - Moved from abroad (%) - Asian
Geographical mobility - Moved from abroad (%) - Hispanic or Latino
Geographical mobility - Moved from abroad (%) - American Indian and Alaska Native
Geographical mobility - Moved from abroad (%) - Multirace
Geographical mobility - Moved from abroad (%) - Other Race
Place of birth for the foreign-born population - Ireland (%)
Place of birth for the foreign-born population - Denmark (%)
Place of birth for the foreign-born population - Norway (%)
Place of birth for the foreign-born population - Sweden (%)
Place of birth for the foreign-born population - United Kingdom (%)
Place of birth for the foreign-born population - England (%)
Place of birth for the foreign-born population - Scotland (%)
Place of birth for the foreign-born population - Other Northern Europe (%)
Place of birth for the foreign-born population - Austria (%)
Place of birth for the foreign-born population - Belgium (%)
Place of birth for the foreign-born population - France (%)
Place of birth for the foreign-born population - Germany (%)
Place of birth for the foreign-born population - Netherlands (%)
Place of birth for the foreign-born population - Switzerland (%)
Place of birth for the foreign-born population - Other Western Europe (%)
Place of birth for the foreign-born population - Greece (%)
Place of birth for the foreign-born population - Italy (%)
Place of birth for the foreign-born population - Portugal (%)
Place of birth for the foreign-born population - Spain (%)
Place of birth for the foreign-born population - Other Southern Europe (%)
Place of birth for the foreign-born population - Albania (%)
Place of birth for the foreign-born population - Belarus (%)
Place of birth for the foreign-born population - Bosnia and Herzegovina (%)
Place of birth for the foreign-born population - Bulgaria (%)
Place of birth for the foreign-born population - Croatia (%)
Place of birth for the foreign-born population - Czechoslovakia (%)
Place of birth for the foreign-born population - Hungary (%)
Place of birth for the foreign-born population - Latvia (%)
Place of birth for the foreign-born population - Lithuania (%)
Place of birth for the foreign-born population - North Macedonia (Macedonia) (%)
Place of birth for the foreign-born population - Moldova (%)
Place of birth for the foreign-born population - Poland (%)
Place of birth for the foreign-born population - Romania (%)
Place of birth for the foreign-born population - Russia (%)
Place of birth for the foreign-born population - Serbia (%)
Place of birth for the foreign-born population - Ukraine (%)
Place of birth for the foreign-born population - Other Eastern Europe (%)
Place of birth for the foreign-born population - China (%)
Place of birth for the foreign-born population - Hong Kong (%)
Place of birth for the foreign-born population - Taiwan (%)
Place of birth for the foreign-born population - Japan (%)
Place of birth for the foreign-born population - Korea (%)
Place of birth for the foreign-born population - Other Eastern Asia (%)
Place of birth for the foreign-born population - Afghanistan (%)
Place of birth for the foreign-born population - Bangladesh (%)
Place of birth for the foreign-born population - India (%)
Place of birth for the foreign-born population - Iran (%)
Place of birth for the foreign-born population - Kazakhstan (%)
Place of birth for the foreign-born population - Nepal (%)
Place of birth for the foreign-born population - Pakistan (%)
Place of birth for the foreign-born population - Sri Lanka (%)
Place of birth for the foreign-born population - Uzbekistan (%)
Place of birth for the foreign-born population - Other South Central Asia (%)
Place of birth for the foreign-born population - Burma (%)
Place of birth for the foreign-born population - Cambodia (%)
Place of birth for the foreign-born population - Indonesia (%)
Place of birth for the foreign-born population - Laos (%)
Place of birth for the foreign-born population - Malaysia (%)
Place of birth for the foreign-born population - Philippines (%)
Place of birth for the foreign-born population - Singapore (%)
Place of birth for the foreign-born population - Thailand (%)
Place of birth for the foreign-born population - Vietnam (%)
Place of birth for the foreign-born population - Other South Eastern Asia (%)
Place of birth for the foreign-born population - Armenia (%)
Place of birth for the foreign-born population - Iraq (%)
Place of birth for the foreign-born population - Israel (%)
Place of birth for the foreign-born population - Jordan (%)
Place of birth for the foreign-born population - Kuwait (%)
Place of birth for the foreign-born population - Lebanon (%)
Place of birth for the foreign-born population - Saudi Arabia (%)
Place of birth for the foreign-born population - Syria (%)
Place of birth for the foreign-born population - Turkey (%)
Place of birth for the foreign-born population - Yemen (%)
Place of birth for the foreign-born population - Other Western Asia (%)
Place of birth for the foreign-born population - Eritrea (%)
Place of birth for the foreign-born population - Ethiopia (%)
Place of birth for the foreign-born population - Kenya (%)
Place of birth for the foreign-born population - Somalia (%)
Place of birth for the foreign-born population - Uganda (%)
Place of birth for the foreign-born population - Zimbabwe (%)
Place of birth for the foreign-born population - Other Eastern Africa (%)
Place of birth for the foreign-born population - Cameroon (%)
Place of birth for the foreign-born population - Congo (%)
Place of birth for the foreign-born population - Democratic Republic of Congo (Zaire) (%)
Place of birth for the foreign-born population - Other Middle Africa (%)
Place of birth for the foreign-born population - Egypt (%)
Place of birth for the foreign-born population - Morocco (%)
Place of birth for the foreign-born population - Sudan (%)
Place of birth for the foreign-born population - Other Northern Africa (%)
Place of birth for the foreign-born population - South Africa (%)
Place of birth for the foreign-born population - Other Southern Africa (%)
Place of birth for the foreign-born population - Cabo Verde (%)
Place of birth for the foreign-born population - Ghana (%)
Place of birth for the foreign-born population - Liberia (%)
Place of birth for the foreign-born population - Nigeria (%)
Place of birth for the foreign-born population - Senegal (%)
Place of birth for the foreign-born population - Sierra Leone (%)
Place of birth for the foreign-born population - Other Western Africa (%)
Place of birth for the foreign-born population - Australia (%)
Place of birth for the foreign-born population - New Zealand (%)
Place of birth for the foreign-born population - Fiji (%)
Place of birth for the foreign-born population - Micronesia (%)
Place of birth for the foreign-born population - Bahamas (%)
Place of birth for the foreign-born population - Barbados (%)
Place of birth for the foreign-born population - Cuba (%)
Place of birth for the foreign-born population - Dominica (%)
Place of birth for the foreign-born population - Dominican Republic (%)
Place of birth for the foreign-born population - Grenada (%)
Place of birth for the foreign-born population - Haiti (%)
Place of birth for the foreign-born population - Jamaica (%)
Place of birth for the foreign-born population - St. Vincent and the Grenadines (%)
Place of birth for the foreign-born population - Trinidad and Tobago (%)
Place of birth for the foreign-born population - West Indies (%)
Place of birth for the foreign-born population - Other Caribbean (%)
Place of birth for the foreign-born population - Belize (%)
Place of birth for the foreign-born population - Costa Rica (%)
Place of birth for the foreign-born population - El Salvador (%)
Place of birth for the foreign-born population - Guatemala (%)
Place of birth for the foreign-born population - Honduras (%)
Place of birth for the foreign-born population - Mexico (%)
Place of birth for the foreign-born population - Nicaragua (%)
Place of birth for the foreign-born population - Panama (%)
Place of birth for the foreign-born population - Other Central America (%)
Place of birth for the foreign-born population - Argentina (%)
Place of birth for the foreign-born population - Bolivia (%)
Place of birth for the foreign-born population - Brazil (%)
Place of birth for the foreign-born population - Chile (%)
Place of birth for the foreign-born population - Colombia (%)
Place of birth for the foreign-born population - Ecuador (%)
Place of birth for the foreign-born population - Guyana (%)
Place of birth for the foreign-born population - Peru (%)
Place of birth for the foreign-born population - Uruguay (%)
Place of birth for the foreign-born population - Venezuela (%)
Place of birth for the foreign-born population - Other South America (%)
Place of birth for the foreign-born population - Canada (%)
Place of birth for the foreign-born population - Other Northern America (%)
Place of birth for the foreign-born population - Other (%)
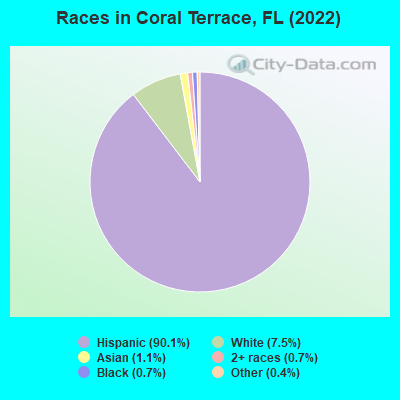
According to 2022 data, the most numerous races in Coral Terrace, FL are White alone (1,831 residents), Hispanic (22,033 residents), and Black alone (168 residents). 12.3% of Coral Terrace residents speak English at home. 63.7% of Coral Terrace, FL residents are foreign-born (60.4% born in Latin America), which is 67.0% greater than the foreign-born rate of 21.0% across the entire state of Florida.
Race distribution in Coral Terrace
2000 2022
10,458,509 65.4% White alone 2,682,715 16.8% Hispanic 2,264,268 14.2% Black alone 261,693 1.6% Asian alone 236,954 1.5% Two or more races 42,358 0.3% American Indian alone 28,994 0.2% Other race alone 6,887 0.04% Native Hawaiian and Other
11,309,403 50.8% White alone 6,025,039 27.1% Hispanic 3,241,015 14.6% Black alone 861,630 3.9% Two or more races 623,692 2.8% Asian alone 152,054 0.7% Other race alone 22,504 0.1% American Indian alone 9,486 0.04% Native Hawaiian and Other
Income and house value in Coral Terrace Median household income in 2022 $85,354 White non-Hispanic householders$112,187 Asian householders$99,172 Some other race householders$74,733 Two or more races householders$75,078 Hispanic or Latino race householdersMedian 2022 house value $518,262 White Non-Hispanic householders$437,065 Black or African American householders$330,227 American Indian or Alaska Native householders $385,394 Asian householders$512,046 Some other race householders$499,226 Two or more races householders$532,249 Hispanic or Latino householders
Median age by race in Coral Terrace
39.1 Median age for White residents39.1 40.0 40.7 Median age for Black or African American residents40.9 38.0 66.2 Median age for American Indian / Alaska Native residents-543,352,600.6 -762,696,213.5 50.5 Median age for Asian residents50.1 52.1 -679,849,340.2 Median age for Native Hawaiian / Pacific Islander residents-858,307,848.3 -443,298,968.6 62.6 Median age for Other race residents47.5 65.0 46.6 Median age for Two or more races residents46.2 50.6 38.4 Median age for White alone residents38.1 38.9 45.4 Median age for Hispanic or Latino residents44.9 48.8
Owner/renter occupied households by race in Coral Terrace
House owners and renters - White residents 1,608 68.5% Owner occupied741 31.5% Renter occupiedHouse owners and renters - Black or African American residents 5 26.8% Owner occupied12 73.2% Renter occupiedHouse owners and renters - American Indian / Alaska Native residents 19 100.0% Owner occupiedHouse owners and renters - Asian residents 59 85.1% Owner occupied10 14.9% Renter occupiedHouse owners and renters - Other race residents 379 72.7% Owner occupied143 27.3% Renter occupiedHouse owners and renters - Two or more races residents 3,634 58.4% Owner occupied2,591 41.6% Renter occupiedHouse owners and renters - White alone residents 559 79.5% Owner occupied144 20.5% Renter occupiedHouse owners and renters - Hispanic or Latino residents 4,616 61.5% Owner occupied2,893 38.5% Renter occupied
Language usage in Coral Terrace
English speakers - Total 12.3% of residents of Coral Terrace speak English at home.
85.2% of residents speak Spanish at home 9,456 47.7% Speak English very well10,374 52.3% Speak English less than very well2.4% of residents speak other language at home 325 58.2% Speak English very well233 41.8% Speak English less than very well
English speakers - Born in the United States 59.9% of residents of Coral Terrace speak English at home.
35.7% of residents speak Spanish at home 332 83.8% Speak English very well64 16.2% Speak English less than very well4.4% of residents speak other language at home 28 57.1% Speak English very well21 42.9% Speak English less than very well
English speakers - Native, born elsewhere 13.9% of residents of Coral Terrace speak English at home.
81.4% of residents speak Spanish at home 457 79.1% Speak English very well121 20.9% Speak English less than very well1.4% of residents speak other language at home 10 100.0% Speak English very well
English speakers - Foreign-born 3.7% of residents of Coral Terrace speak English at home.
93.1% of residents speak Spanish at home 4,743 32.9% Speak English very well9,691 67.1% Speak English less than very well3.1% of residents speak other language at home 269 55.7% Speak English very well214 44.3% Speak English less than very well
White (Caucasian) - Speak only English Native:
37.5% (1,307)Foreign-born:
6.3% (171)
White (Caucasian) - Speak another language Native:
56.4% (1,964)Foreign-born:
92.5% (2,530)
American Indian / Alaska Native - Speak another language Native:
100.0% (16)Foreign-born:
98.3% (55)
Asian - Speak another language Native:
97.1% (22)Foreign-born:
89.2% (198)
Other race - Speak only English Native:
37.7% (155)Foreign-born:
10.7% (212)
Other race - Speak another language Native:
62.4% (257)Foreign-born:
89.2% (1,761)
Two or more races - Speak only English Native:
22.4% (925)Foreign-born:
1.5% (175)
Two or more races - Speak another language Native:
77.5% (3,193)Foreign-born:
98.1% (11,787)
White alone - Speak only English Native:
74.6% (1,054)Foreign-born:
50.6% (161)
White alone - Speak another language Native:
25.3% (358)Foreign-born:
55.3% (176)
Hispanic or Latino - Speak only English Native:
17.0% (1,039)Foreign-born:
2.5% (376)
Hispanic or Latino - Speak another language Native:
83.0% (5,078)Foreign-born:
97.4% (14,489)
Foreign-born residents in Coral Terrace 15,589 residents are foreign born (60.4% Latin America ).
This city:
63.7%Florida:
21.1%
Marital status for residents in Coral Terrace Marital status - White (Caucasian) population 15 years and over
Males 30.6% Never married54.4% Now married0.8% Separated3.8% Widowed10.4% DivorcedFemales 22.2% Never married50.9% Now married3.3% Separated11.8% Widowed11.9% DivorcedWomen who gave birth in the past 12 months Now married:
71.2% (28)Unmarried:
28.8% (11)
Women who did not give birth in the past 12 months Now married:
54.6% (664)Unmarried:
45.4% (552)
Marital status - Black or African American population 15 years and over
Males 80.7% Never married11.9% Now married4.5% Separated0.0% Widowed2.8% DivorcedFemales 75.0% Never married16.7% Now married0.0% Separated8.3% Widowed0.0% DivorcedWomen who did not give birth in the past 12 months Now married:
0.0% (0)Unmarried:
100.0% (26)
Marital status - American Indian / Alaska Native population 15 years and over
Males 40.0% Never married60.0% Now married0.0% Separated0.0% Widowed0.0% DivorcedFemales 0.0% Never married100.0% Now married0.0% Separated0.0% Widowed0.0% DivorcedMarital status - Asian population 15 years and over
Males 0.0% Never married100.0% Now married0.0% Separated0.0% Widowed0.0% DivorcedFemales 16.3% Never married54.1% Now married0.0% Separated29.7% Widowed0.0% DivorcedWomen who did not give birth in the past 12 months Now married:
63.6% (51)Unmarried:
36.4% (29)
Marital status - Other race population 15 years and over
Males 22.2% Never married36.5% Now married4.7% Separated10.2% Widowed26.3% DivorcedFemales 15.1% Never married35.3% Now married0.0% Separated17.5% Widowed32.1% DivorcedWomen who gave birth in the past 12 months Now married:
0.0% (0)Unmarried:
100.0% (63)
Women who did not give birth in the past 12 months Now married:
67.1% (210)Unmarried:
32.9% (103)
Marital status - Two or more races population 15 years and over
Males 38.0% Never married45.9% Now married1.5% Separated2.4% Widowed12.2% DivorcedFemales 31.9% Never married36.6% Now married1.7% Separated14.3% Widowed15.6% DivorcedWomen who gave birth in the past 12 months Now married:
10.9% (19)Unmarried:
89.1% (156)
Women who did not give birth in the past 12 months Now married:
35.4% (1,169)Unmarried:
64.6% (2,134)
Marital status - White alone, not Hispanic / Latino population 15 years and over
Males 37.8% Never married50.8% Now married1.0% Separated3.5% Widowed6.9% DivorcedFemales 26.2% Never married50.9% Now married0.0% Separated11.5% Widowed11.5% DivorcedWomen who did not give birth in the past 12 months Now married:
51.6% (214)Unmarried:
48.4% (200)
Marital status - Hispanic or Latino population 15 years and over
Males 32.5% Never married49.8% Now married1.4% Separated3.7% Widowed12.6% DivorcedFemales 25.9% Never married42.7% Now married2.4% Separated13.6% Widowed15.4% DivorcedWomen who gave birth in the past 12 months Now married:
28.1% (62)Unmarried:
71.9% (160)
Women who did not give birth in the past 12 months Now married:
46.1% (1,827)Unmarried:
53.9% (2,135)
Ancestries in Coral Terrace
365 2.1% American119 0.7% Brazilian117 0.7% Italian70 0.4% English57 0.3% German55 0.3% Turkish54 0.3% British47 0.3% Greek28 0.2% Lebanese21 0.1% Irish21 0.1% African20 0.1% French Canadian20 0.1% Polish20 0.1% Ukrainian17 0.10% European14 0.08% Jamaican12 0.07% Egyptian12 0.07% French12 0.07% Romanian8 0.05% Portuguese7 0.04% Haitian6 0.03% Canadian5 0.03% Serbian
Geographical mobility in Coral Terrace Same house 1 year ago 5,984 88.6% White (Caucasian)112 53.7% Black or African American74 100.0% American Indian / Alaska Native276 99.9% Asian2,207 90.1% Other race15,397 92.8% Two or more races1,610 88.0% White alone, not Hispanic / Latino20,006 91.5% Hispanic or LatinoMoved within same county 483 7.1% White / Caucasian34 16.5% Black or African American9 3.3% Asian93 3.8% Other race876 5.3% Two or more races172 9.4% White alone, not Hispanic / Latino1,167 5.3% Hispanic or LatinoMoved within same state 11 0.2% White / Caucasian45 21.5% Black or African American82 0.5% Two or more races13 0.7% White alone, not Hispanic / Latino45 0.2% Hispanic or LatinoMoved from different state 98 1.4% White / Caucasian3 1.3% Black or African American21 1.1% White alone, not Hispanic / Latino79 0.4% Hispanic or LatinoMoved from abroad 114 1.7% White254 10.4% Other race138 0.8% Two or more races572 2.6% Hispanic or Latino
Children Nativity (place of birth) in Coral Terrace
Children under 6 years - Living with two parents Both parents native 311 100.0% NativeBoth parents foreign-born 400 84.7% Native72 15.3% Foreign-bornOne native, one foreign-born parent 214 100.0% NativeChildren under 6 years - Living with one parent Native parent 31 100.0% NativeForeign-born parent 328 100.0% NativeChildren 6 to 17 years - Living with two parents Both parents native 351 100.0% NativeBoth parents foreign-born 530 59.1% Native366 40.9% Foreign-bornOne native, one foreign-born parent 263 90.9% Native26 9.1% Foreign-bornChildren 6 to 17 years - Living with one parent Native parent 6 100.0% Foreign-bornForeign-born parent 876 66.4% Native444 33.6% Foreign-born
Grandparents responsible for own grandchildren in Coral Terrace
Grandparents (30 to 59 years) White / Caucasian 61 100.0% Not responsible for grandchildrenTwo or more races 64 59.8% Responsible for grandchildren43 40.2% Not responsible for grandchildrenHispanic or Latino 34 22.6% Responsible for grandchildren117 77.4% Not responsible for grandchildrenGrandparents (60 years and over) White / Caucasian 46 27.2% Responsible for grandchildren124 72.8% Not responsible for grandchildrenTwo or more races 18 3.0% Responsible for grandchildren596 97.0% Not responsible for grandchildrenHispanic or Latino 107 19.2% Responsible for grandchildren451 80.8% Not responsible for grandchildren