Races in Coral Springs, Florida (FL) Detailed Stats
Data:
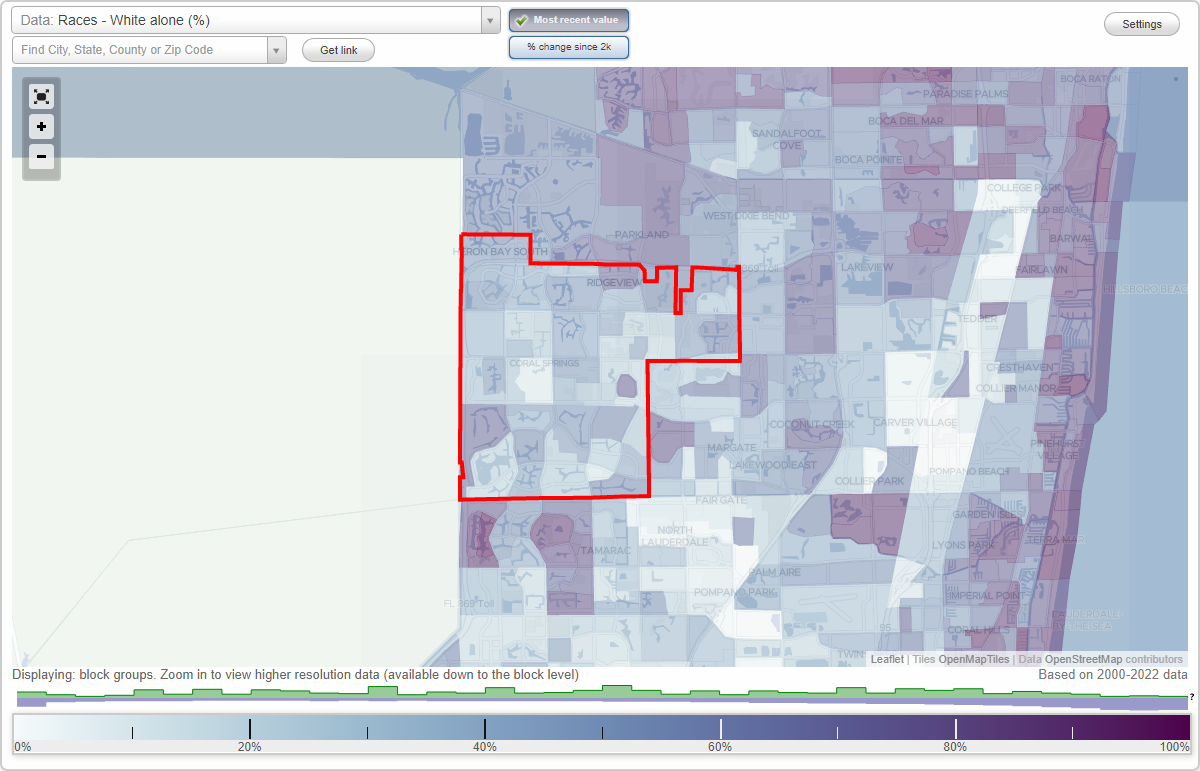
Races - White alone (%)
Races - White alone (% change since 2000)
Races - Black alone (%)
Races - Black alone (% change since 2000)
Races - American Indian alone (%)
Races - American Indian alone (% change since 2000)
Races - Asian alone (%)
Races - Asian alone (% change since 2000)
Races - Hispanic (%)
Races - Hispanic (% change since 2000)
Races - Native Hawaiian and Other Pacific Islander alone (%)
Races - Native Hawaiian and Other Pacific Islander alone (% change since 2000)
Races - Two or more races(%)
Races - Two or more races(% change since 2000)
Races - Other race alone (%)
Races - Other race alone (% change since 2000)
Racial diversity
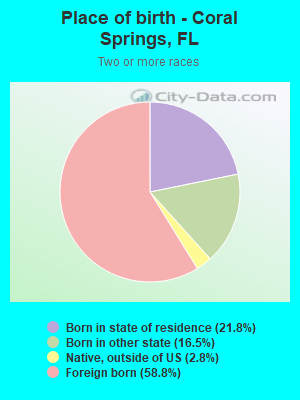
Place of birth - Born in state of residence (%)
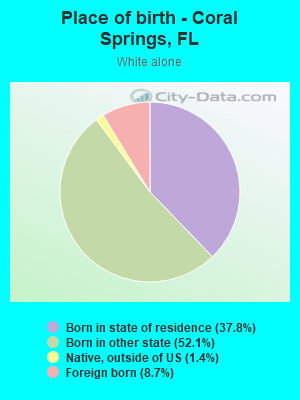
Place of birth - Born in state of residence (%) - White
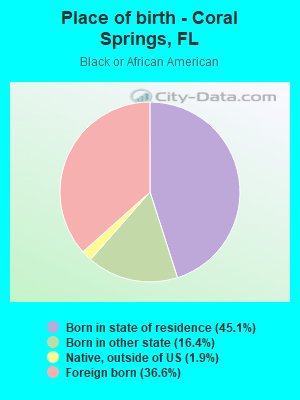
Place of birth - Born in state of residence (%) - Black or African American
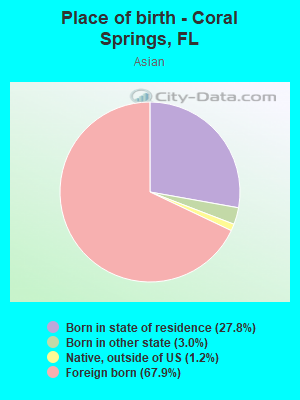
Place of birth - Born in state of residence (%) - Asian
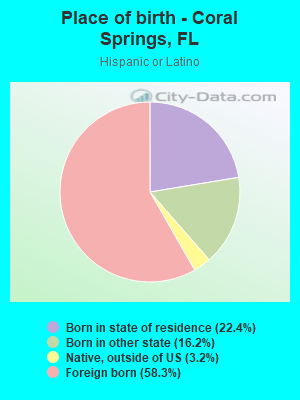
Place of birth - Born in state of residence (%) - Hispanic or Latino
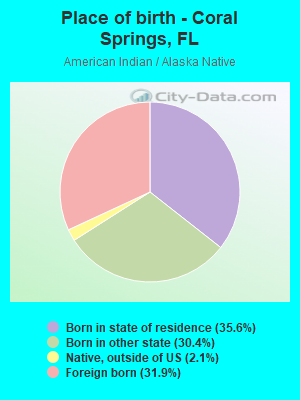
Place of birth - Born in state of residence (%) - American Indian and Alaska Native
Place of birth - Born in state of residence (%) - Multirace
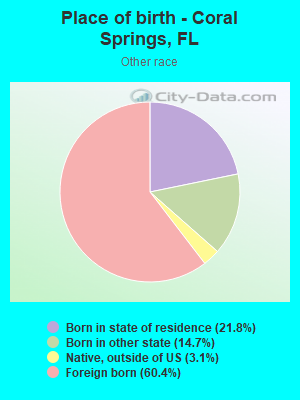
Place of birth - Born in state of residence (%) - Other Race
Place of birth - Born in other state (%)
Place of birth - Born in other state (%) - White
Place of birth - Born in other state (%) - Black or African American
Place of birth - Born in other state (%) - Asian
Place of birth - Born in other state (%) - Hispanic or Latino
Place of birth - Born in other state (%) - American Indian and Alaska Native
Place of birth - Born in other state (%) - Multirace
Place of birth - Born in other state (%) - Other Race
Place of birth - Native, outside of US (%)
Place of birth - Native, outside of US (%) - White
Place of birth - Native, outside of US (%) - Black or African American
Place of birth - Native, outside of US (%) - Asian
Place of birth - Native, outside of US (%) - Hispanic or Latino
Place of birth - Native, outside of US (%) - American Indian and Alaska Native
Place of birth - Native, outside of US (%) - Multirace
Place of birth - Native, outside of US (%) - Other Race
Place of birth - Foreign born (%)
Place of birth - Foreign born (%) - White
Place of birth - Foreign born (%) - Black or African American
Place of birth - Foreign born (%) - Asian
Place of birth - Foreign born (%) - Hispanic or Latino
Place of birth - Foreign born (%) - American Indian and Alaska Native
Place of birth - Foreign born (%) - Multirace
Place of birth - Foreign born (%) - Other Race
Residents speaking English at home (%)
Residents speaking English at home - Born in the United States (%)
Residents speaking English at home - Native, born elsewhere (%)
Residents speaking English at home - Foreign born (%)
Residents speaking Spanish at home (%)
Residents speaking Spanish at home - Born in the United States (%)
Residents speaking Spanish at home - Native, born elsewhere (%)
Residents speaking Spanish at home - Foreign born (%)
Residents speaking other language at home (%)
Residents speaking other language at home - Born in the United States (%)
Residents speaking other language at home - Native, born elsewhere (%)
Residents speaking other language at home - Foreign born (%)
Marital status - Never married (%)
Marital status - Now married (%)
Marital status - Separated (%)
Marital status - Widowed (%)
Marital status - Divorced (%)
Ancestries Reported - Arab (%)
Ancestries Reported - Czech (%)
Ancestries Reported - Danish (%)
Ancestries Reported - Dutch (%)
Ancestries Reported - English (%)
Ancestries Reported - French (%)
Ancestries Reported - French Canadian (%)
Ancestries Reported - German (%)
Ancestries Reported - Greek (%)
Ancestries Reported - Hungarian (%)
Ancestries Reported - Irish (%)
Ancestries Reported - Italian (%)
Ancestries Reported - Lithuanian (%)
Ancestries Reported - Norwegian (%)
Ancestries Reported - Polish (%)
Ancestries Reported - Portuguese (%)
Ancestries Reported - Russian (%)
Ancestries Reported - Scotch-Irish (%)
Ancestries Reported - Scottish (%)
Ancestries Reported - Slovak (%)
Ancestries Reported - Subsaharan African (%)
Ancestries Reported - Swedish (%)
Ancestries Reported - Swiss (%)
Ancestries Reported - Ukrainian (%)
Ancestries Reported - United States (%)
Ancestries Reported - Welsh (%)
Ancestries Reported - West Indian (%)
Ancestries Reported - Other (%)
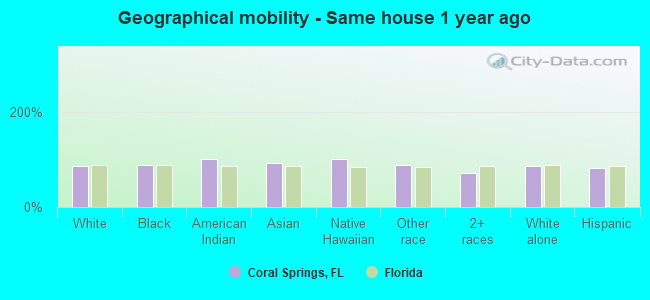
Geographical mobility - Same house 1 year ago (%)
Geographical mobility - Same house 1 year ago (%) - White
Geographical mobility - Same house 1 year ago (%) - Black or African American
Geographical mobility - Same house 1 year ago (%) - Asian
Geographical mobility - Same house 1 year ago (%) - Hispanic or Latino
Geographical mobility - Same house 1 year ago (%) - American Indian and Alaska Native
Geographical mobility - Same house 1 year ago (%) - Multirace
Geographical mobility - Same house 1 year ago (%) - Other Race
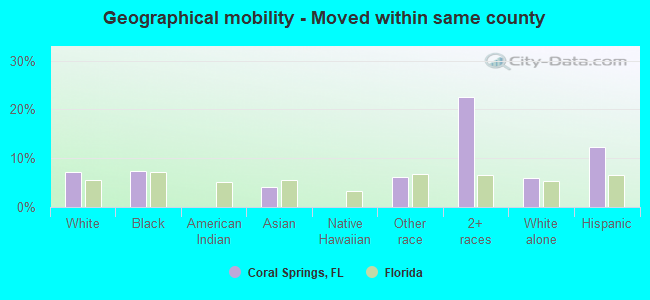
Geographical mobility - Moved within same county (%)
Geographical mobility - Moved within same county (%) - White
Geographical mobility - Moved within same county (%) - Black or African American
Geographical mobility - Moved within same county (%) - Asian
Geographical mobility - Moved within same county (%) - Hispanic or Latino
Geographical mobility - Moved within same county (%) - American Indian and Alaska Native
Geographical mobility - Moved within same county (%) - Multirace
Geographical mobility - Moved within same county (%) - Other Race
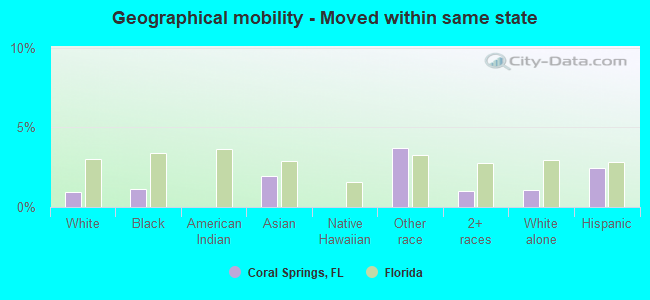
Geographical mobility - Moved from different county within same state (%)
Geographical mobility - Moved from different county within same state (%) - White
Geographical mobility - Moved from different county within same state (%) - Black or African American
Geographical mobility - Moved from different county within same state (%) - Asian
Geographical mobility - Moved from different county within same state (%) - Hispanic or Latino
Geographical mobility - Moved from different county within same state (%) - American Indian and Alaska Native
Geographical mobility - Moved from different county within same state (%) - Multirace
Geographical mobility - Moved from different county within same state (%) - Other Race
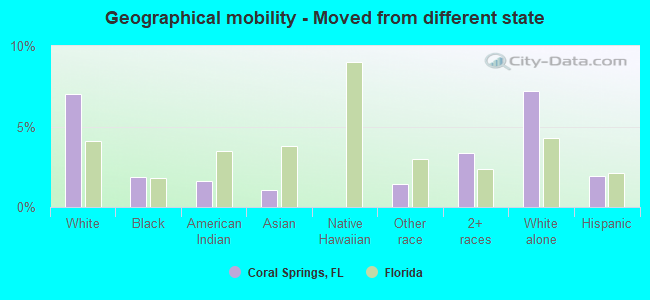
Geographical mobility - Moved from different state (%)
Geographical mobility - Moved from different state (%) - White
Geographical mobility - Moved from different state (%) - Black or African American
Geographical mobility - Moved from different state (%) - Asian
Geographical mobility - Moved from different state (%) - Hispanic or Latino
Geographical mobility - Moved from different state (%) - American Indian and Alaska Native
Geographical mobility - Moved from different state (%) - Multirace
Geographical mobility - Moved from different state (%) - Other Race
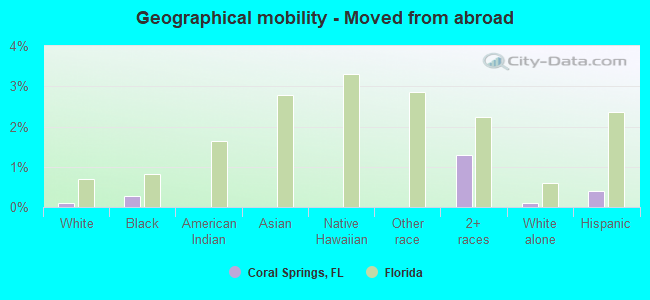
Geographical mobility - Moved from abroad (%)
Geographical mobility - Moved from abroad (%) - White
Geographical mobility - Moved from abroad (%) - Black or African American
Geographical mobility - Moved from abroad (%) - Asian
Geographical mobility - Moved from abroad (%) - Hispanic or Latino
Geographical mobility - Moved from abroad (%) - American Indian and Alaska Native
Geographical mobility - Moved from abroad (%) - Multirace
Geographical mobility - Moved from abroad (%) - Other Race
Place of birth for the foreign-born population - Ireland (%)
Place of birth for the foreign-born population - Denmark (%)
Place of birth for the foreign-born population - Norway (%)
Place of birth for the foreign-born population - Sweden (%)
Place of birth for the foreign-born population - United Kingdom (%)
Place of birth for the foreign-born population - England (%)
Place of birth for the foreign-born population - Scotland (%)
Place of birth for the foreign-born population - Other Northern Europe (%)
Place of birth for the foreign-born population - Austria (%)
Place of birth for the foreign-born population - Belgium (%)
Place of birth for the foreign-born population - France (%)
Place of birth for the foreign-born population - Germany (%)
Place of birth for the foreign-born population - Netherlands (%)
Place of birth for the foreign-born population - Switzerland (%)
Place of birth for the foreign-born population - Other Western Europe (%)
Place of birth for the foreign-born population - Greece (%)
Place of birth for the foreign-born population - Italy (%)
Place of birth for the foreign-born population - Portugal (%)
Place of birth for the foreign-born population - Spain (%)
Place of birth for the foreign-born population - Other Southern Europe (%)
Place of birth for the foreign-born population - Albania (%)
Place of birth for the foreign-born population - Belarus (%)
Place of birth for the foreign-born population - Bosnia and Herzegovina (%)
Place of birth for the foreign-born population - Bulgaria (%)
Place of birth for the foreign-born population - Croatia (%)
Place of birth for the foreign-born population - Czechoslovakia (%)
Place of birth for the foreign-born population - Hungary (%)
Place of birth for the foreign-born population - Latvia (%)
Place of birth for the foreign-born population - Lithuania (%)
Place of birth for the foreign-born population - North Macedonia (Macedonia) (%)
Place of birth for the foreign-born population - Moldova (%)
Place of birth for the foreign-born population - Poland (%)
Place of birth for the foreign-born population - Romania (%)
Place of birth for the foreign-born population - Russia (%)
Place of birth for the foreign-born population - Serbia (%)
Place of birth for the foreign-born population - Ukraine (%)
Place of birth for the foreign-born population - Other Eastern Europe (%)
Place of birth for the foreign-born population - China (%)
Place of birth for the foreign-born population - Hong Kong (%)
Place of birth for the foreign-born population - Taiwan (%)
Place of birth for the foreign-born population - Japan (%)
Place of birth for the foreign-born population - Korea (%)
Place of birth for the foreign-born population - Other Eastern Asia (%)
Place of birth for the foreign-born population - Afghanistan (%)
Place of birth for the foreign-born population - Bangladesh (%)
Place of birth for the foreign-born population - India (%)
Place of birth for the foreign-born population - Iran (%)
Place of birth for the foreign-born population - Kazakhstan (%)
Place of birth for the foreign-born population - Nepal (%)
Place of birth for the foreign-born population - Pakistan (%)
Place of birth for the foreign-born population - Sri Lanka (%)
Place of birth for the foreign-born population - Uzbekistan (%)
Place of birth for the foreign-born population - Other South Central Asia (%)
Place of birth for the foreign-born population - Burma (%)
Place of birth for the foreign-born population - Cambodia (%)
Place of birth for the foreign-born population - Indonesia (%)
Place of birth for the foreign-born population - Laos (%)
Place of birth for the foreign-born population - Malaysia (%)
Place of birth for the foreign-born population - Philippines (%)
Place of birth for the foreign-born population - Singapore (%)
Place of birth for the foreign-born population - Thailand (%)
Place of birth for the foreign-born population - Vietnam (%)
Place of birth for the foreign-born population - Other South Eastern Asia (%)
Place of birth for the foreign-born population - Armenia (%)
Place of birth for the foreign-born population - Iraq (%)
Place of birth for the foreign-born population - Israel (%)
Place of birth for the foreign-born population - Jordan (%)
Place of birth for the foreign-born population - Kuwait (%)
Place of birth for the foreign-born population - Lebanon (%)
Place of birth for the foreign-born population - Saudi Arabia (%)
Place of birth for the foreign-born population - Syria (%)
Place of birth for the foreign-born population - Turkey (%)
Place of birth for the foreign-born population - Yemen (%)
Place of birth for the foreign-born population - Other Western Asia (%)
Place of birth for the foreign-born population - Eritrea (%)
Place of birth for the foreign-born population - Ethiopia (%)
Place of birth for the foreign-born population - Kenya (%)
Place of birth for the foreign-born population - Somalia (%)
Place of birth for the foreign-born population - Uganda (%)
Place of birth for the foreign-born population - Zimbabwe (%)
Place of birth for the foreign-born population - Other Eastern Africa (%)
Place of birth for the foreign-born population - Cameroon (%)
Place of birth for the foreign-born population - Congo (%)
Place of birth for the foreign-born population - Democratic Republic of Congo (Zaire) (%)
Place of birth for the foreign-born population - Other Middle Africa (%)
Place of birth for the foreign-born population - Egypt (%)
Place of birth for the foreign-born population - Morocco (%)
Place of birth for the foreign-born population - Sudan (%)
Place of birth for the foreign-born population - Other Northern Africa (%)
Place of birth for the foreign-born population - South Africa (%)
Place of birth for the foreign-born population - Other Southern Africa (%)
Place of birth for the foreign-born population - Cabo Verde (%)
Place of birth for the foreign-born population - Ghana (%)
Place of birth for the foreign-born population - Liberia (%)
Place of birth for the foreign-born population - Nigeria (%)
Place of birth for the foreign-born population - Senegal (%)
Place of birth for the foreign-born population - Sierra Leone (%)
Place of birth for the foreign-born population - Other Western Africa (%)
Place of birth for the foreign-born population - Australia (%)
Place of birth for the foreign-born population - New Zealand (%)
Place of birth for the foreign-born population - Fiji (%)
Place of birth for the foreign-born population - Micronesia (%)
Place of birth for the foreign-born population - Bahamas (%)
Place of birth for the foreign-born population - Barbados (%)
Place of birth for the foreign-born population - Cuba (%)
Place of birth for the foreign-born population - Dominica (%)
Place of birth for the foreign-born population - Dominican Republic (%)
Place of birth for the foreign-born population - Grenada (%)
Place of birth for the foreign-born population - Haiti (%)
Place of birth for the foreign-born population - Jamaica (%)
Place of birth for the foreign-born population - St. Vincent and the Grenadines (%)
Place of birth for the foreign-born population - Trinidad and Tobago (%)
Place of birth for the foreign-born population - West Indies (%)
Place of birth for the foreign-born population - Other Caribbean (%)
Place of birth for the foreign-born population - Belize (%)
Place of birth for the foreign-born population - Costa Rica (%)
Place of birth for the foreign-born population - El Salvador (%)
Place of birth for the foreign-born population - Guatemala (%)
Place of birth for the foreign-born population - Honduras (%)
Place of birth for the foreign-born population - Mexico (%)
Place of birth for the foreign-born population - Nicaragua (%)
Place of birth for the foreign-born population - Panama (%)
Place of birth for the foreign-born population - Other Central America (%)
Place of birth for the foreign-born population - Argentina (%)
Place of birth for the foreign-born population - Bolivia (%)
Place of birth for the foreign-born population - Brazil (%)
Place of birth for the foreign-born population - Chile (%)
Place of birth for the foreign-born population - Colombia (%)
Place of birth for the foreign-born population - Ecuador (%)
Place of birth for the foreign-born population - Guyana (%)
Place of birth for the foreign-born population - Peru (%)
Place of birth for the foreign-born population - Uruguay (%)
Place of birth for the foreign-born population - Venezuela (%)
Place of birth for the foreign-born population - Other South America (%)
Place of birth for the foreign-born population - Canada (%)
Place of birth for the foreign-born population - Other Northern America (%)
Place of birth for the foreign-born population - Other (%)
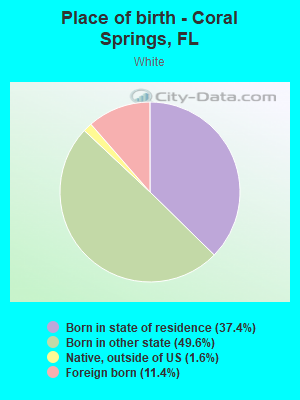
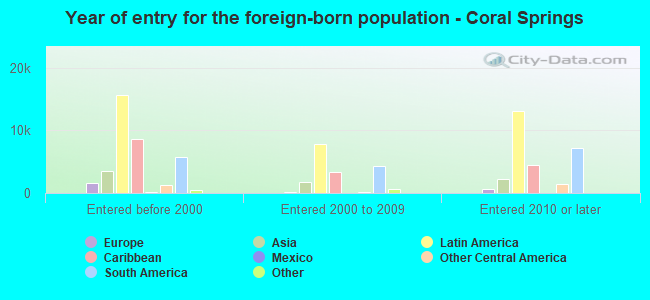
According to 2022 data, the most numerous races in Coral Springs, FL are White alone (45,405 residents), Hispanic (37,475 residents), and Black alone (32,080 residents). 61.3% of Coral Springs residents speak English at home. 32.3% of Coral Springs, FL residents are foreign-born (24.1% born in Latin America, 3.7% born in Asia), which is 34.9% greater than the foreign-born rate of 21.0% across the entire state of Florida.
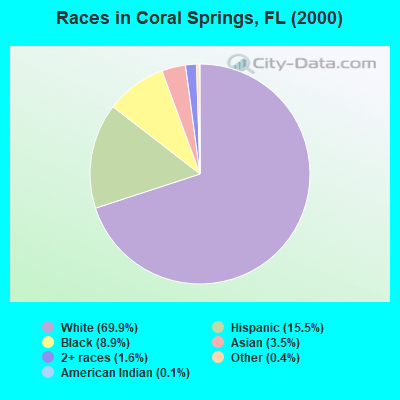
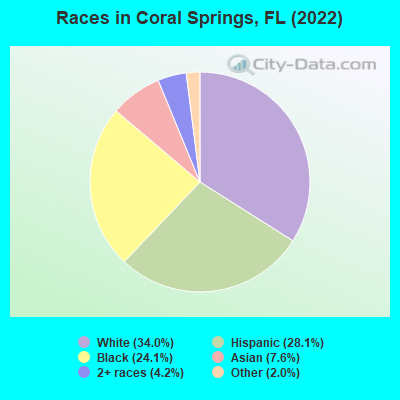
Race distribution in Coral Springs
2000 2022
82,149 69.9% White alone 18,233 15.5% Hispanic 10,412 8.9% Black alone 4,117 3.5% Asian alone 1,917 1.6% Two or more races 495 0.4% Other race alone 147 0.1% American Indian alone 79 0.07% Native Hawaiian and Other
45,405 34.0% White alone 37,475 28.1% Hispanic 32,080 24.1% Black alone 10,119 7.6% Asian alone 5,622 4.2% Two or more races 2,664 2.0% Other race alone
2000 2022
10,458,509 65.4% White alone 2,682,715 16.8% Hispanic 2,264,268 14.2% Black alone 261,693 1.6% Asian alone 236,954 1.5% Two or more races 42,358 0.3% American Indian alone 28,994 0.2% Other race alone 6,887 0.04% Native Hawaiian and Other
11,309,403 50.8% White alone 6,025,039 27.1% Hispanic 3,241,015 14.6% Black alone 861,630 3.9% Two or more races 623,692 2.8% Asian alone 152,054 0.7% Other race alone 22,504 0.1% American Indian alone 9,486 0.04% Native Hawaiian and Other
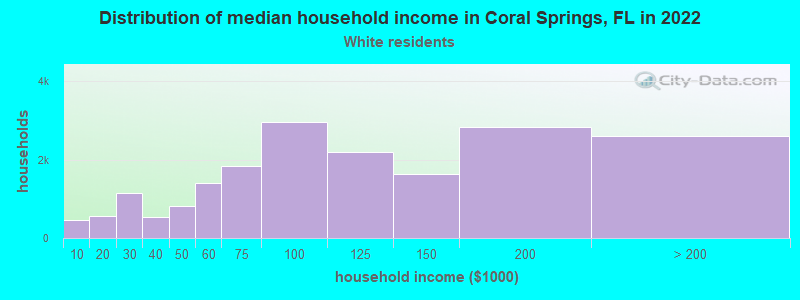
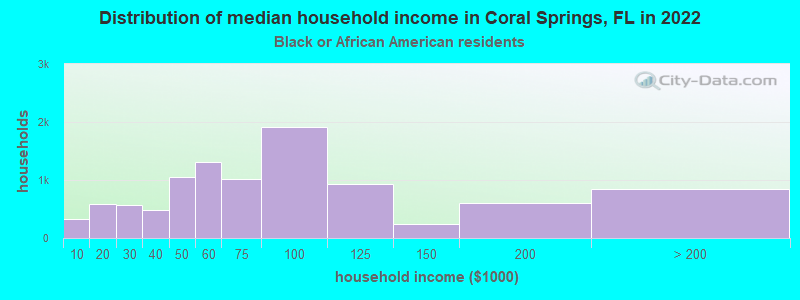
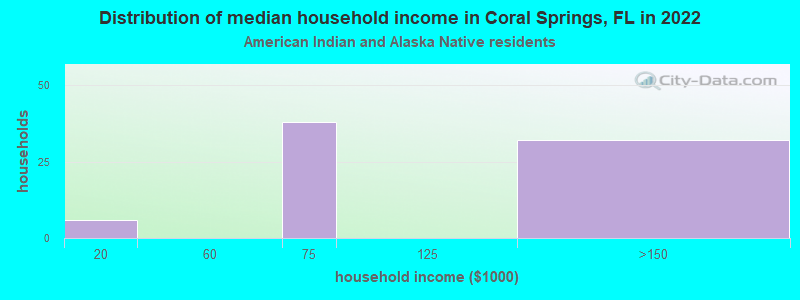
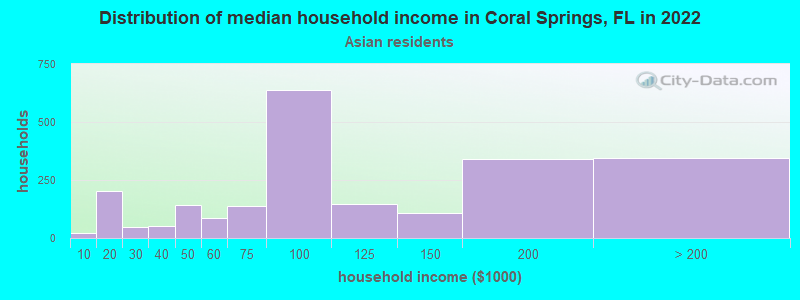
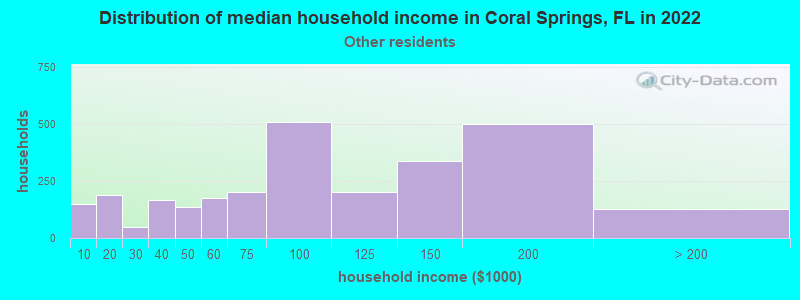
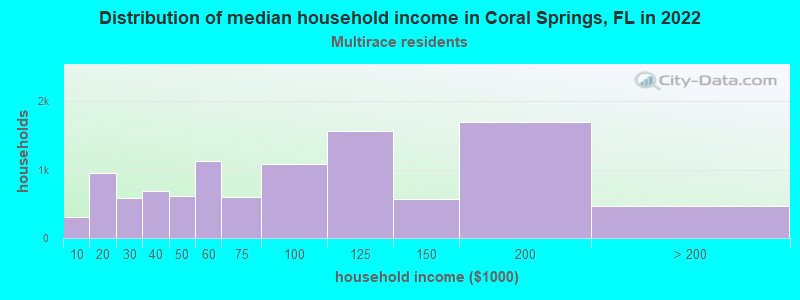
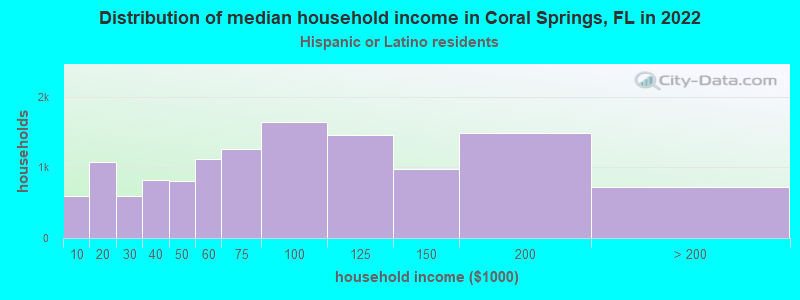
Income and house value in Coral Springs Median household income in 2022 $105,080 White non-Hispanic householders$72,212 Black householders$103,596 Asian householders$57,515 Some other race householders$84,058 Two or more races householders$78,636 Hispanic or Latino race householdersMedian 2022 house value $595,084 White Non-Hispanic householders$553,428 Black or African American householdersover $1,000,000 American Indian or Alaska Native householders $519,706 Asian householders$521,360 Some other race householders$534,914 Two or more races householders$528,633 Hispanic or Latino householders
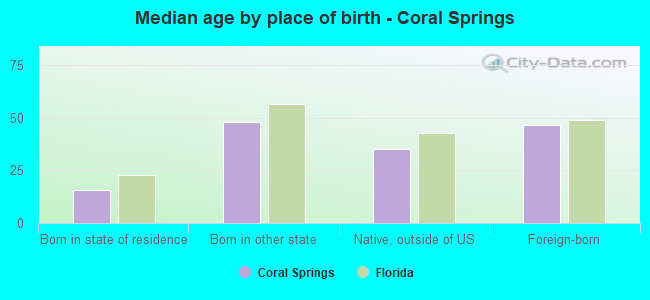
Median age by race in Coral Springs
42.8 Median age for White residents40.1 44.5 28.1 Median age for Black or African American residents26.7 28.7 -666,666,666.0 Median age for American Indian / Alaska Native residents-666,666,666.0 -666,666,666.0 37.9 Median age for Asian residents35.8 39.0 -666,666,666.0 Median age for Native Hawaiian / Pacific Islander residents-666,666,666.0 -666,666,666.0 42.0 Median age for Other race residents37.8 45.1 35.4 Median age for Two or more races residents34.5 35.7 44.4 Median age for White alone residents43.0 47.3 35.4 Median age for Hispanic or Latino residents35.7 35.3
Owner/renter occupied households by race in Coral Springs
House owners and renters - White residents 11,821 62.0% Owner occupied7,232 38.0% Renter occupiedHouse owners and renters - Black or African American residents 3,478 35.2% Owner occupied6,407 64.8% Renter occupiedHouse owners and renters - American Indian / Alaska Native residents 29 49.7% Owner occupied30 50.3% Renter occupiedHouse owners and renters - Asian residents 2,480 92.2% Owner occupied211 7.8% Renter occupiedHouse owners and renters - Other race residents 938 32.6% Owner occupied1,935 67.4% Renter occupiedHouse owners and renters - Two or more races residents 4,800 46.8% Owner occupied5,453 53.2% Renter occupiedHouse owners and renters - White alone residents 10,791 64.1% Owner occupied6,039 35.9% Renter occupiedHouse owners and renters - Hispanic or Latino residents 5,565 44.3% Owner occupied6,987 55.7% Renter occupied
Language usage in Coral Springs
English speakers - Total 61.3% of residents of Coral Springs speak English at home.
23.3% of residents speak Spanish at home 16,504 57.3% Speak English very well12,310 42.7% Speak English less than very well15.4% of residents speak other language at home 13,933 73.1% Speak English very well5,136 26.9% Speak English less than very well
English speakers - Born in the United States 83.8% of residents of Coral Springs speak English at home.
12.2% of residents speak Spanish at home 3,784 85.5% Speak English very well641 14.5% Speak English less than very well4.1% of residents speak other language at home 1,482 100.0% Speak English very well
English speakers - Native, born elsewhere 55.7% of residents of Coral Springs speak English at home.
38.7% of residents speak Spanish at home 716 72.6% Speak English very well270 27.4% Speak English less than very well5.6% of residents speak other language at home 142 100.0% Speak English very well
English speakers - Foreign-born 28.2% of residents of Coral Springs speak English at home.
42.9% of residents speak Spanish at home 9,367 46.2% Speak English very well10,896 53.8% Speak English less than very well28.9% of residents speak other language at home 8,628 63.1% Speak English very well5,037 36.9% Speak English less than very well
White (Caucasian) - Speak only English Native:
87.8% (36,769)Foreign-born:
31.7% (1,856)
White (Caucasian) - Speak another language Native:
12.2% (5,113)Foreign-born:
68.3% (3,992)
Black or African American - Speak only English Native:
87.1% (15,934)Foreign-born:
65.3% (7,960)
Black or African American - Speak another language Native:
12.9% (2,362)Foreign-born:
34.7% (4,230)
American Indian / Alaska Native - Speak another language Native:
68.8% (70)Foreign-born:
97.0% (53)
Asian - Speak only English Native:
80.0% (2,101)Foreign-born:
7.2% (512)
Asian - Speak another language Native:
20.0% (526)Foreign-born:
92.8% (6,558)
Other race - Speak only English Native:
63.9% (2,108)Foreign-born:
25.7% (1,385)
Other race - Speak another language Native:
36.1% (1,190)Foreign-born:
74.3% (4,001)
Two or more races - Speak only English Native:
53.7% (5,531)Foreign-born:
9.7% (1,634)
Two or more races - Speak another language Native:
46.3% (4,764)Foreign-born:
90.3% (15,147)
White alone - Speak only English Native:
90.8% (35,336)Foreign-born:
46.9% (1,856)
White alone - Speak another language Native:
9.2% (3,586)Foreign-born:
53.1% (2,103)
Hispanic or Latino - Speak only English Native:
42.6% (5,438)Foreign-born:
7.1% (1,534)
Hispanic or Latino - Speak another language Native:
57.4% (7,334)Foreign-born:
92.9% (19,987)
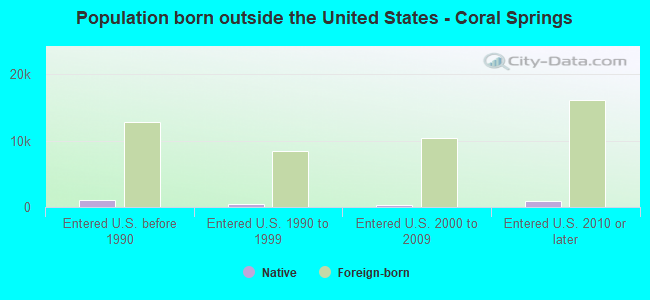
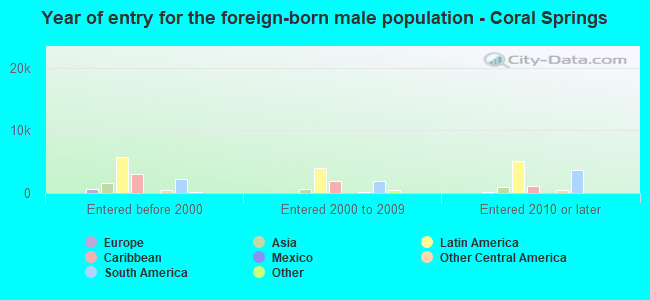
Foreign-born residents in Coral Springs 43,309 residents are foreign born (24.1% Latin America , 3.7% Asia ).
This city:
32.3%Florida:
21.1%
Marital status for residents in Coral Springs Marital status - White (Caucasian) population 15 years and over
Males 27.2% Never married61.6% Now married1.3% Separated0.4% Widowed9.5% DivorcedFemales 21.0% Never married52.0% Now married2.2% Separated10.2% Widowed14.7% DivorcedWomen who gave birth in the past 12 months Now married:
75.4% (538)Unmarried:
24.6% (176)
Women who did not give birth in the past 12 months Now married:
49.8% (4,233)Unmarried:
50.2% (4,274)
Marital status - Black or African American population 15 years and over
Males 46.0% Never married43.7% Now married4.8% Separated0.0% Widowed5.6% DivorcedFemales 42.2% Never married31.7% Now married3.9% Separated3.1% Widowed19.1% DivorcedWomen who gave birth in the past 12 months Now married:
73.3% (377)Unmarried:
26.7% (137)
Women who did not give birth in the past 12 months Now married:
29.0% (2,748)Unmarried:
71.0% (6,726)
Marital status - American Indian / Alaska Native population 15 years and over
Males 0.0% Never married25.6% Now married0.0% Separated0.0% Widowed74.4% DivorcedFemales 53.3% Never married38.9% Now married0.0% Separated7.8% Widowed0.0% DivorcedWomen who gave birth in the past 12 months Now married:
0.0% (0)Unmarried:
100.0% (43)
Women who did not give birth in the past 12 months Now married:
53.2% (41)Unmarried:
46.8% (36)
Marital status - Asian population 15 years and over
Males 26.7% Never married70.3% Now married0.3% Separated0.6% Widowed2.1% DivorcedFemales 18.7% Never married60.7% Now married2.2% Separated11.5% Widowed6.8% DivorcedWomen who gave birth in the past 12 months Now married:
100.0% (115)Unmarried:
0.0% (0)
Women who did not give birth in the past 12 months Now married:
58.2% (980)Unmarried:
41.8% (704)
Marital status - Other race population 15 years and over
Males 29.7% Never married55.8% Now married3.8% Separated2.6% Widowed8.1% DivorcedFemales 43.3% Never married42.1% Now married1.9% Separated6.1% Widowed6.5% DivorcedWomen who gave birth in the past 12 months Now married:
0.0% (0)Unmarried:
100.0% (31)
Women who did not give birth in the past 12 months Now married:
47.9% (1,302)Unmarried:
52.1% (1,416)
Marital status - Two or more races population 15 years and over
Males 37.8% Never married49.3% Now married6.6% Separated0.3% Widowed6.0% DivorcedFemales 24.5% Never married48.9% Now married5.0% Separated7.1% Widowed14.4% DivorcedWomen who gave birth in the past 12 months Now married:
100.0% (529)Unmarried:
0.0% (0)
Women who did not give birth in the past 12 months Now married:
54.2% (3,348)Unmarried:
45.8% (2,827)
Marital status - White alone, not Hispanic / Latino population 15 years and over
Males 26.4% Never married62.5% Now married1.5% Separated0.5% Widowed9.1% DivorcedFemales 21.3% Never married51.2% Now married2.0% Separated11.3% Widowed14.2% DivorcedWomen who gave birth in the past 12 months Now married:
57.8% (241)Unmarried:
42.2% (176)
Women who did not give birth in the past 12 months Now married:
49.5% (3,652)Unmarried:
50.5% (3,733)
Marital status - Hispanic or Latino population 15 years and over
Males 35.3% Never married54.1% Now married3.3% Separated0.0% Widowed7.3% DivorcedFemales 28.3% Never married50.6% Now married4.2% Separated7.4% Widowed9.6% DivorcedWomen who gave birth in the past 12 months Now married:
93.9% (968)Unmarried:
6.1% (63)
Women who did not give birth in the past 12 months Now married:
54.5% (4,775)Unmarried:
45.5% (3,979)
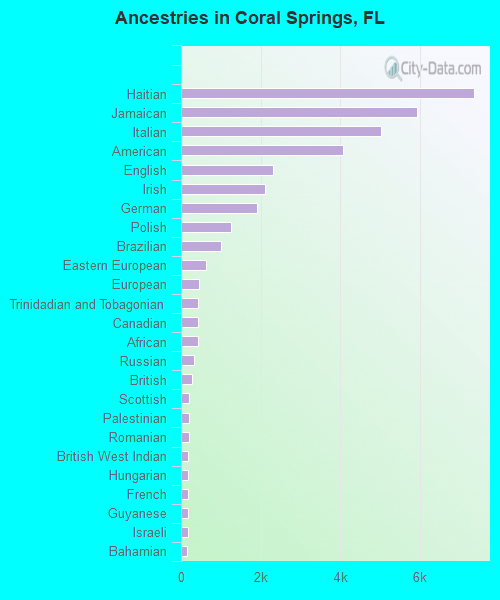
Ancestries in Coral Springs
7,372 9.3% Haitian5,927 7.5% Jamaican5,031 6.3% Italian4,082 5.1% American2,305 2.9% English2,105 2.7% Irish1,906 2.4% German1,254 1.6% Polish1,006 1.3% Brazilian620 0.8% Eastern European454 0.6% European439 0.6% Trinidadian and Tobagonian424 0.5% Canadian415 0.5% African321 0.4% Russian264 0.3% British209 0.3% Scottish198 0.2% Palestinian197 0.2% Romanian186 0.2% British West Indian175 0.2% Hungarian173 0.2% French165 0.2% Guyanese164 0.2% Israeli154 0.2% Bahamian151 0.2% Egyptian151 0.2% Greek150 0.2% Ukrainian137 0.2% Dutch129 0.2% Austrian125 0.2% Iranian123 0.2% Scandinavian116 0.1% Portuguese115 0.1% Nigerian95 0.1% Lebanese94 0.1% Scotch-Irish92 0.1% Swedish74 0.09% West Indian67 0.08% French Canadian61 0.08% Belgian54 0.07% Finnish51 0.06% Northern European47 0.06% South African43 0.05% Barbadian43 0.05% Belizean38 0.05% Lithuanian35 0.04% Ghanaian35 0.04% Danish30 0.04% Norwegian29 0.04% Welsh27 0.03% Czech27 0.03% Armenian24 0.03% Turkish23 0.03% Czechoslovakian21 0.03% Syrian19 0.02% Arab18 0.02% Bulgarian17 0.02% Moroccan17 0.02% Swiss16 0.02% Zimbabwean14 0.02% Slovak
Geographical mobility in Coral Springs Same house 1 year ago 42,691 84.8% White (Caucasian)29,459 89.3% Black or African American228 100.0% American Indian / Alaska Native6,767 92.9% Asian29 100.0% Native Hawaiian / Pacific Islander7,576 89.1% Other race20,882 71.8% Two or more races38,429 85.6% White alone, not Hispanic / Latino33,100 82.4% Hispanic or LatinoMoved within same county 3,592 7.1% White / Caucasian2,451 7.4% Black or African American293 4.0% Asian531 6.3% Other race6,556 22.5% Two or more races2,709 6.0% White alone, not Hispanic / Latino4,901 12.2% Hispanic or LatinoMoved within same state 473 0.9% White / Caucasian371 1.1% Black or African American141 1.9% Asian316 3.7% Other race301 1.0% Two or more races473 1.1% White alone, not Hispanic / Latino983 2.4% Hispanic or LatinoMoved from different state 3,543 7.0% White / Caucasian606 1.8% Black or African American4 1.6% American Indian / Alaska Native76 1.0% Asian121 1.4% Other race973 3.3% Two or more races3,231 7.2% White alone, not Hispanic / Latino777 1.9% Hispanic or LatinoMoved from abroad 49 0.1% White93 0.3% Black or African American378 1.3% Two or more races49 0.1% White alone, not Hispanic / Latino157 0.4% Hispanic or Latino
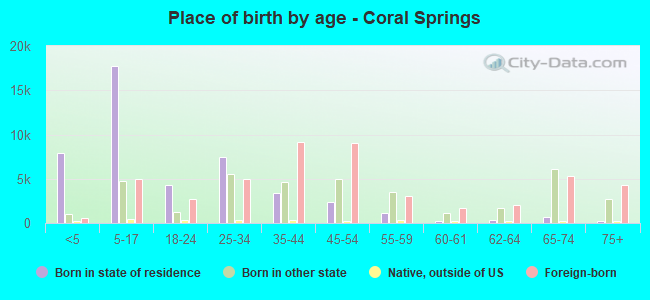
Children Nativity (place of birth) in Coral Springs
Children under 6 years - Living with two parents Both parents native 3,122 100.0% NativeBoth parents foreign-born 1,813 78.6% Native493 21.4% Foreign-bornOne native, one foreign-born parent 1,671 100.0% NativeChildren under 6 years - Living with one parent Native parent 2,964 100.0% NativeForeign-born parent 856 60.6% Native556 39.4% Foreign-bornChildren 6 to 17 years - Living with two parents Both parents native 7,614 100.0% NativeBoth parents foreign-born 4,683 69.2% Native2,086 30.8% Foreign-bornOne native, one foreign-born parent 1,780 65.7% Native930 34.3% Foreign-bornChildren 6 to 17 years - Living with one parent Native parent 2,242 100.0% NativeForeign-born parent 3,126 62.8% Native1,854 37.2% Foreign-born
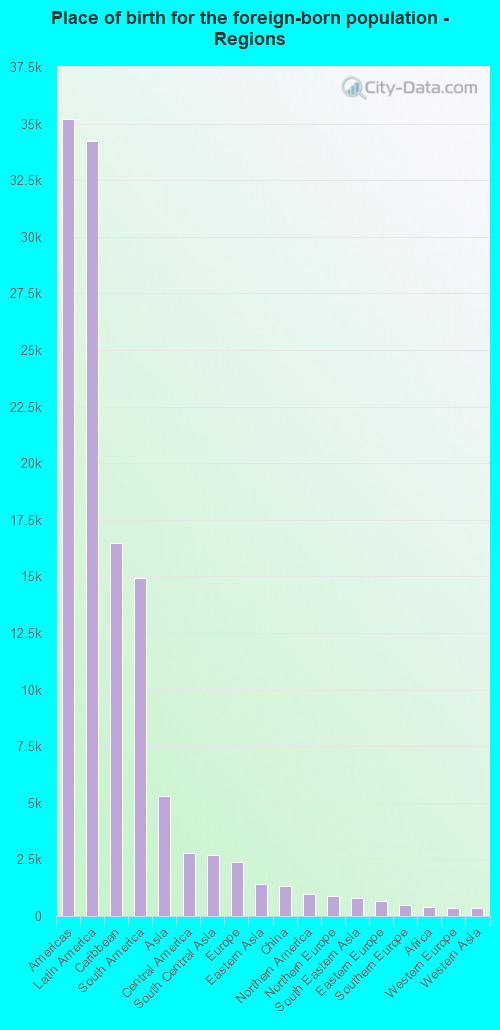
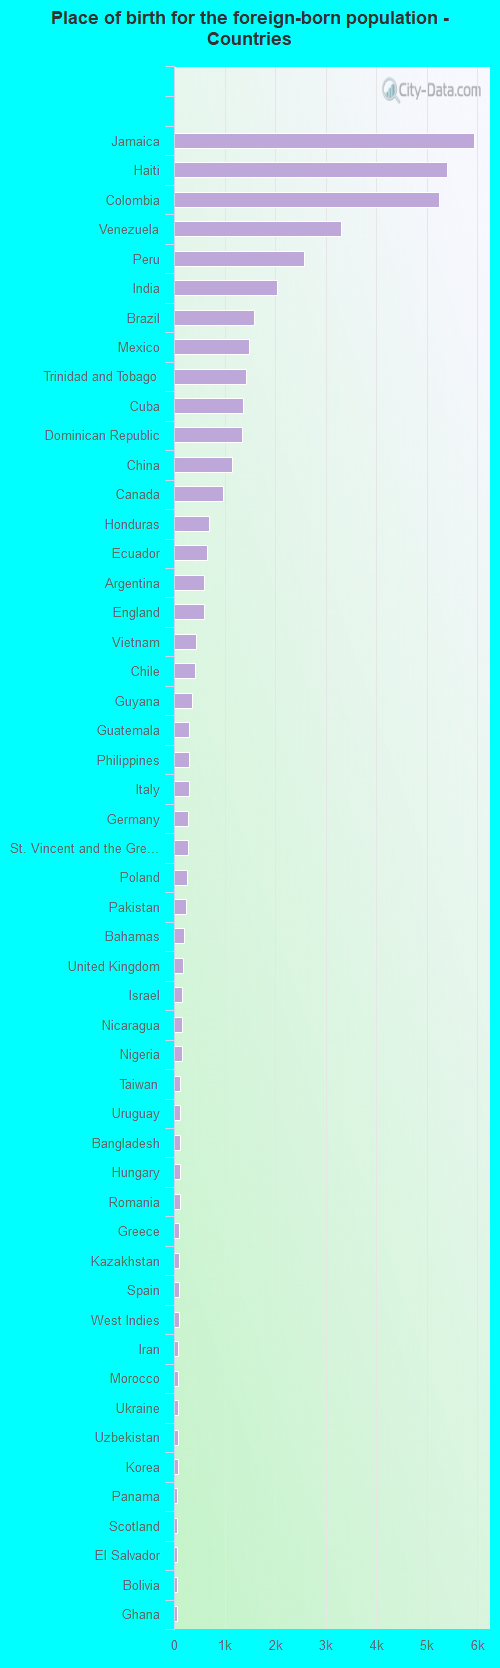
Place of birth for residents in Coral Springs 35,197 Americas34,227 Latin America16,477 Caribbean14,949 South America5,293 Asia2,800 Central America2,679 South Central Asia2,404 Europe1,432 Eastern Asia1,318 China969 Northern America880 Northern Europe811 South Eastern Asia684 Eastern Europe496 Southern Europe409 Africa343 Western Europe335 Western Asia213 Western Africa112 Northern Africa42 Southern Africa28 Eastern Africa11 Middle Africa4 Oceania4 Australia and New Zealand Subregion5,938 Jamaica5,404 Haiti5,238 Colombia3,306 Venezuela2,567 Peru2,029 India1,587 Brazil1,488 Mexico1,421 Trinidad and Tobago1,360 Cuba1,354 Dominican Republic1,139 China969 Canada698 Honduras649 Ecuador594 Argentina593 England426 Vietnam416 Chile360 Guyana304 Guatemala304 Philippines288 Italy282 Germany268 St. Vincent and the Grenadines253 Poland247 Pakistan200 Bahamas170 United Kingdom163 Israel158 Nicaragua157 Nigeria127 Taiwan124 Uruguay116 Bangladesh112 Hungary110 Romania101 Greece97 Kazakhstan97 Spain90 West Indies87 Iran80 Morocco78 Ukraine76 Uzbekistan72 Korea61 Panama60 Scotland59 El Salvador59 Bolivia56 Ghana51 Hong Kong51 Bulgaria46 Thailand42 South Africa41 Jordan41 Japan38 Russia37 Turkey35 Lebanon31 Egypt29 Belize25 Netherlands23 Syria23 Sri Lanka20 Ireland19 Malaysia15 France15 Barbados14 Singapore12 Belgium11 Kuwait11 Iraq10 Tanzania9 Portugal8 Armenia6 Switzerland5 Sweden4 Australia
Grandparents responsible for own grandchildren in Coral Springs
Grandparents (30 to 59 years) White / Caucasian 110 44.4% Responsible for grandchildren138 55.6% Not responsible for grandchildrenBlack or African American 146 25.4% Responsible for grandchildren430 74.6% Not responsible for grandchildrenAsian 347 100.0% Not responsible for grandchildrenOther race 17 43.2% Responsible for grandchildren23 56.8% Not responsible for grandchildrenTwo or more races 193 55.4% Responsible for grandchildren156 44.6% Not responsible for grandchildrenWhite alone, not Hispanic / Latino 140 61.0% Responsible for grandchildren90 39.0% Not responsible for grandchildrenHispanic or Latino 12 5.6% Responsible for grandchildren200 94.4% Not responsible for grandchildrenGrandparents (60 years and over) White / Caucasian 168 22.2% Responsible for grandchildren588 77.8% Not responsible for grandchildrenBlack or African American 143 30.1% Responsible for grandchildren331 69.9% Not responsible for grandchildrenAsian 7 8.9% Responsible for grandchildren74 91.1% Not responsible for grandchildrenOther race 65 56.9% Responsible for grandchildren49 43.1% Not responsible for grandchildrenTwo or more races 237 100.0% Not responsible for grandchildrenWhite alone, not Hispanic / Latino 192 24.0% Responsible for grandchildren608 76.0% Not responsible for grandchildrenHispanic or Latino 42 10.4% Responsible for grandchildren363 89.6% Not responsible for grandchildren