Races in Claremore, Oklahoma (OK) Detailed Stats
Data:
Races - White alone (%)
Races - White alone (% change since 2000)
Races - Black alone (%)
Races - Black alone (% change since 2000)
Races - American Indian alone (%)
Races - American Indian alone (% change since 2000)
Races - Asian alone (%)
Races - Asian alone (% change since 2000)
Races - Hispanic (%)
Races - Hispanic (% change since 2000)
Races - Native Hawaiian and Other Pacific Islander alone (%)
Races - Native Hawaiian and Other Pacific Islander alone (% change since 2000)
Races - Two or more races(%)
Races - Two or more races(% change since 2000)
Races - Other race alone (%)
Races - Other race alone (% change since 2000)
Racial diversity
Place of birth - Born in state of residence (%)
Place of birth - Born in state of residence (%) - White
Place of birth - Born in state of residence (%) - Black or African American
Place of birth - Born in state of residence (%) - Asian
Place of birth - Born in state of residence (%) - Hispanic or Latino
Place of birth - Born in state of residence (%) - American Indian and Alaska Native
Place of birth - Born in state of residence (%) - Multirace
Place of birth - Born in state of residence (%) - Other Race
Place of birth - Born in other state (%)
Place of birth - Born in other state (%) - White
Place of birth - Born in other state (%) - Black or African American
Place of birth - Born in other state (%) - Asian
Place of birth - Born in other state (%) - Hispanic or Latino
Place of birth - Born in other state (%) - American Indian and Alaska Native
Place of birth - Born in other state (%) - Multirace
Place of birth - Born in other state (%) - Other Race
Place of birth - Native, outside of US (%)
Place of birth - Native, outside of US (%) - White
Place of birth - Native, outside of US (%) - Black or African American
Place of birth - Native, outside of US (%) - Asian
Place of birth - Native, outside of US (%) - Hispanic or Latino
Place of birth - Native, outside of US (%) - American Indian and Alaska Native
Place of birth - Native, outside of US (%) - Multirace
Place of birth - Native, outside of US (%) - Other Race
Place of birth - Foreign born (%)
Place of birth - Foreign born (%) - White
Place of birth - Foreign born (%) - Black or African American
Place of birth - Foreign born (%) - Asian
Place of birth - Foreign born (%) - Hispanic or Latino
Place of birth - Foreign born (%) - American Indian and Alaska Native
Place of birth - Foreign born (%) - Multirace
Place of birth - Foreign born (%) - Other Race
Residents speaking English at home (%)
Residents speaking English at home - Born in the United States (%)
Residents speaking English at home - Native, born elsewhere (%)
Residents speaking English at home - Foreign born (%)
Residents speaking Spanish at home (%)
Residents speaking Spanish at home - Born in the United States (%)
Residents speaking Spanish at home - Native, born elsewhere (%)
Residents speaking Spanish at home - Foreign born (%)
Residents speaking other language at home (%)
Residents speaking other language at home - Born in the United States (%)
Residents speaking other language at home - Native, born elsewhere (%)
Residents speaking other language at home - Foreign born (%)
Marital status - Never married (%)
Marital status - Now married (%)
Marital status - Separated (%)
Marital status - Widowed (%)
Marital status - Divorced (%)
Ancestries Reported - Arab (%)
Ancestries Reported - Czech (%)
Ancestries Reported - Danish (%)
Ancestries Reported - Dutch (%)
Ancestries Reported - English (%)
Ancestries Reported - French (%)
Ancestries Reported - French Canadian (%)
Ancestries Reported - German (%)
Ancestries Reported - Greek (%)
Ancestries Reported - Hungarian (%)
Ancestries Reported - Irish (%)
Ancestries Reported - Italian (%)
Ancestries Reported - Lithuanian (%)
Ancestries Reported - Norwegian (%)
Ancestries Reported - Polish (%)
Ancestries Reported - Portuguese (%)
Ancestries Reported - Russian (%)
Ancestries Reported - Scotch-Irish (%)
Ancestries Reported - Scottish (%)
Ancestries Reported - Slovak (%)
Ancestries Reported - Subsaharan African (%)
Ancestries Reported - Swedish (%)
Ancestries Reported - Swiss (%)
Ancestries Reported - Ukrainian (%)
Ancestries Reported - United States (%)
Ancestries Reported - Welsh (%)
Ancestries Reported - West Indian (%)
Ancestries Reported - Other (%)
Geographical mobility - Same house 1 year ago (%)
Geographical mobility - Same house 1 year ago (%) - White
Geographical mobility - Same house 1 year ago (%) - Black or African American
Geographical mobility - Same house 1 year ago (%) - Asian
Geographical mobility - Same house 1 year ago (%) - Hispanic or Latino
Geographical mobility - Same house 1 year ago (%) - American Indian and Alaska Native
Geographical mobility - Same house 1 year ago (%) - Multirace
Geographical mobility - Same house 1 year ago (%) - Other Race
Geographical mobility - Moved within same county (%)
Geographical mobility - Moved within same county (%) - White
Geographical mobility - Moved within same county (%) - Black or African American
Geographical mobility - Moved within same county (%) - Asian
Geographical mobility - Moved within same county (%) - Hispanic or Latino
Geographical mobility - Moved within same county (%) - American Indian and Alaska Native
Geographical mobility - Moved within same county (%) - Multirace
Geographical mobility - Moved within same county (%) - Other Race
Geographical mobility - Moved from different county within same state (%)
Geographical mobility - Moved from different county within same state (%) - White
Geographical mobility - Moved from different county within same state (%) - Black or African American
Geographical mobility - Moved from different county within same state (%) - Asian
Geographical mobility - Moved from different county within same state (%) - Hispanic or Latino
Geographical mobility - Moved from different county within same state (%) - American Indian and Alaska Native
Geographical mobility - Moved from different county within same state (%) - Multirace
Geographical mobility - Moved from different county within same state (%) - Other Race
Geographical mobility - Moved from different state (%)
Geographical mobility - Moved from different state (%) - White
Geographical mobility - Moved from different state (%) - Black or African American
Geographical mobility - Moved from different state (%) - Asian
Geographical mobility - Moved from different state (%) - Hispanic or Latino
Geographical mobility - Moved from different state (%) - American Indian and Alaska Native
Geographical mobility - Moved from different state (%) - Multirace
Geographical mobility - Moved from different state (%) - Other Race
Geographical mobility - Moved from abroad (%)
Geographical mobility - Moved from abroad (%) - White
Geographical mobility - Moved from abroad (%) - Black or African American
Geographical mobility - Moved from abroad (%) - Asian
Geographical mobility - Moved from abroad (%) - Hispanic or Latino
Geographical mobility - Moved from abroad (%) - American Indian and Alaska Native
Geographical mobility - Moved from abroad (%) - Multirace
Geographical mobility - Moved from abroad (%) - Other Race
Place of birth for the foreign-born population - Ireland (%)
Place of birth for the foreign-born population - Denmark (%)
Place of birth for the foreign-born population - Norway (%)
Place of birth for the foreign-born population - Sweden (%)
Place of birth for the foreign-born population - United Kingdom (%)
Place of birth for the foreign-born population - England (%)
Place of birth for the foreign-born population - Scotland (%)
Place of birth for the foreign-born population - Other Northern Europe (%)
Place of birth for the foreign-born population - Austria (%)
Place of birth for the foreign-born population - Belgium (%)
Place of birth for the foreign-born population - France (%)
Place of birth for the foreign-born population - Germany (%)
Place of birth for the foreign-born population - Netherlands (%)
Place of birth for the foreign-born population - Switzerland (%)
Place of birth for the foreign-born population - Other Western Europe (%)
Place of birth for the foreign-born population - Greece (%)
Place of birth for the foreign-born population - Italy (%)
Place of birth for the foreign-born population - Portugal (%)
Place of birth for the foreign-born population - Spain (%)
Place of birth for the foreign-born population - Other Southern Europe (%)
Place of birth for the foreign-born population - Albania (%)
Place of birth for the foreign-born population - Belarus (%)
Place of birth for the foreign-born population - Bosnia and Herzegovina (%)
Place of birth for the foreign-born population - Bulgaria (%)
Place of birth for the foreign-born population - Croatia (%)
Place of birth for the foreign-born population - Czechoslovakia (%)
Place of birth for the foreign-born population - Hungary (%)
Place of birth for the foreign-born population - Latvia (%)
Place of birth for the foreign-born population - Lithuania (%)
Place of birth for the foreign-born population - North Macedonia (Macedonia) (%)
Place of birth for the foreign-born population - Moldova (%)
Place of birth for the foreign-born population - Poland (%)
Place of birth for the foreign-born population - Romania (%)
Place of birth for the foreign-born population - Russia (%)
Place of birth for the foreign-born population - Serbia (%)
Place of birth for the foreign-born population - Ukraine (%)
Place of birth for the foreign-born population - Other Eastern Europe (%)
Place of birth for the foreign-born population - China (%)
Place of birth for the foreign-born population - Hong Kong (%)
Place of birth for the foreign-born population - Taiwan (%)
Place of birth for the foreign-born population - Japan (%)
Place of birth for the foreign-born population - Korea (%)
Place of birth for the foreign-born population - Other Eastern Asia (%)
Place of birth for the foreign-born population - Afghanistan (%)
Place of birth for the foreign-born population - Bangladesh (%)
Place of birth for the foreign-born population - India (%)
Place of birth for the foreign-born population - Iran (%)
Place of birth for the foreign-born population - Kazakhstan (%)
Place of birth for the foreign-born population - Nepal (%)
Place of birth for the foreign-born population - Pakistan (%)
Place of birth for the foreign-born population - Sri Lanka (%)
Place of birth for the foreign-born population - Uzbekistan (%)
Place of birth for the foreign-born population - Other South Central Asia (%)
Place of birth for the foreign-born population - Burma (%)
Place of birth for the foreign-born population - Cambodia (%)
Place of birth for the foreign-born population - Indonesia (%)
Place of birth for the foreign-born population - Laos (%)
Place of birth for the foreign-born population - Malaysia (%)
Place of birth for the foreign-born population - Philippines (%)
Place of birth for the foreign-born population - Singapore (%)
Place of birth for the foreign-born population - Thailand (%)
Place of birth for the foreign-born population - Vietnam (%)
Place of birth for the foreign-born population - Other South Eastern Asia (%)
Place of birth for the foreign-born population - Armenia (%)
Place of birth for the foreign-born population - Iraq (%)
Place of birth for the foreign-born population - Israel (%)
Place of birth for the foreign-born population - Jordan (%)
Place of birth for the foreign-born population - Kuwait (%)
Place of birth for the foreign-born population - Lebanon (%)
Place of birth for the foreign-born population - Saudi Arabia (%)
Place of birth for the foreign-born population - Syria (%)
Place of birth for the foreign-born population - Turkey (%)
Place of birth for the foreign-born population - Yemen (%)
Place of birth for the foreign-born population - Other Western Asia (%)
Place of birth for the foreign-born population - Eritrea (%)
Place of birth for the foreign-born population - Ethiopia (%)
Place of birth for the foreign-born population - Kenya (%)
Place of birth for the foreign-born population - Somalia (%)
Place of birth for the foreign-born population - Uganda (%)
Place of birth for the foreign-born population - Zimbabwe (%)
Place of birth for the foreign-born population - Other Eastern Africa (%)
Place of birth for the foreign-born population - Cameroon (%)
Place of birth for the foreign-born population - Congo (%)
Place of birth for the foreign-born population - Democratic Republic of Congo (Zaire) (%)
Place of birth for the foreign-born population - Other Middle Africa (%)
Place of birth for the foreign-born population - Egypt (%)
Place of birth for the foreign-born population - Morocco (%)
Place of birth for the foreign-born population - Sudan (%)
Place of birth for the foreign-born population - Other Northern Africa (%)
Place of birth for the foreign-born population - South Africa (%)
Place of birth for the foreign-born population - Other Southern Africa (%)
Place of birth for the foreign-born population - Cabo Verde (%)
Place of birth for the foreign-born population - Ghana (%)
Place of birth for the foreign-born population - Liberia (%)
Place of birth for the foreign-born population - Nigeria (%)
Place of birth for the foreign-born population - Senegal (%)
Place of birth for the foreign-born population - Sierra Leone (%)
Place of birth for the foreign-born population - Other Western Africa (%)
Place of birth for the foreign-born population - Australia (%)
Place of birth for the foreign-born population - New Zealand (%)
Place of birth for the foreign-born population - Fiji (%)
Place of birth for the foreign-born population - Micronesia (%)
Place of birth for the foreign-born population - Bahamas (%)
Place of birth for the foreign-born population - Barbados (%)
Place of birth for the foreign-born population - Cuba (%)
Place of birth for the foreign-born population - Dominica (%)
Place of birth for the foreign-born population - Dominican Republic (%)
Place of birth for the foreign-born population - Grenada (%)
Place of birth for the foreign-born population - Haiti (%)
Place of birth for the foreign-born population - Jamaica (%)
Place of birth for the foreign-born population - St. Vincent and the Grenadines (%)
Place of birth for the foreign-born population - Trinidad and Tobago (%)
Place of birth for the foreign-born population - West Indies (%)
Place of birth for the foreign-born population - Other Caribbean (%)
Place of birth for the foreign-born population - Belize (%)
Place of birth for the foreign-born population - Costa Rica (%)
Place of birth for the foreign-born population - El Salvador (%)
Place of birth for the foreign-born population - Guatemala (%)
Place of birth for the foreign-born population - Honduras (%)
Place of birth for the foreign-born population - Mexico (%)
Place of birth for the foreign-born population - Nicaragua (%)
Place of birth for the foreign-born population - Panama (%)
Place of birth for the foreign-born population - Other Central America (%)
Place of birth for the foreign-born population - Argentina (%)
Place of birth for the foreign-born population - Bolivia (%)
Place of birth for the foreign-born population - Brazil (%)
Place of birth for the foreign-born population - Chile (%)
Place of birth for the foreign-born population - Colombia (%)
Place of birth for the foreign-born population - Ecuador (%)
Place of birth for the foreign-born population - Guyana (%)
Place of birth for the foreign-born population - Peru (%)
Place of birth for the foreign-born population - Uruguay (%)
Place of birth for the foreign-born population - Venezuela (%)
Place of birth for the foreign-born population - Other South America (%)
Place of birth for the foreign-born population - Canada (%)
Place of birth for the foreign-born population - Other Northern America (%)
Place of birth for the foreign-born population - Other (%)
Latest news about races in Claremore, OK collected exclusively by city-data.com from local newspapers, TV, and radio stations
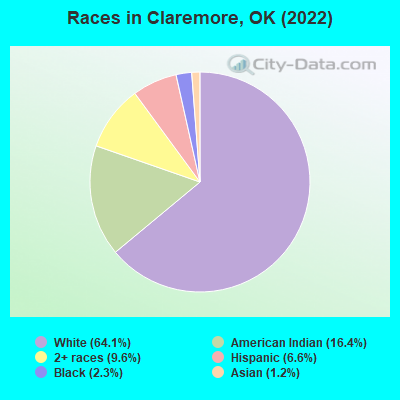
According to 2022 data, the most numerous races in Claremore, OK are White alone (13,033 residents), Hispanic (1,346 residents), and Two or more races (1,942 residents). 94.4% of Claremore residents speak English at home. 3.3% of Claremore, OK residents are foreign-born (1.4% born in Latin America, 0.9% born in Asia, 0.8% born in Europe), which is 80.5% less than the foreign-born rate of 6.0% across the entire state of Oklahoma.
Race distribution in Claremore
2000 2022
2,556,368 74.1% White alone 266,158 7.7% American Indian alone 257,981 7.5% Black alone 179,304 5.2% Hispanic 140,249 4.1% Two or more races 46,172 1.3% Asian alone 2,322 0.07% Other race alone 2,100 0.06% Native Hawaiian and Other
2,517,403 62.6% White alone 486,692 12.1% Hispanic 364,453 9.1% Two or more races 273,650 6.8% American Indian alone 268,543 6.7% Black alone 92,672 2.3% Asian alone 10,786 0.3% Other race alone 5,601 0.1% Native Hawaiian and Other
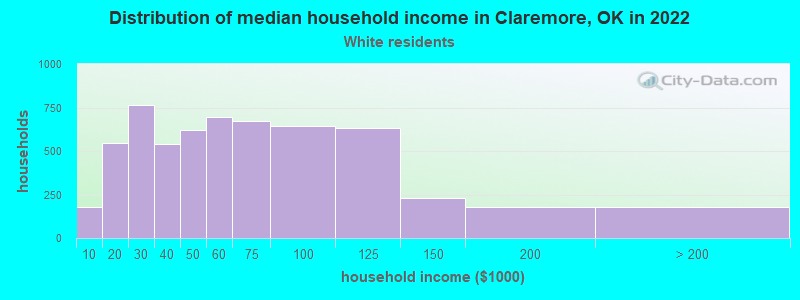
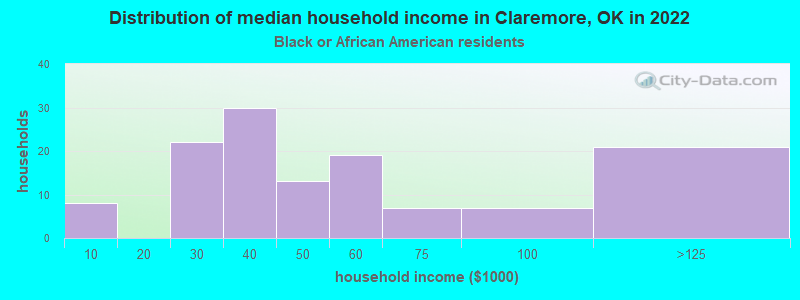
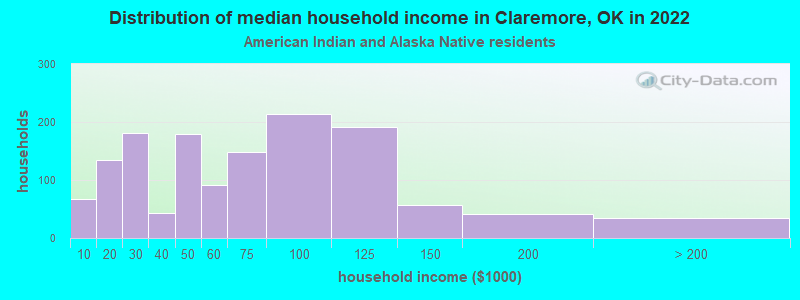
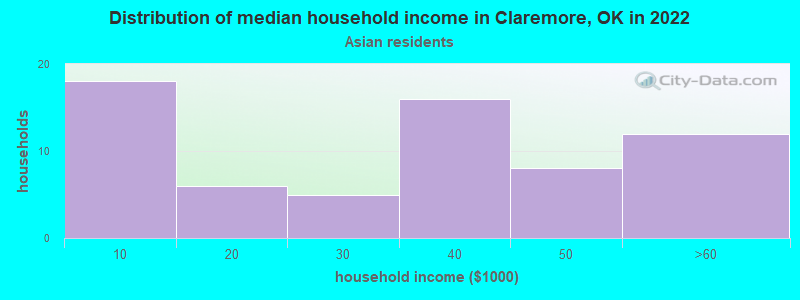
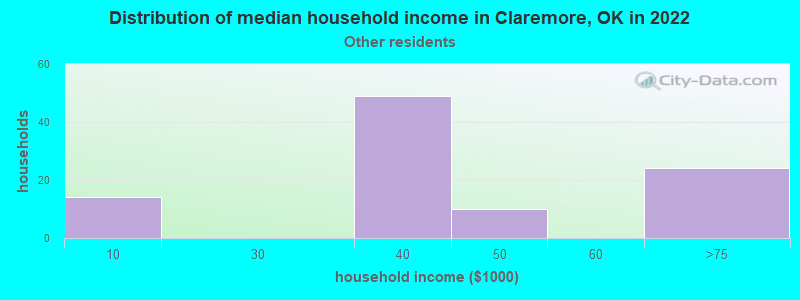
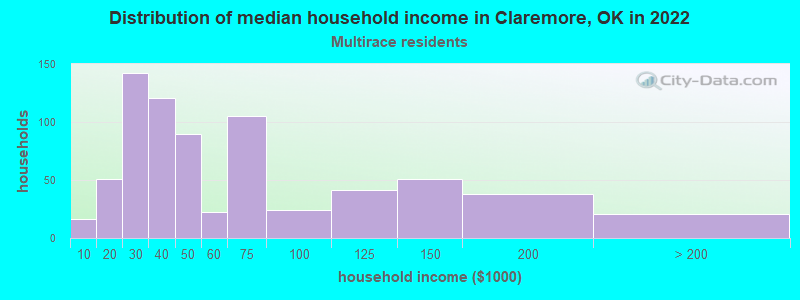
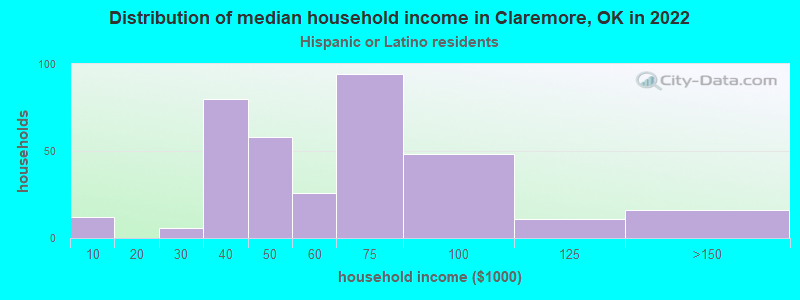
Income and house value in Claremore Median household income in 2022 $54,294 White non-Hispanic householders$26,198 Black householders$52,998 American Indian and Alaska Native householders$32,730 Asian householders$37,463 Some other race householders$45,527 Two or more races householders$61,318 Hispanic or Latino race householdersMedian 2022 house value $189,964 White Non-Hispanic householders$130,437 Black or African American householders$170,517 American Indian or Alaska Native householders $385,383 Asian householders$266,804 Some other race householders$211,071 Two or more races householders$296,449 Hispanic or Latino householders
Median age by race in Claremore
41.5 Median age for White residents37.5 46.3 31.3 Median age for Black or African American residents33.8 32.2 29.7 Median age for American Indian / Alaska Native residents32.4 30.7 30.9 Median age for Asian residents28.8 30.3 -725,225,224.5 Median age for Native Hawaiian / Pacific Islander residents-675,324,674.6 -767,251,461.2 31.9 Median age for Other race residents35.3 18.9 23.7 Median age for Two or more races residents20.4 27.5 42.3 Median age for White alone residents38.2 47.6 25.5 Median age for Hispanic or Latino residents25.8 25.3
Owner/renter occupied households by race in Claremore
House owners and renters - White residents 3,271 55.2% Owner occupied2,654 44.8% Renter occupiedHouse owners and renters - Black or African American residents 16 7.8% Owner occupied194 92.2% Renter occupiedHouse owners and renters - American Indian / Alaska Native residents 612 51.1% Owner occupied585 48.9% Renter occupiedHouse owners and renters - Asian residents 45 65.8% Owner occupied23 34.2% Renter occupiedHouse owners and renters - Native Hawaiian / Pacific Islander residents 19 100.0% Renter occupiedHouse owners and renters - Other race residents 23 20.2% Owner occupied90 79.8% Renter occupiedHouse owners and renters - Two or more races residents 347 53.1% Owner occupied306 46.9% Renter occupiedHouse owners and renters - White alone residents 3,222 55.3% Owner occupied2,601 44.7% Renter occupiedHouse owners and renters - Hispanic or Latino residents 183 47.6% Owner occupied202 52.4% Renter occupied
Language usage in Claremore
English speakers - Total 94.4% of residents of Claremore speak English at home.
3.8% of residents speak Spanish at home 419 58.1% Speak English very well302 41.9% Speak English less than very well1.8% of residents speak other language at home 271 77.0% Speak English very well81 23.0% Speak English less than very well
English speakers - Born in the United States 95.6% of residents of Claremore speak English at home.
3.0% of residents speak Spanish at home 178 92.7% Speak English very well14 7.3% Speak English less than very well1.1% of residents speak other language at home 57 79.2% Speak English very well15 20.8% Speak English less than very well
English speakers - Native, born elsewhere 69.4% of residents of Claremore speak English at home.
21.9% of residents speak Spanish at home 19 54.3% Speak English very well16 45.7% Speak English less than very well10.6% of residents speak other language at home 17 100.0% Speak English less than very well
English speakers - Foreign-born 40.1% of residents of Claremore speak English at home.
34.4% of residents speak Spanish at home 48 18.6% Speak English very well210 81.4% Speak English less than very well29.2% of residents speak other language at home 139 63.5% Speak English very well80 36.5% Speak English less than very well
White (Caucasian) - Speak only English Native:
98.7% (12,220)Foreign-born:
94.9% (209)
White (Caucasian) - Speak another language Native:
1.3% (165)Foreign-born:
27.8% (61)
Black or African American - Speak only English Native:
97.9% (285)Foreign-born:
55.8% (23)
Black or African American - Speak another language Native:
2.1% (6)Foreign-born:
39.7% (17)
Asian - Speak only English Native:
34.1% (17)Foreign-born:
5.8% (11)
Asian - Speak another language Native:
66.7% (34)Foreign-born:
91.6% (169)
Other race - Speak another language Native:
67.7% (108)Foreign-born:
100.0% (143)
Two or more races - Speak only English Native:
89.6% (1,967)Foreign-born:
14.1% (24)
Two or more races - Speak another language Native:
11.4% (251)Foreign-born:
69.2% (116)
White alone - Speak only English Native:
99.0% (12,060)Foreign-born:
86.2% (216)
White alone - Speak another language Native:
1.0% (119)Foreign-born:
12.4% (31)
Hispanic or Latino - Speak only English Native:
59.7% (558)Foreign-born:
6.4% (17)
Hispanic or Latino - Speak another language Native:
39.5% (369)Foreign-born:
91.1% (238)
Foreign-born residents in Claremore 676 residents are foreign born (1.4% Latin America , 0.9% Asia , 0.8% Europe ).
This city:
3.3%Oklahoma:
6.1%
Marital status for residents in Claremore Marital status - White (Caucasian) population 15 years and over
Males 29.4% Never married44.1% Now married3.2% Separated6.2% Widowed17.1% DivorcedFemales 20.1% Never married38.7% Now married3.7% Separated18.1% Widowed19.4% DivorcedWomen who gave birth in the past 12 months Now married:
81.1% (188)Unmarried:
18.9% (44)
Women who did not give birth in the past 12 months Now married:
42.8% (1,171)Unmarried:
57.2% (1,568)
Marital status - Black or African American population 15 years and over
Males 27.1% Never married33.2% Now married9.5% Separated9.0% Widowed21.1% DivorcedFemales 55.8% Never married36.5% Now married0.0% Separated0.0% Widowed7.7% DivorcedWomen who did not give birth in the past 12 months Now married:
33.3% (27)Unmarried:
66.7% (54)
Marital status - American Indian / Alaska Native population 15 years and over
Males 48.3% Never married36.3% Now married1.0% Separated3.6% Widowed10.8% DivorcedFemales 32.5% Never married34.4% Now married2.5% Separated8.1% Widowed22.6% DivorcedWomen who gave birth in the past 12 months Now married:
13.6% (9)Unmarried:
86.4% (58)
Women who did not give birth in the past 12 months Now married:
42.2% (394)Unmarried:
57.8% (539)
Marital status - Asian population 15 years and over
Males 57.1% Never married26.2% Now married0.0% Separated0.0% Widowed16.7% DivorcedFemales 36.8% Never married40.6% Now married0.0% Separated15.0% Widowed7.5% DivorcedWomen who gave birth in the past 12 months Now married:
0.0% (0)Unmarried:
100.0% (10)
Women who did not give birth in the past 12 months Now married:
52.4% (54)Unmarried:
47.6% (49)
Marital status - Native Hawaiian / Pacific Islander population 15 years and over
Males 0.0% Never married100.0% Now married0.0% Separated0.0% Widowed0.0% DivorcedFemales 0.0% Never married100.0% Now married0.0% Separated0.0% Widowed0.0% DivorcedWomen who gave birth in the past 12 months Now married:
100.0% (11)Unmarried:
0.0% (0)
Marital status - Other race population 15 years and over
Males 17.6% Never married51.3% Now married16.8% Separated0.0% Widowed14.3% DivorcedFemales 55.8% Never married44.2% Now married0.0% Separated0.0% Widowed0.0% DivorcedWomen who did not give birth in the past 12 months Now married:
35.8% (28)Unmarried:
64.2% (50)
Marital status - Two or more races population 15 years and over
Males 44.6% Never married40.2% Now married1.5% Separated0.6% Widowed13.2% DivorcedFemales 27.9% Never married36.3% Now married3.0% Separated10.5% Widowed22.3% DivorcedWomen who gave birth in the past 12 months Now married:
100.0% (11)Unmarried:
0.0% (0)
Women who did not give birth in the past 12 months Now married:
35.6% (144)Unmarried:
64.4% (260)
Marital status - White alone, not Hispanic / Latino population 15 years and over
Males 28.6% Never married44.1% Now married3.4% Separated6.4% Widowed17.4% DivorcedFemales 19.4% Never married38.8% Now married3.7% Separated18.4% Widowed19.7% DivorcedWomen who gave birth in the past 12 months Now married:
80.6% (185)Unmarried:
19.4% (45)
Women who did not give birth in the past 12 months Now married:
43.3% (1,156)Unmarried:
56.7% (1,511)
Marital status - Hispanic or Latino population 15 years and over
Males 35.9% Never married43.2% Now married4.1% Separated1.0% Widowed15.8% DivorcedFemales 46.8% Never married45.3% Now married0.0% Separated1.2% Widowed6.7% DivorcedWomen who gave birth in the past 12 months Now married:
100.0% (6)Unmarried:
0.0% (0)
Women who did not give birth in the past 12 months Now married:
39.4% (124)Unmarried:
60.6% (191)
Ancestries in Claremore
1,241 12.6% German974 9.9% English964 9.8% Irish642 6.5% American179 1.8% Scottish134 1.4% Italian117 1.2% European59 0.6% Dutch57 0.6% Norwegian53 0.5% Polish43 0.4% French40 0.4% Scotch-Irish37 0.4% Welsh33 0.3% Sierra Leonean32 0.3% Czech30 0.3% Scandinavian24 0.2% Russian22 0.2% Greek20 0.2% Czechoslovakian16 0.2% British16 0.2% Portuguese15 0.2% Northern European13 0.1% Haitian12 0.1% Yugoslavian11 0.1% Hungarian11 0.1% Swedish10 0.1% Slavic9 0.09% Eastern European9 0.09% Danish8 0.08% Finnish6 0.06% Cajun6 0.06% Albanian5 0.05% Pennsylvania German1 0.01% Icelander
Geographical mobility in Claremore Same house 1 year ago 10,254 78.0% White (Caucasian)257 75.5% Black or African American2,643 79.5% American Indian / Alaska Native167 78.4% Asian23 100.0% Native Hawaiian / Pacific Islander147 47.2% Other race1,968 73.8% Two or more races10,102 78.3% White alone, not Hispanic / Latino901 68.0% Hispanic or LatinoMoved within same county 1,279 9.7% White / Caucasian22 6.5% Black or African American205 6.2% American Indian / Alaska Native6 2.8% Asian31 9.8% Other race363 13.6% Two or more races1,237 9.6% White alone, not Hispanic / Latino285 21.5% Hispanic or LatinoMoved within same state 1,215 9.2% White / Caucasian54 15.8% Black or African American329 9.9% American Indian / Alaska Native8 3.9% Asian49 15.7% Other race229 8.6% Two or more races1,147 8.9% White alone, not Hispanic / Latino135 10.2% Hispanic or LatinoMoved from different state 440 3.3% White / Caucasian9 2.5% Black or African American30 0.9% American Indian / Alaska Native17 8.0% Asian15 4.7% Other race51 1.9% Two or more races464 3.6% White alone, not Hispanic / Latino24 1.8% Hispanic or LatinoMoved from abroad 15 0.1% White16 7.4% Asian80 25.7% Other race15 0.6% Two or more races15 0.1% White alone, not Hispanic / Latino80 6.0% Hispanic or Latino
Children Nativity (place of birth) in Claremore
Children under 6 years - Living with two parents Both parents native 759 100.0% NativeBoth parents foreign-born 22 100.0% NativeOne native, one foreign-born parent 93 100.0% NativeChildren under 6 years - Living with one parent Native parent 488 100.0% NativeForeign-born parent 12 100.0% NativeChildren 6 to 17 years - Living with two parents Both parents native 1,444 99.6% Native6 0.4% Foreign-bornBoth parents foreign-born 33 44.6% Native40 55.4% Foreign-bornOne native, one foreign-born parent 128 89.2% Native16 10.8% Foreign-bornChildren 6 to 17 years - Living with one parent Native parent 1,011 100.0% NativeForeign-born parent 14 54.4% Native12 45.6% Foreign-born
Grandparents responsible for own grandchildren in Claremore
Grandparents (30 to 59 years) White / Caucasian 34 66.4% Responsible for grandchildren17 33.6% Not responsible for grandchildrenBlack or African American 3 100.0% Not responsible for grandchildrenAmerican Indian / Alaska Native 17 54.3% Responsible for grandchildren14 45.7% Not responsible for grandchildrenOther race 18 100.0% Not responsible for grandchildrenTwo or more races 6 100.0% Responsible for grandchildrenWhite alone, not Hispanic / Latino 63 65.0% Responsible for grandchildren34 35.0% Not responsible for grandchildrenHispanic or Latino 10 100.0% Not responsible for grandchildrenGrandparents (60 years and over) White / Caucasian 52 45.7% Responsible for grandchildren62 54.3% Not responsible for grandchildrenAmerican Indian / Alaska Native 4 100.0% Not responsible for grandchildrenTwo or more races 8 100.0% Not responsible for grandchildrenWhite alone, not Hispanic / Latino 88 57.7% Responsible for grandchildren65 42.3% Not responsible for grandchildren