Races in Burleson, Texas (TX) Detailed Stats
Data:
Races - White alone (%)
Races - White alone (% change since 2000)
Races - Black alone (%)
Races - Black alone (% change since 2000)
Races - American Indian alone (%)
Races - American Indian alone (% change since 2000)
Races - Asian alone (%)
Races - Asian alone (% change since 2000)
Races - Hispanic (%)
Races - Hispanic (% change since 2000)
Races - Native Hawaiian and Other Pacific Islander alone (%)
Races - Native Hawaiian and Other Pacific Islander alone (% change since 2000)
Races - Two or more races(%)
Races - Two or more races(% change since 2000)
Races - Other race alone (%)
Races - Other race alone (% change since 2000)
Racial diversity
Place of birth - Born in state of residence (%)
Place of birth - Born in state of residence (%) - White
Place of birth - Born in state of residence (%) - Black or African American
Place of birth - Born in state of residence (%) - Asian
Place of birth - Born in state of residence (%) - Hispanic or Latino
Place of birth - Born in state of residence (%) - American Indian and Alaska Native
Place of birth - Born in state of residence (%) - Multirace
Place of birth - Born in state of residence (%) - Other Race
Place of birth - Born in other state (%)
Place of birth - Born in other state (%) - White
Place of birth - Born in other state (%) - Black or African American
Place of birth - Born in other state (%) - Asian
Place of birth - Born in other state (%) - Hispanic or Latino
Place of birth - Born in other state (%) - American Indian and Alaska Native
Place of birth - Born in other state (%) - Multirace
Place of birth - Born in other state (%) - Other Race
Place of birth - Native, outside of US (%)
Place of birth - Native, outside of US (%) - White
Place of birth - Native, outside of US (%) - Black or African American
Place of birth - Native, outside of US (%) - Asian
Place of birth - Native, outside of US (%) - Hispanic or Latino
Place of birth - Native, outside of US (%) - American Indian and Alaska Native
Place of birth - Native, outside of US (%) - Multirace
Place of birth - Native, outside of US (%) - Other Race
Place of birth - Foreign born (%)
Place of birth - Foreign born (%) - White
Place of birth - Foreign born (%) - Black or African American
Place of birth - Foreign born (%) - Asian
Place of birth - Foreign born (%) - Hispanic or Latino
Place of birth - Foreign born (%) - American Indian and Alaska Native
Place of birth - Foreign born (%) - Multirace
Place of birth - Foreign born (%) - Other Race
Residents speaking English at home (%)
Residents speaking English at home - Born in the United States (%)
Residents speaking English at home - Native, born elsewhere (%)
Residents speaking English at home - Foreign born (%)
Residents speaking Spanish at home (%)
Residents speaking Spanish at home - Born in the United States (%)
Residents speaking Spanish at home - Native, born elsewhere (%)
Residents speaking Spanish at home - Foreign born (%)
Residents speaking other language at home (%)
Residents speaking other language at home - Born in the United States (%)
Residents speaking other language at home - Native, born elsewhere (%)
Residents speaking other language at home - Foreign born (%)
Marital status - Never married (%)
Marital status - Now married (%)
Marital status - Separated (%)
Marital status - Widowed (%)
Marital status - Divorced (%)
Ancestries Reported - Arab (%)
Ancestries Reported - Czech (%)
Ancestries Reported - Danish (%)
Ancestries Reported - Dutch (%)
Ancestries Reported - English (%)
Ancestries Reported - French (%)
Ancestries Reported - French Canadian (%)
Ancestries Reported - German (%)
Ancestries Reported - Greek (%)
Ancestries Reported - Hungarian (%)
Ancestries Reported - Irish (%)
Ancestries Reported - Italian (%)
Ancestries Reported - Lithuanian (%)
Ancestries Reported - Norwegian (%)
Ancestries Reported - Polish (%)
Ancestries Reported - Portuguese (%)
Ancestries Reported - Russian (%)
Ancestries Reported - Scotch-Irish (%)
Ancestries Reported - Scottish (%)
Ancestries Reported - Slovak (%)
Ancestries Reported - Subsaharan African (%)
Ancestries Reported - Swedish (%)
Ancestries Reported - Swiss (%)
Ancestries Reported - Ukrainian (%)
Ancestries Reported - United States (%)
Ancestries Reported - Welsh (%)
Ancestries Reported - West Indian (%)
Ancestries Reported - Other (%)
Geographical mobility - Same house 1 year ago (%)
Geographical mobility - Same house 1 year ago (%) - White
Geographical mobility - Same house 1 year ago (%) - Black or African American
Geographical mobility - Same house 1 year ago (%) - Asian
Geographical mobility - Same house 1 year ago (%) - Hispanic or Latino
Geographical mobility - Same house 1 year ago (%) - American Indian and Alaska Native
Geographical mobility - Same house 1 year ago (%) - Multirace
Geographical mobility - Same house 1 year ago (%) - Other Race
Geographical mobility - Moved within same county (%)
Geographical mobility - Moved within same county (%) - White
Geographical mobility - Moved within same county (%) - Black or African American
Geographical mobility - Moved within same county (%) - Asian
Geographical mobility - Moved within same county (%) - Hispanic or Latino
Geographical mobility - Moved within same county (%) - American Indian and Alaska Native
Geographical mobility - Moved within same county (%) - Multirace
Geographical mobility - Moved within same county (%) - Other Race
Geographical mobility - Moved from different county within same state (%)
Geographical mobility - Moved from different county within same state (%) - White
Geographical mobility - Moved from different county within same state (%) - Black or African American
Geographical mobility - Moved from different county within same state (%) - Asian
Geographical mobility - Moved from different county within same state (%) - Hispanic or Latino
Geographical mobility - Moved from different county within same state (%) - American Indian and Alaska Native
Geographical mobility - Moved from different county within same state (%) - Multirace
Geographical mobility - Moved from different county within same state (%) - Other Race
Geographical mobility - Moved from different state (%)
Geographical mobility - Moved from different state (%) - White
Geographical mobility - Moved from different state (%) - Black or African American
Geographical mobility - Moved from different state (%) - Asian
Geographical mobility - Moved from different state (%) - Hispanic or Latino
Geographical mobility - Moved from different state (%) - American Indian and Alaska Native
Geographical mobility - Moved from different state (%) - Multirace
Geographical mobility - Moved from different state (%) - Other Race
Geographical mobility - Moved from abroad (%)
Geographical mobility - Moved from abroad (%) - White
Geographical mobility - Moved from abroad (%) - Black or African American
Geographical mobility - Moved from abroad (%) - Asian
Geographical mobility - Moved from abroad (%) - Hispanic or Latino
Geographical mobility - Moved from abroad (%) - American Indian and Alaska Native
Geographical mobility - Moved from abroad (%) - Multirace
Geographical mobility - Moved from abroad (%) - Other Race
Place of birth for the foreign-born population - Ireland (%)
Place of birth for the foreign-born population - Denmark (%)
Place of birth for the foreign-born population - Norway (%)
Place of birth for the foreign-born population - Sweden (%)
Place of birth for the foreign-born population - United Kingdom (%)
Place of birth for the foreign-born population - England (%)
Place of birth for the foreign-born population - Scotland (%)
Place of birth for the foreign-born population - Other Northern Europe (%)
Place of birth for the foreign-born population - Austria (%)
Place of birth for the foreign-born population - Belgium (%)
Place of birth for the foreign-born population - France (%)
Place of birth for the foreign-born population - Germany (%)
Place of birth for the foreign-born population - Netherlands (%)
Place of birth for the foreign-born population - Switzerland (%)
Place of birth for the foreign-born population - Other Western Europe (%)
Place of birth for the foreign-born population - Greece (%)
Place of birth for the foreign-born population - Italy (%)
Place of birth for the foreign-born population - Portugal (%)
Place of birth for the foreign-born population - Spain (%)
Place of birth for the foreign-born population - Other Southern Europe (%)
Place of birth for the foreign-born population - Albania (%)
Place of birth for the foreign-born population - Belarus (%)
Place of birth for the foreign-born population - Bosnia and Herzegovina (%)
Place of birth for the foreign-born population - Bulgaria (%)
Place of birth for the foreign-born population - Croatia (%)
Place of birth for the foreign-born population - Czechoslovakia (%)
Place of birth for the foreign-born population - Hungary (%)
Place of birth for the foreign-born population - Latvia (%)
Place of birth for the foreign-born population - Lithuania (%)
Place of birth for the foreign-born population - North Macedonia (Macedonia) (%)
Place of birth for the foreign-born population - Moldova (%)
Place of birth for the foreign-born population - Poland (%)
Place of birth for the foreign-born population - Romania (%)
Place of birth for the foreign-born population - Russia (%)
Place of birth for the foreign-born population - Serbia (%)
Place of birth for the foreign-born population - Ukraine (%)
Place of birth for the foreign-born population - Other Eastern Europe (%)
Place of birth for the foreign-born population - China (%)
Place of birth for the foreign-born population - Hong Kong (%)
Place of birth for the foreign-born population - Taiwan (%)
Place of birth for the foreign-born population - Japan (%)
Place of birth for the foreign-born population - Korea (%)
Place of birth for the foreign-born population - Other Eastern Asia (%)
Place of birth for the foreign-born population - Afghanistan (%)
Place of birth for the foreign-born population - Bangladesh (%)
Place of birth for the foreign-born population - India (%)
Place of birth for the foreign-born population - Iran (%)
Place of birth for the foreign-born population - Kazakhstan (%)
Place of birth for the foreign-born population - Nepal (%)
Place of birth for the foreign-born population - Pakistan (%)
Place of birth for the foreign-born population - Sri Lanka (%)
Place of birth for the foreign-born population - Uzbekistan (%)
Place of birth for the foreign-born population - Other South Central Asia (%)
Place of birth for the foreign-born population - Burma (%)
Place of birth for the foreign-born population - Cambodia (%)
Place of birth for the foreign-born population - Indonesia (%)
Place of birth for the foreign-born population - Laos (%)
Place of birth for the foreign-born population - Malaysia (%)
Place of birth for the foreign-born population - Philippines (%)
Place of birth for the foreign-born population - Singapore (%)
Place of birth for the foreign-born population - Thailand (%)
Place of birth for the foreign-born population - Vietnam (%)
Place of birth for the foreign-born population - Other South Eastern Asia (%)
Place of birth for the foreign-born population - Armenia (%)
Place of birth for the foreign-born population - Iraq (%)
Place of birth for the foreign-born population - Israel (%)
Place of birth for the foreign-born population - Jordan (%)
Place of birth for the foreign-born population - Kuwait (%)
Place of birth for the foreign-born population - Lebanon (%)
Place of birth for the foreign-born population - Saudi Arabia (%)
Place of birth for the foreign-born population - Syria (%)
Place of birth for the foreign-born population - Turkey (%)
Place of birth for the foreign-born population - Yemen (%)
Place of birth for the foreign-born population - Other Western Asia (%)
Place of birth for the foreign-born population - Eritrea (%)
Place of birth for the foreign-born population - Ethiopia (%)
Place of birth for the foreign-born population - Kenya (%)
Place of birth for the foreign-born population - Somalia (%)
Place of birth for the foreign-born population - Uganda (%)
Place of birth for the foreign-born population - Zimbabwe (%)
Place of birth for the foreign-born population - Other Eastern Africa (%)
Place of birth for the foreign-born population - Cameroon (%)
Place of birth for the foreign-born population - Congo (%)
Place of birth for the foreign-born population - Democratic Republic of Congo (Zaire) (%)
Place of birth for the foreign-born population - Other Middle Africa (%)
Place of birth for the foreign-born population - Egypt (%)
Place of birth for the foreign-born population - Morocco (%)
Place of birth for the foreign-born population - Sudan (%)
Place of birth for the foreign-born population - Other Northern Africa (%)
Place of birth for the foreign-born population - South Africa (%)
Place of birth for the foreign-born population - Other Southern Africa (%)
Place of birth for the foreign-born population - Cabo Verde (%)
Place of birth for the foreign-born population - Ghana (%)
Place of birth for the foreign-born population - Liberia (%)
Place of birth for the foreign-born population - Nigeria (%)
Place of birth for the foreign-born population - Senegal (%)
Place of birth for the foreign-born population - Sierra Leone (%)
Place of birth for the foreign-born population - Other Western Africa (%)
Place of birth for the foreign-born population - Australia (%)
Place of birth for the foreign-born population - New Zealand (%)
Place of birth for the foreign-born population - Fiji (%)
Place of birth for the foreign-born population - Micronesia (%)
Place of birth for the foreign-born population - Bahamas (%)
Place of birth for the foreign-born population - Barbados (%)
Place of birth for the foreign-born population - Cuba (%)
Place of birth for the foreign-born population - Dominica (%)
Place of birth for the foreign-born population - Dominican Republic (%)
Place of birth for the foreign-born population - Grenada (%)
Place of birth for the foreign-born population - Haiti (%)
Place of birth for the foreign-born population - Jamaica (%)
Place of birth for the foreign-born population - St. Vincent and the Grenadines (%)
Place of birth for the foreign-born population - Trinidad and Tobago (%)
Place of birth for the foreign-born population - West Indies (%)
Place of birth for the foreign-born population - Other Caribbean (%)
Place of birth for the foreign-born population - Belize (%)
Place of birth for the foreign-born population - Costa Rica (%)
Place of birth for the foreign-born population - El Salvador (%)
Place of birth for the foreign-born population - Guatemala (%)
Place of birth for the foreign-born population - Honduras (%)
Place of birth for the foreign-born population - Mexico (%)
Place of birth for the foreign-born population - Nicaragua (%)
Place of birth for the foreign-born population - Panama (%)
Place of birth for the foreign-born population - Other Central America (%)
Place of birth for the foreign-born population - Argentina (%)
Place of birth for the foreign-born population - Bolivia (%)
Place of birth for the foreign-born population - Brazil (%)
Place of birth for the foreign-born population - Chile (%)
Place of birth for the foreign-born population - Colombia (%)
Place of birth for the foreign-born population - Ecuador (%)
Place of birth for the foreign-born population - Guyana (%)
Place of birth for the foreign-born population - Peru (%)
Place of birth for the foreign-born population - Uruguay (%)
Place of birth for the foreign-born population - Venezuela (%)
Place of birth for the foreign-born population - Other South America (%)
Place of birth for the foreign-born population - Canada (%)
Place of birth for the foreign-born population - Other Northern America (%)
Place of birth for the foreign-born population - Other (%)
Latest news about races in Burleson, TX collected exclusively by city-data.com from local newspapers, TV, and radio stations
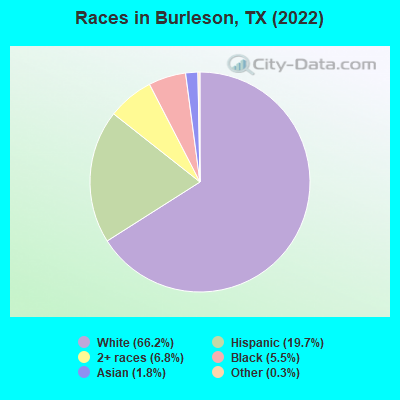
According to 2022 data, the most numerous races in Burleson, TX are Hispanic (10,336 residents), White alone (34,713 residents), and Black alone (2,902 residents). 84.6% of Burleson residents speak English at home. 4.2% of Burleson, TX residents are foreign-born (2.3% born in Latin America, 1.3% born in Asia, 0.4% born in Europe), which is 303.7% less than the foreign-born rate of 17.0% across the entire state of Texas.
Race distribution in Burleson
2000 2022
10,933,313 52.4% White alone 6,669,666 32.0% Hispanic 2,364,255 11.3% Black alone 554,445 2.7% Asian alone 230,567 1.1% Two or more races 68,859 0.3% American Indian alone 19,958 0.10% Other race alone 10,757 0.05% Native Hawaiian and Other
12,070,642 40.2% Hispanic 11,683,430 38.9% White alone 3,508,706 11.7% Black alone 1,608,173 5.4% Asian alone 956,560 3.2% Two or more races 125,763 0.4% Other race alone 47,023 0.2% American Indian alone 29,275 0.10% Native Hawaiian and Other
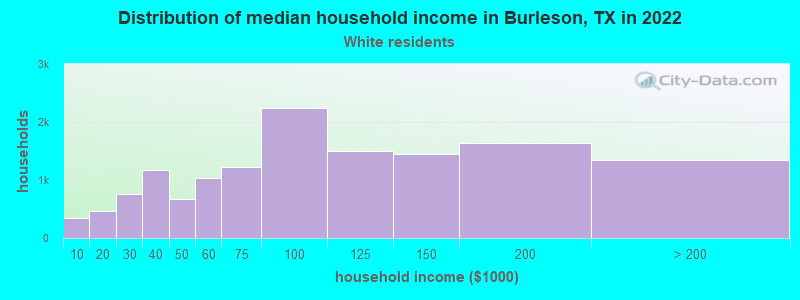
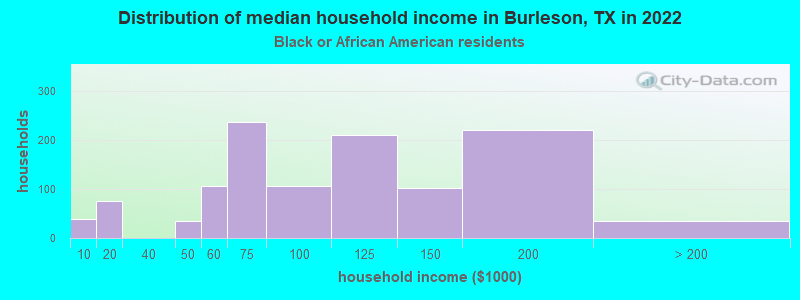
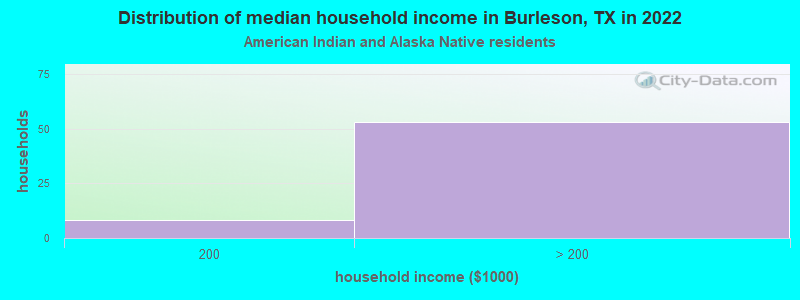
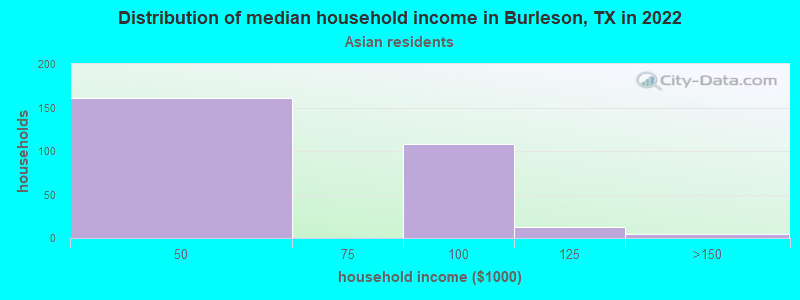
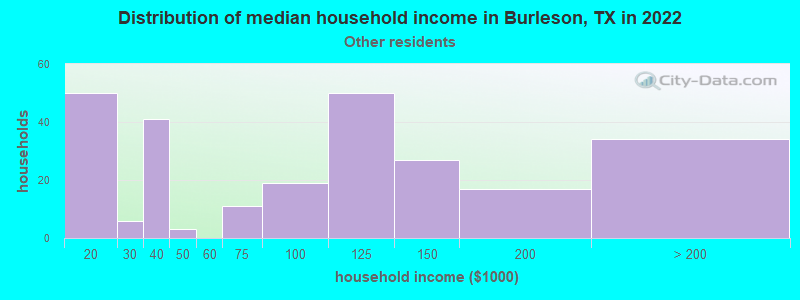
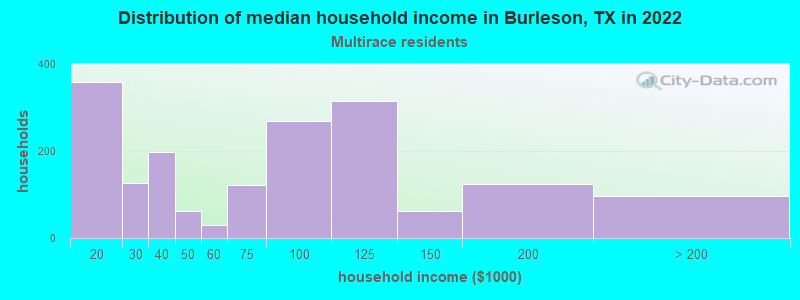
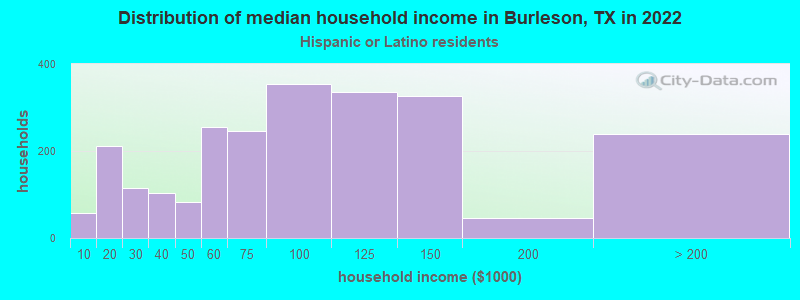
Income and house value in Burleson Median household income in 2022 $89,446 White non-Hispanic householders$98,719 Black householders$93,119 Some other race householders$74,343 Two or more races householders$81,773 Hispanic or Latino race householdersMedian 2022 house value $326,333 White Non-Hispanic householders$339,514 American Indian or Alaska Native householders $339,514 Asian householders$301,568 Some other race householders$289,585 Two or more races householders$347,502 Hispanic or Latino householders
Median age by race in Burleson
38.9 Median age for White residents39.4 38.6 34.3 Median age for Black or African American residents26.8 42.1 66.7 Median age for American Indian / Alaska Native residents56.9 -839,151,265.4 43.0 Median age for Asian residents53.1 39.8 -581,560,283.1 Median age for Native Hawaiian / Pacific Islander residents-666,666,666.0 -577,777,777.2 28.3 Median age for Other race residents27.3 30.0 17.3 Median age for Two or more races residents15.4 19.9 38.1 Median age for White alone residents38.5 38.0 29.0 Median age for Hispanic or Latino residents23.1 33.1
Owner/renter occupied households by race in Burleson
House owners and renters - White residents 10,156 73.9% Owner occupied3,579 26.1% Renter occupiedHouse owners and renters - Black or African American residents 857 54.1% Owner occupied727 45.9% Renter occupiedHouse owners and renters - American Indian / Alaska Native residents 62 100.0% Owner occupiedHouse owners and renters - Asian residents 97 36.1% Owner occupied172 63.9% Renter occupiedHouse owners and renters - Other race residents 245 77.7% Owner occupied70 22.3% Renter occupiedHouse owners and renters - Two or more races residents 1,311 70.9% Owner occupied538 29.1% Renter occupiedHouse owners and renters - White alone residents 9,778 73.7% Owner occupied3,482 26.3% Renter occupiedHouse owners and renters - Hispanic or Latino residents 1,672 65.3% Owner occupied890 34.7% Renter occupied
Language usage in Burleson
English speakers - Total 84.6% of residents of Burleson speak English at home.
10.9% of residents speak Spanish at home 3,929 74.6% Speak English very well1,338 25.4% Speak English less than very well4.5% of residents speak other language at home 1,066 49.1% Speak English very well1,105 50.9% Speak English less than very well
English speakers - Born in the United States 90.9% of residents of Burleson speak English at home.
9.1% of residents speak Spanish at home 852 76.0% Speak English very well269 24.0% Speak English less than very well1.3% of residents speak other language at home 67 40.9% Speak English very well97 59.1% Speak English less than very well
English speakers - Native, born elsewhere 43.3% of residents of Burleson speak English at home.
43.6% of residents speak Spanish at home 37 18.0% Speak English very well169 82.0% Speak English less than very well
English speakers - Foreign-born 17.8% of residents of Burleson speak English at home.
41.9% of residents speak Spanish at home 810 59.6% Speak English very well550 40.4% Speak English less than very well43.7% of residents speak other language at home 526 37.1% Speak English very well893 62.9% Speak English less than very well
White (Caucasian) - Speak only English Native:
100.0% (32,830)Foreign-born:
42.7% (365)
White (Caucasian) - Speak another language Native:
2.6% (860)Foreign-born:
59.5% (510)
Black or African American - Speak only English Native:
97.7% (2,391)Foreign-born:
50.0% (63)
Black or African American - Speak another language Native:
2.3% (57)Foreign-born:
47.1% (59)
Asian - Speak only English Native:
20.0% (78)Foreign-born:
2.6% (18)
Asian - Speak another language Native:
57.2% (224)Foreign-born:
98.0% (684)
Other race - Speak only English Native:
40.9% (613)Foreign-born:
16.9% (18)
Other race - Speak another language Native:
23.4% (351)Foreign-born:
75.6% (81)
Two or more races - Speak only English Native:
52.1% (3,952)Foreign-born:
7.7% (79)
Two or more races - Speak another language Native:
48.3% (3,663)Foreign-born:
92.4% (947)
White alone - Speak only English Native:
99.0% (31,500)Foreign-born:
49.9% (372)
White alone - Speak another language Native:
0.9% (289)Foreign-born:
52.6% (392)
Hispanic or Latino - Speak only English Native:
52.7% (4,031)Foreign-born:
5.4% (75)
Hispanic or Latino - Speak another language Native:
46.6% (3,563)Foreign-born:
94.8% (1,320)
Foreign-born residents in Burleson 2,207 residents are foreign born (2.3% Latin America , 1.3% Asia , 0.4% Europe ).
This city:
4.2%Texas:
17.1%
Marital status for residents in Burleson Marital status - White (Caucasian) population 15 years and over
Males 26.4% Never married59.1% Now married0.5% Separated2.1% Widowed11.8% DivorcedFemales 20.0% Never married54.2% Now married2.1% Separated8.2% Widowed15.5% DivorcedWomen who gave birth in the past 12 months Now married:
69.9% (372)Unmarried:
30.1% (160)
Women who did not give birth in the past 12 months Now married:
55.0% (4,728)Unmarried:
45.0% (3,874)
Marital status - Black or African American population 15 years and over
Males 24.7% Never married53.3% Now married0.0% Separated0.0% Widowed22.0% DivorcedFemales 35.5% Never married46.4% Now married9.4% Separated5.5% Widowed3.3% DivorcedWomen who did not give birth in the past 12 months Now married:
61.8% (475)Unmarried:
38.2% (293)
Marital status - American Indian / Alaska Native population 15 years and over
Males 26.5% Never married73.5% Now married0.0% Separated0.0% Widowed0.0% DivorcedFemales 28.6% Never married71.4% Now married0.0% Separated0.0% Widowed0.0% DivorcedWomen who did not give birth in the past 12 months Now married:
0.0% (0)Unmarried:
100.0% (3)
Marital status - Asian population 15 years and over
Males 25.0% Never married75.0% Now married0.0% Separated0.0% Widowed0.0% DivorcedFemales 10.3% Never married89.0% Now married0.7% Separated0.0% Widowed0.0% DivorcedWomen who gave birth in the past 12 months Now married:
100.0% (15)Unmarried:
0.0% (0)
Women who did not give birth in the past 12 months Now married:
83.9% (241)Unmarried:
16.1% (46)
Marital status - Other race population 15 years and over
Males 26.5% Never married53.0% Now married7.8% Separated8.1% Widowed4.6% DivorcedFemales 25.8% Never married53.2% Now married0.6% Separated15.8% Widowed4.6% DivorcedWomen who gave birth in the past 12 months Now married:
64.0% (35)Unmarried:
36.0% (20)
Women who did not give birth in the past 12 months Now married:
59.1% (233)Unmarried:
40.9% (161)
Marital status - Two or more races population 15 years and over
Males 39.6% Never married49.3% Now married0.0% Separated1.9% Widowed9.2% DivorcedFemales 37.1% Never married41.7% Now married3.1% Separated12.9% Widowed5.2% DivorcedWomen who gave birth in the past 12 months Now married:
100.0% (83)Unmarried:
0.0% (0)
Women who did not give birth in the past 12 months Now married:
45.4% (966)Unmarried:
54.6% (1,163)
Marital status - White alone, not Hispanic / Latino population 15 years and over
Males 25.9% Never married59.0% Now married0.6% Separated2.3% Widowed12.3% DivorcedFemales 18.7% Never married53.2% Now married2.0% Separated8.9% Widowed17.3% DivorcedWomen who gave birth in the past 12 months Now married:
64.7% (327)Unmarried:
35.3% (178)
Women who did not give birth in the past 12 months Now married:
54.3% (4,600)Unmarried:
45.7% (3,876)
Marital status - Hispanic or Latino population 15 years and over
Males 32.8% Never married59.9% Now married0.0% Separated1.5% Widowed5.8% DivorcedFemales 28.4% Never married56.6% Now married2.2% Separated9.2% Widowed3.5% DivorcedWomen who gave birth in the past 12 months Now married:
92.0% (125)Unmarried:
8.0% (11)
Women who did not give birth in the past 12 months Now married:
58.7% (1,338)Unmarried:
41.3% (940)
Ancestries in Burleson
11,303 38.3% American3,207 10.9% English1,645 5.6% German958 3.2% Irish280 0.9% European217 0.7% Scottish184 0.6% Scotch-Irish147 0.5% Italian121 0.4% French109 0.4% African104 0.4% Romanian82 0.3% Swedish74 0.3% Norwegian61 0.2% Russian56 0.2% Syrian54 0.2% Scandinavian52 0.2% Polish48 0.2% Nigerian44 0.1% Iranian37 0.1% Czechoslovakian36 0.1% French Canadian36 0.1% Czech35 0.1% Dutch35 0.1% Hungarian33 0.1% Danish30 0.1% Northern European30 0.1% Kenyan25 0.08% Cajun23 0.08% Jamaican22 0.07% British19 0.06% Egyptian19 0.06% Lebanese15 0.05% Finnish14 0.05% Portuguese14 0.05% Dutch West Indian13 0.04% Greek13 0.04% Eastern European12 0.04% Pennsylvania German11 0.04% Australian10 0.03% Canadian10 0.03% Swiss8 0.03% Belgian
Geographical mobility in Burleson Same house 1 year ago 31,783 88.8% White (Caucasian)2,688 84.8% Black or African American84 100.0% American Indian / Alaska Native855 95.3% Asian1,334 81.0% Other race8,915 91.3% Two or more races30,320 88.1% White alone, not Hispanic / Latino9,008 90.3% Hispanic or LatinoMoved within same county 1,477 4.1% White / Caucasian138 4.4% Black or African American32 3.5% Asian65 3.9% Other race52 0.5% Two or more races1,558 4.5% White alone, not Hispanic / Latino238 2.4% Hispanic or LatinoMoved within same state 1,768 4.9% White / Caucasian273 8.6% Black or African American6 100.0% Native Hawaiian / Pacific Islander16 1.0% Other race322 3.3% Two or more races1,896 5.5% White alone, not Hispanic / Latino200 2.0% Hispanic or LatinoMoved from different state 509 1.4% White / Caucasian30 0.9% Black or African American104 6.3% Other race140 1.4% Two or more races469 1.4% White alone, not Hispanic / Latino153 1.5% Hispanic or LatinoMoved from abroad 268 0.7% White40 0.4% Two or more races81 0.2% White alone, not Hispanic / Latino154 1.5% Hispanic or Latino
Children Nativity (place of birth) in Burleson
Children under 6 years - Living with two parents Both parents native 3,013 100.0% NativeBoth parents foreign-born 280 100.0% NativeOne native, one foreign-born parent 74 100.0% NativeChildren under 6 years - Living with one parent Native parent 1,687 100.0% NativeChildren 6 to 17 years - Living with two parents Both parents native 6,726 99.7% Native17 0.3% Foreign-bornBoth parents foreign-born 162 90.4% Native17 9.6% Foreign-bornOne native, one foreign-born parent 255 100.0% NativeChildren 6 to 17 years - Living with one parent Native parent 2,914 100.0% NativeForeign-born parent 52 54.8% Native43 45.2% Foreign-born
Grandparents responsible for own grandchildren in Burleson
Grandparents (30 to 59 years) White / Caucasian 111 38.8% Responsible for grandchildren175 61.2% Not responsible for grandchildrenAsian 23 100.0% Responsible for grandchildrenTwo or more races 35 100.0% Not responsible for grandchildrenWhite alone, not Hispanic / Latino 111 40.3% Responsible for grandchildren165 59.7% Not responsible for grandchildrenHispanic or Latino 39 42.7% Responsible for grandchildren53 57.3% Not responsible for grandchildrenGrandparents (60 years and over) White / Caucasian 61 18.0% Responsible for grandchildren278 82.0% Not responsible for grandchildrenAsian 125 100.0% Not responsible for grandchildrenTwo or more races 13 100.0% Not responsible for grandchildrenWhite alone, not Hispanic / Latino 64 18.2% Responsible for grandchildren286 81.8% Not responsible for grandchildrenHispanic or Latino 11 20.7% Responsible for grandchildren43 79.3% Not responsible for grandchildren