Races in Brigham City, Utah (UT) Detailed Stats
Data:
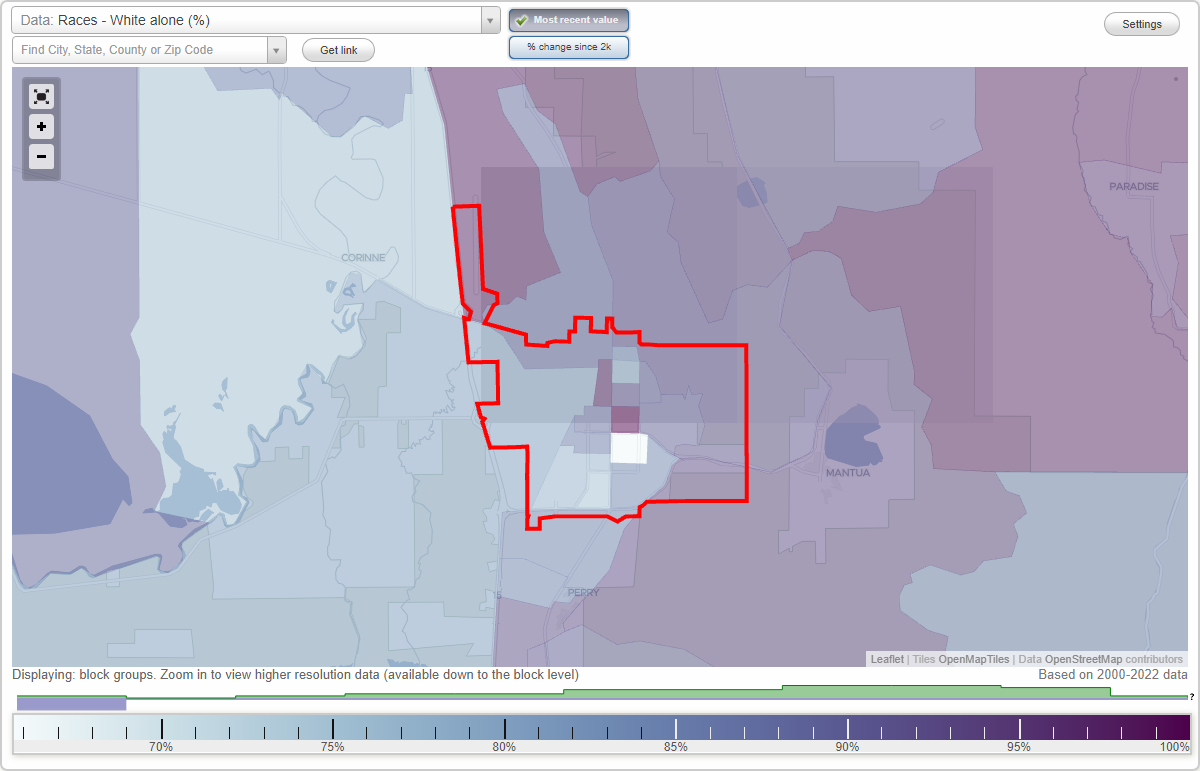
Races - White alone (%)
Races - White alone (% change since 2000)
Races - Black alone (%)
Races - Black alone (% change since 2000)
Races - American Indian alone (%)
Races - American Indian alone (% change since 2000)
Races - Asian alone (%)
Races - Asian alone (% change since 2000)
Races - Hispanic (%)
Races - Hispanic (% change since 2000)
Races - Native Hawaiian and Other Pacific Islander alone (%)
Races - Native Hawaiian and Other Pacific Islander alone (% change since 2000)
Races - Two or more races(%)
Races - Two or more races(% change since 2000)
Races - Other race alone (%)
Races - Other race alone (% change since 2000)
Racial diversity
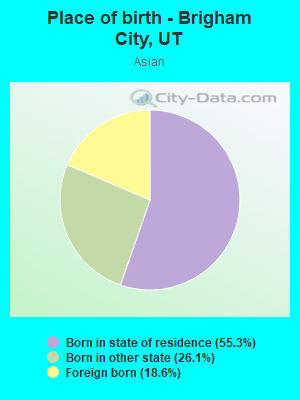
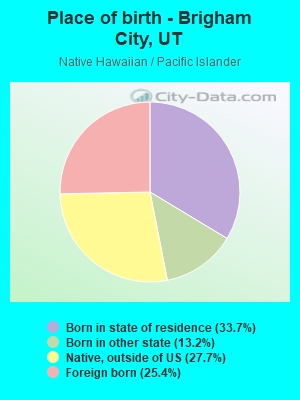
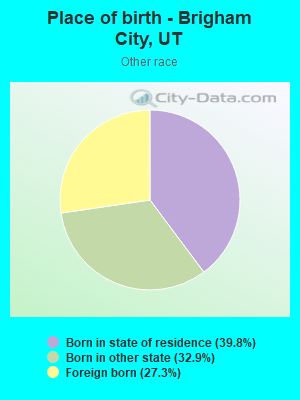
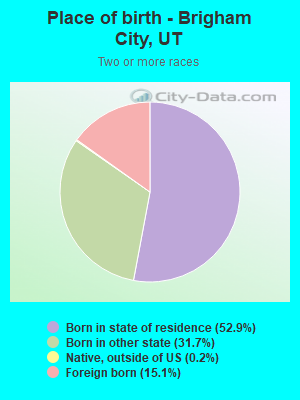
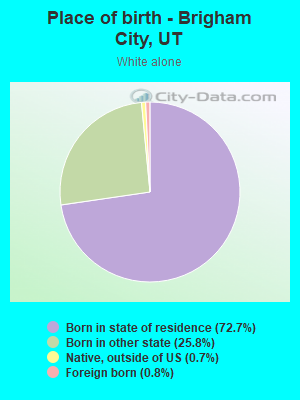
Place of birth - Born in state of residence (%)
Place of birth - Born in state of residence (%) - White
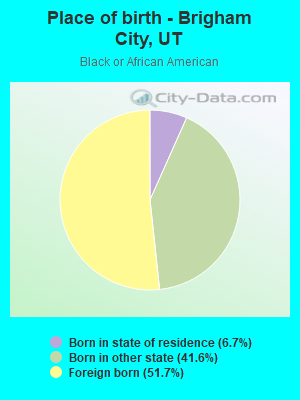
Place of birth - Born in state of residence (%) - Black or African American
Place of birth - Born in state of residence (%) - Asian
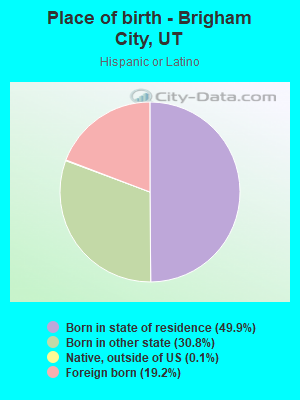
Place of birth - Born in state of residence (%) - Hispanic or Latino
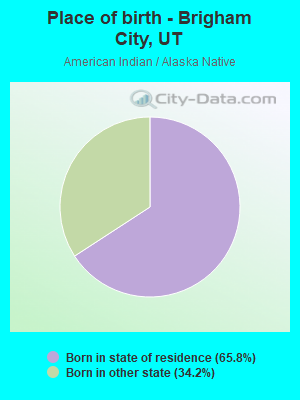
Place of birth - Born in state of residence (%) - American Indian and Alaska Native
Place of birth - Born in state of residence (%) - Multirace
Place of birth - Born in state of residence (%) - Other Race
Place of birth - Born in other state (%)
Place of birth - Born in other state (%) - White
Place of birth - Born in other state (%) - Black or African American
Place of birth - Born in other state (%) - Asian
Place of birth - Born in other state (%) - Hispanic or Latino
Place of birth - Born in other state (%) - American Indian and Alaska Native
Place of birth - Born in other state (%) - Multirace
Place of birth - Born in other state (%) - Other Race
Place of birth - Native, outside of US (%)
Place of birth - Native, outside of US (%) - White
Place of birth - Native, outside of US (%) - Black or African American
Place of birth - Native, outside of US (%) - Asian
Place of birth - Native, outside of US (%) - Hispanic or Latino
Place of birth - Native, outside of US (%) - American Indian and Alaska Native
Place of birth - Native, outside of US (%) - Multirace
Place of birth - Native, outside of US (%) - Other Race
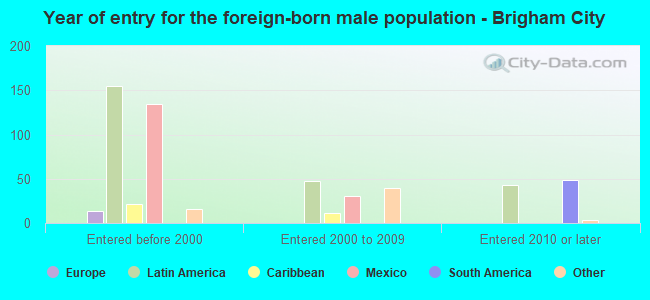
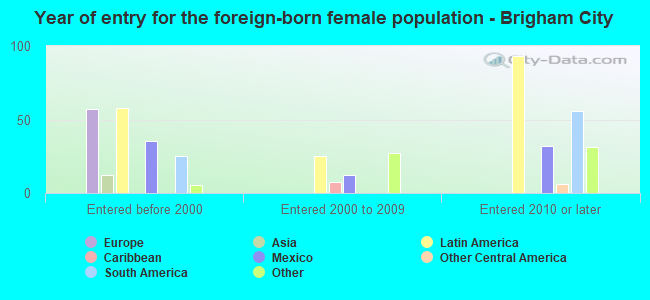
Place of birth - Foreign born (%)
Place of birth - Foreign born (%) - White
Place of birth - Foreign born (%) - Black or African American
Place of birth - Foreign born (%) - Asian
Place of birth - Foreign born (%) - Hispanic or Latino
Place of birth - Foreign born (%) - American Indian and Alaska Native
Place of birth - Foreign born (%) - Multirace
Place of birth - Foreign born (%) - Other Race
Residents speaking English at home (%)
Residents speaking English at home - Born in the United States (%)
Residents speaking English at home - Native, born elsewhere (%)
Residents speaking English at home - Foreign born (%)
Residents speaking Spanish at home (%)
Residents speaking Spanish at home - Born in the United States (%)
Residents speaking Spanish at home - Native, born elsewhere (%)
Residents speaking Spanish at home - Foreign born (%)
Residents speaking other language at home (%)
Residents speaking other language at home - Born in the United States (%)
Residents speaking other language at home - Native, born elsewhere (%)
Residents speaking other language at home - Foreign born (%)
Marital status - Never married (%)
Marital status - Now married (%)
Marital status - Separated (%)
Marital status - Widowed (%)
Marital status - Divorced (%)
Ancestries Reported - Arab (%)
Ancestries Reported - Czech (%)
Ancestries Reported - Danish (%)
Ancestries Reported - Dutch (%)
Ancestries Reported - English (%)
Ancestries Reported - French (%)
Ancestries Reported - French Canadian (%)
Ancestries Reported - German (%)
Ancestries Reported - Greek (%)
Ancestries Reported - Hungarian (%)
Ancestries Reported - Irish (%)
Ancestries Reported - Italian (%)
Ancestries Reported - Lithuanian (%)
Ancestries Reported - Norwegian (%)
Ancestries Reported - Polish (%)
Ancestries Reported - Portuguese (%)
Ancestries Reported - Russian (%)
Ancestries Reported - Scotch-Irish (%)
Ancestries Reported - Scottish (%)
Ancestries Reported - Slovak (%)
Ancestries Reported - Subsaharan African (%)
Ancestries Reported - Swedish (%)
Ancestries Reported - Swiss (%)
Ancestries Reported - Ukrainian (%)
Ancestries Reported - United States (%)
Ancestries Reported - Welsh (%)
Ancestries Reported - West Indian (%)
Ancestries Reported - Other (%)
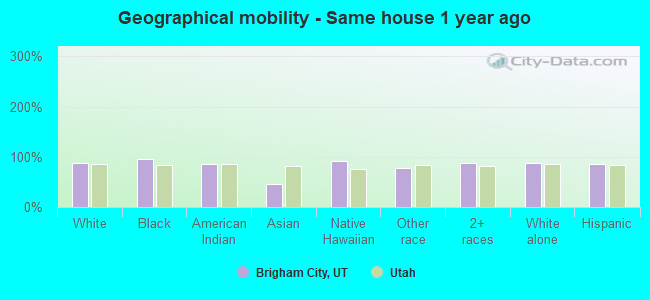
Geographical mobility - Same house 1 year ago (%)
Geographical mobility - Same house 1 year ago (%) - White
Geographical mobility - Same house 1 year ago (%) - Black or African American
Geographical mobility - Same house 1 year ago (%) - Asian
Geographical mobility - Same house 1 year ago (%) - Hispanic or Latino
Geographical mobility - Same house 1 year ago (%) - American Indian and Alaska Native
Geographical mobility - Same house 1 year ago (%) - Multirace
Geographical mobility - Same house 1 year ago (%) - Other Race
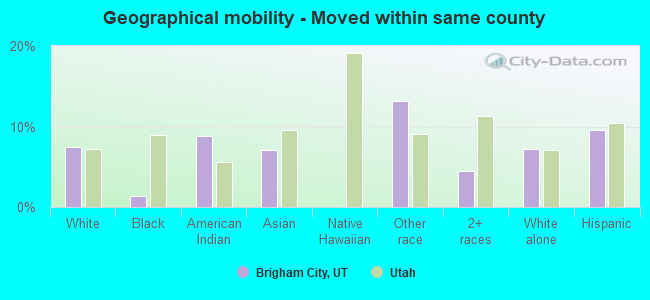
Geographical mobility - Moved within same county (%)
Geographical mobility - Moved within same county (%) - White
Geographical mobility - Moved within same county (%) - Black or African American
Geographical mobility - Moved within same county (%) - Asian
Geographical mobility - Moved within same county (%) - Hispanic or Latino
Geographical mobility - Moved within same county (%) - American Indian and Alaska Native
Geographical mobility - Moved within same county (%) - Multirace
Geographical mobility - Moved within same county (%) - Other Race
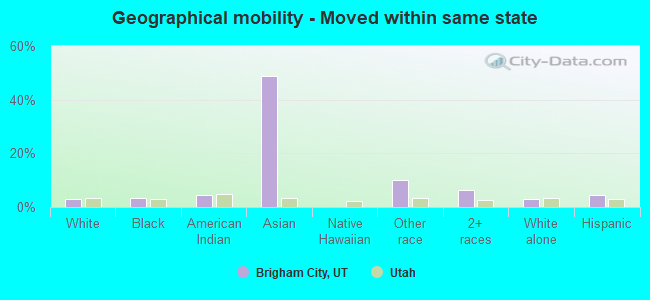
Geographical mobility - Moved from different county within same state (%)
Geographical mobility - Moved from different county within same state (%) - White
Geographical mobility - Moved from different county within same state (%) - Black or African American
Geographical mobility - Moved from different county within same state (%) - Asian
Geographical mobility - Moved from different county within same state (%) - Hispanic or Latino
Geographical mobility - Moved from different county within same state (%) - American Indian and Alaska Native
Geographical mobility - Moved from different county within same state (%) - Multirace
Geographical mobility - Moved from different county within same state (%) - Other Race
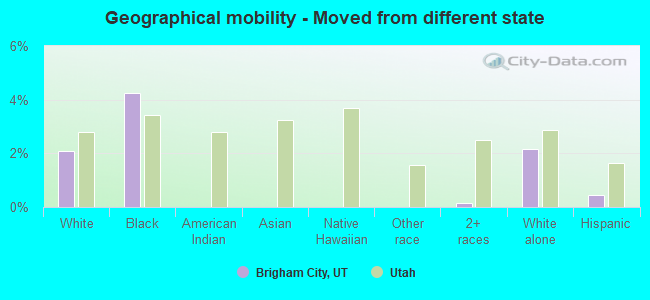
Geographical mobility - Moved from different state (%)
Geographical mobility - Moved from different state (%) - White
Geographical mobility - Moved from different state (%) - Black or African American
Geographical mobility - Moved from different state (%) - Asian
Geographical mobility - Moved from different state (%) - Hispanic or Latino
Geographical mobility - Moved from different state (%) - American Indian and Alaska Native
Geographical mobility - Moved from different state (%) - Multirace
Geographical mobility - Moved from different state (%) - Other Race
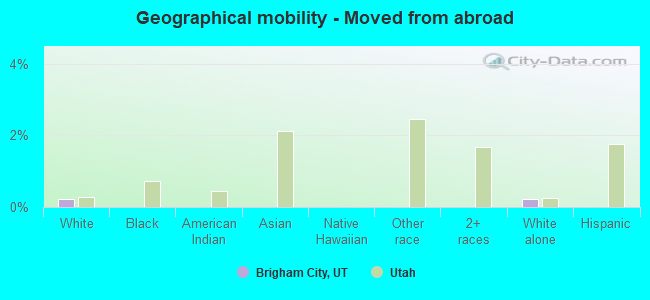
Geographical mobility - Moved from abroad (%)
Geographical mobility - Moved from abroad (%) - White
Geographical mobility - Moved from abroad (%) - Black or African American
Geographical mobility - Moved from abroad (%) - Asian
Geographical mobility - Moved from abroad (%) - Hispanic or Latino
Geographical mobility - Moved from abroad (%) - American Indian and Alaska Native
Geographical mobility - Moved from abroad (%) - Multirace
Geographical mobility - Moved from abroad (%) - Other Race
Place of birth for the foreign-born population - Ireland (%)
Place of birth for the foreign-born population - Denmark (%)
Place of birth for the foreign-born population - Norway (%)
Place of birth for the foreign-born population - Sweden (%)
Place of birth for the foreign-born population - United Kingdom (%)
Place of birth for the foreign-born population - England (%)
Place of birth for the foreign-born population - Scotland (%)
Place of birth for the foreign-born population - Other Northern Europe (%)
Place of birth for the foreign-born population - Austria (%)
Place of birth for the foreign-born population - Belgium (%)
Place of birth for the foreign-born population - France (%)
Place of birth for the foreign-born population - Germany (%)
Place of birth for the foreign-born population - Netherlands (%)
Place of birth for the foreign-born population - Switzerland (%)
Place of birth for the foreign-born population - Other Western Europe (%)
Place of birth for the foreign-born population - Greece (%)
Place of birth for the foreign-born population - Italy (%)
Place of birth for the foreign-born population - Portugal (%)
Place of birth for the foreign-born population - Spain (%)
Place of birth for the foreign-born population - Other Southern Europe (%)
Place of birth for the foreign-born population - Albania (%)
Place of birth for the foreign-born population - Belarus (%)
Place of birth for the foreign-born population - Bosnia and Herzegovina (%)
Place of birth for the foreign-born population - Bulgaria (%)
Place of birth for the foreign-born population - Croatia (%)
Place of birth for the foreign-born population - Czechoslovakia (%)
Place of birth for the foreign-born population - Hungary (%)
Place of birth for the foreign-born population - Latvia (%)
Place of birth for the foreign-born population - Lithuania (%)
Place of birth for the foreign-born population - North Macedonia (Macedonia) (%)
Place of birth for the foreign-born population - Moldova (%)
Place of birth for the foreign-born population - Poland (%)
Place of birth for the foreign-born population - Romania (%)
Place of birth for the foreign-born population - Russia (%)
Place of birth for the foreign-born population - Serbia (%)
Place of birth for the foreign-born population - Ukraine (%)
Place of birth for the foreign-born population - Other Eastern Europe (%)
Place of birth for the foreign-born population - China (%)
Place of birth for the foreign-born population - Hong Kong (%)
Place of birth for the foreign-born population - Taiwan (%)
Place of birth for the foreign-born population - Japan (%)
Place of birth for the foreign-born population - Korea (%)
Place of birth for the foreign-born population - Other Eastern Asia (%)
Place of birth for the foreign-born population - Afghanistan (%)
Place of birth for the foreign-born population - Bangladesh (%)
Place of birth for the foreign-born population - India (%)
Place of birth for the foreign-born population - Iran (%)
Place of birth for the foreign-born population - Kazakhstan (%)
Place of birth for the foreign-born population - Nepal (%)
Place of birth for the foreign-born population - Pakistan (%)
Place of birth for the foreign-born population - Sri Lanka (%)
Place of birth for the foreign-born population - Uzbekistan (%)
Place of birth for the foreign-born population - Other South Central Asia (%)
Place of birth for the foreign-born population - Burma (%)
Place of birth for the foreign-born population - Cambodia (%)
Place of birth for the foreign-born population - Indonesia (%)
Place of birth for the foreign-born population - Laos (%)
Place of birth for the foreign-born population - Malaysia (%)
Place of birth for the foreign-born population - Philippines (%)
Place of birth for the foreign-born population - Singapore (%)
Place of birth for the foreign-born population - Thailand (%)
Place of birth for the foreign-born population - Vietnam (%)
Place of birth for the foreign-born population - Other South Eastern Asia (%)
Place of birth for the foreign-born population - Armenia (%)
Place of birth for the foreign-born population - Iraq (%)
Place of birth for the foreign-born population - Israel (%)
Place of birth for the foreign-born population - Jordan (%)
Place of birth for the foreign-born population - Kuwait (%)
Place of birth for the foreign-born population - Lebanon (%)
Place of birth for the foreign-born population - Saudi Arabia (%)
Place of birth for the foreign-born population - Syria (%)
Place of birth for the foreign-born population - Turkey (%)
Place of birth for the foreign-born population - Yemen (%)
Place of birth for the foreign-born population - Other Western Asia (%)
Place of birth for the foreign-born population - Eritrea (%)
Place of birth for the foreign-born population - Ethiopia (%)
Place of birth for the foreign-born population - Kenya (%)
Place of birth for the foreign-born population - Somalia (%)
Place of birth for the foreign-born population - Uganda (%)
Place of birth for the foreign-born population - Zimbabwe (%)
Place of birth for the foreign-born population - Other Eastern Africa (%)
Place of birth for the foreign-born population - Cameroon (%)
Place of birth for the foreign-born population - Congo (%)
Place of birth for the foreign-born population - Democratic Republic of Congo (Zaire) (%)
Place of birth for the foreign-born population - Other Middle Africa (%)
Place of birth for the foreign-born population - Egypt (%)
Place of birth for the foreign-born population - Morocco (%)
Place of birth for the foreign-born population - Sudan (%)
Place of birth for the foreign-born population - Other Northern Africa (%)
Place of birth for the foreign-born population - South Africa (%)
Place of birth for the foreign-born population - Other Southern Africa (%)
Place of birth for the foreign-born population - Cabo Verde (%)
Place of birth for the foreign-born population - Ghana (%)
Place of birth for the foreign-born population - Liberia (%)
Place of birth for the foreign-born population - Nigeria (%)
Place of birth for the foreign-born population - Senegal (%)
Place of birth for the foreign-born population - Sierra Leone (%)
Place of birth for the foreign-born population - Other Western Africa (%)
Place of birth for the foreign-born population - Australia (%)
Place of birth for the foreign-born population - New Zealand (%)
Place of birth for the foreign-born population - Fiji (%)
Place of birth for the foreign-born population - Micronesia (%)
Place of birth for the foreign-born population - Bahamas (%)
Place of birth for the foreign-born population - Barbados (%)
Place of birth for the foreign-born population - Cuba (%)
Place of birth for the foreign-born population - Dominica (%)
Place of birth for the foreign-born population - Dominican Republic (%)
Place of birth for the foreign-born population - Grenada (%)
Place of birth for the foreign-born population - Haiti (%)
Place of birth for the foreign-born population - Jamaica (%)
Place of birth for the foreign-born population - St. Vincent and the Grenadines (%)
Place of birth for the foreign-born population - Trinidad and Tobago (%)
Place of birth for the foreign-born population - West Indies (%)
Place of birth for the foreign-born population - Other Caribbean (%)
Place of birth for the foreign-born population - Belize (%)
Place of birth for the foreign-born population - Costa Rica (%)
Place of birth for the foreign-born population - El Salvador (%)
Place of birth for the foreign-born population - Guatemala (%)
Place of birth for the foreign-born population - Honduras (%)
Place of birth for the foreign-born population - Mexico (%)
Place of birth for the foreign-born population - Nicaragua (%)
Place of birth for the foreign-born population - Panama (%)
Place of birth for the foreign-born population - Other Central America (%)
Place of birth for the foreign-born population - Argentina (%)
Place of birth for the foreign-born population - Bolivia (%)
Place of birth for the foreign-born population - Brazil (%)
Place of birth for the foreign-born population - Chile (%)
Place of birth for the foreign-born population - Colombia (%)
Place of birth for the foreign-born population - Ecuador (%)
Place of birth for the foreign-born population - Guyana (%)
Place of birth for the foreign-born population - Peru (%)
Place of birth for the foreign-born population - Uruguay (%)
Place of birth for the foreign-born population - Venezuela (%)
Place of birth for the foreign-born population - Other South America (%)
Place of birth for the foreign-born population - Canada (%)
Place of birth for the foreign-born population - Other Northern America (%)
Place of birth for the foreign-born population - Other (%)
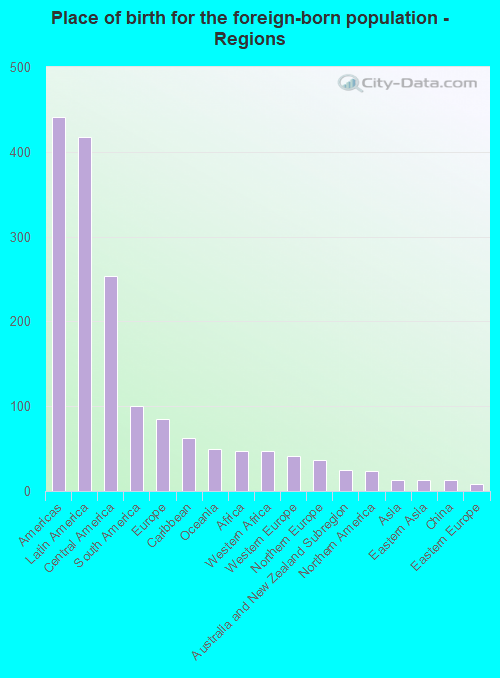
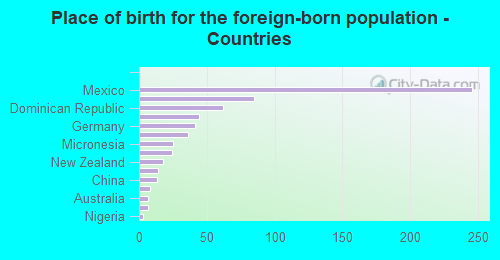
According to 2022 data, the most numerous races in Brigham City, UT are White alone (16,541 residents), Hispanic (2,194 residents), and Two or more races (791 residents). 92.5% of Brigham City residents speak English at home. 3.2% of Brigham City, UT residents are foreign-born (2.0% born in Latin America, 0.4% born in Europe), which is 152.7% less than the foreign-born rate of 8.0% across the entire state of Utah.
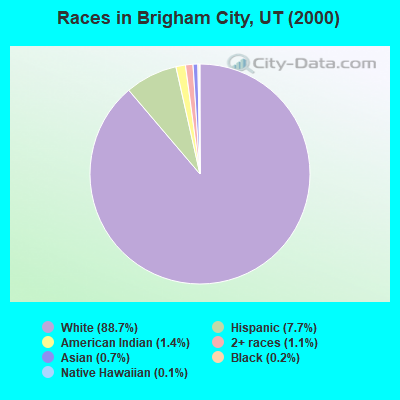
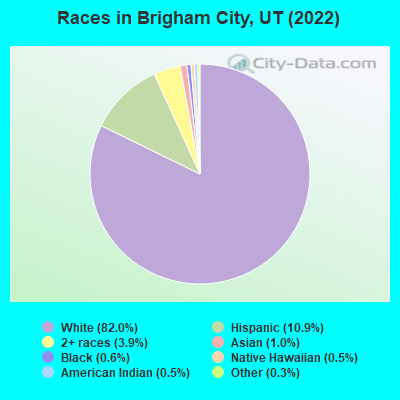
Race distribution in Brigham City
2000 2022
1,904,265 85.3% White alone 201,559 9.0% Hispanic 36,483 1.6% Asian alone 31,308 1.4% Two or more races 26,663 1.2% American Indian alone 14,806 0.7% Native Hawaiian and Other 16,137 0.7% Black alone 1,948 0.09% Other race alone
2,557,466 75.6% White alone 512,086 15.1% Hispanic 119,308 3.5% Two or more races 82,388 2.4% Asian alone 36,978 1.1% Native Hawaiian and Other 34,873 1.0% Black alone 22,803 0.7% American Indian alone 14,898 0.4% Other race alone
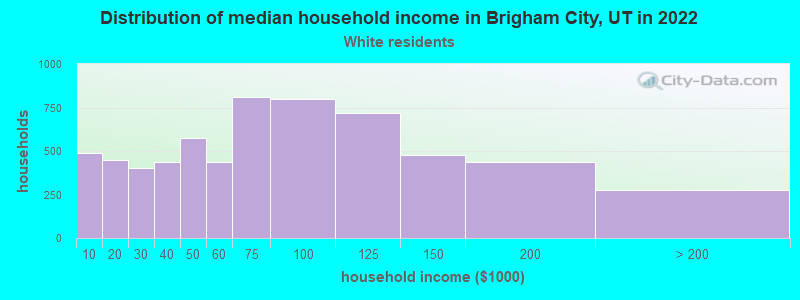
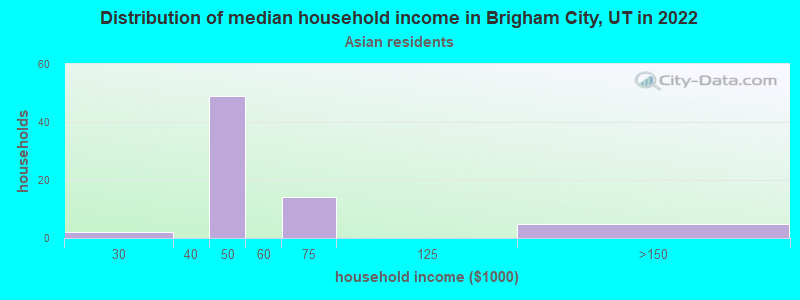
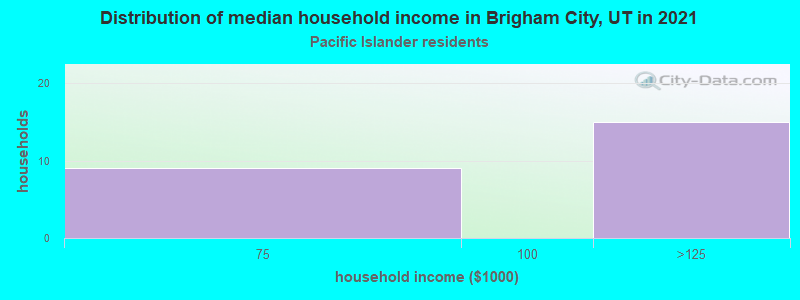
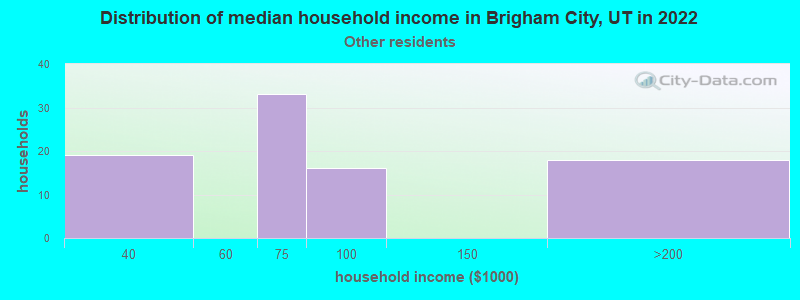
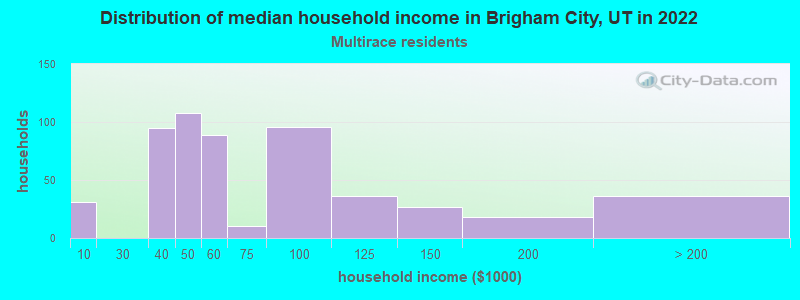
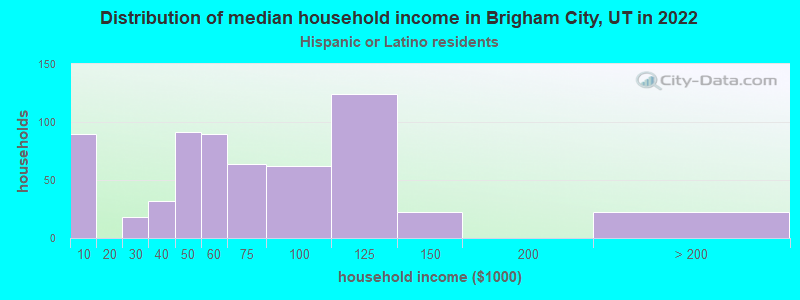
Income and house value in Brigham City Median household income in 2022 $65,588 White non-Hispanic householders$51,603 Asian householders$125,465 Native Hawaiian and other Pacific Islander householders$73,605 Some other race householders$49,824 Two or more races householders$58,035 Hispanic or Latino race householdersMedian 2022 house value $347,127 White Non-Hispanic householders$326,389 American Indian or Alaska Native householders $342,018 Asian householders$265,078 Some other race householders$271,690 Two or more races householders$276,199 Hispanic or Latino householders
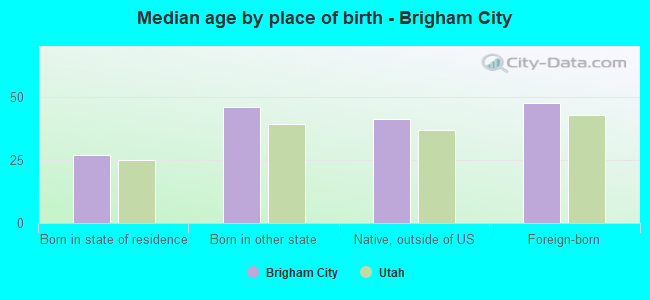
Median age by race in Brigham City
35.2 Median age for White residents35.7 35.1 16.3 Median age for Black or African American residents16.3 -686,357,242.6 36.7 Median age for American Indian / Alaska Native residents16.1 36.4 28.7 Median age for Asian residents26.8 53.9 28.1 Median age for Native Hawaiian / Pacific Islander residents23.8 28.3 26.1 Median age for Other race residents26.9 26.5 20.5 Median age for Two or more races residents17.6 20.9 35.6 Median age for White alone residents36.4 35.1 22.6 Median age for Hispanic or Latino residents16.5 24.6
Owner/renter occupied households by race in Brigham City
House owners and renters - White residents 4,268 66.9% Owner occupied2,114 33.1% Renter occupiedHouse owners and renters - Black or African American residents 20 100.0% Owner occupiedHouse owners and renters - American Indian / Alaska Native residents 22 100.0% Renter occupiedHouse owners and renters - Asian residents 16 22.1% Owner occupied57 77.9% Renter occupiedHouse owners and renters - Native Hawaiian / Pacific Islander residents 7 34.0% Owner occupied14 66.0% Renter occupiedHouse owners and renters - Other race residents 62 78.1% Owner occupied17 21.9% Renter occupiedHouse owners and renters - Two or more races residents 243 41.7% Owner occupied340 58.3% Renter occupiedHouse owners and renters - White alone residents 4,177 67.5% Owner occupied2,011 32.5% Renter occupiedHouse owners and renters - Hispanic or Latino residents 280 44.6% Owner occupied348 55.4% Renter occupied
Language usage in Brigham City
English speakers - Total 92.5% of residents of Brigham City speak English at home.
5.4% of residents speak Spanish at home 592 58.6% Speak English very well419 41.4% Speak English less than very well1.9% of residents speak other language at home 317 89.5% Speak English very well37 10.5% Speak English less than very well
English speakers - Born in the United States 96.5% of residents of Brigham City speak English at home.
2.9% of residents speak Spanish at home 95 62.9% Speak English very well56 37.1% Speak English less than very well0.6% of residents speak other language at home 34 100.0% Speak English very well
English speakers - Native, born elsewhere 89.0% of residents of Brigham City speak English at home.
1.9% of residents speak Spanish at home 3 100.0% Speak English very well6.5% of residents speak other language at home 10 100.0% Speak English very well
English speakers - Foreign-born 30.8% of residents of Brigham City speak English at home.
62.6% of residents speak Spanish at home 118 29.5% Speak English very well282 70.5% Speak English less than very well7.4% of residents speak other language at home 42 89.4% Speak English very well5 10.6% Speak English less than very well
White (Caucasian) - Speak only English Native:
97.4% (15,550)Foreign-born:
78.8% (99)
White (Caucasian) - Speak another language Native:
2.9% (467)Foreign-born:
36.0% (45)
Black or African American - Speak only English Native:
91.5% (63)Foreign-born:
65.4% (47)
Asian - Speak only English Native:
90.5% (140)Foreign-born:
35.0% (15)
Native Hawaiian / Pacific Islander - Speak another language Native:
42.2% (32)Foreign-born:
100.0% (27)
Other race - Speak another language Native:
32.4% (79)Foreign-born:
97.1% (93)
Two or more races - Speak only English Native:
81.8% (1,259)Foreign-born:
7.0% (22)
Two or more races - Speak another language Native:
17.8% (274)Foreign-born:
93.9% (299)
White alone - Speak only English Native:
96.9% (14,913)Foreign-born:
86.7% (110)
White alone - Speak another language Native:
3.1% (477)Foreign-born:
16.4% (21)
Hispanic or Latino - Speak only English Native:
83.6% (1,335)Foreign-born:
5.5% (23)
Hispanic or Latino - Speak another language Native:
17.4% (278)Foreign-born:
94.4% (396)
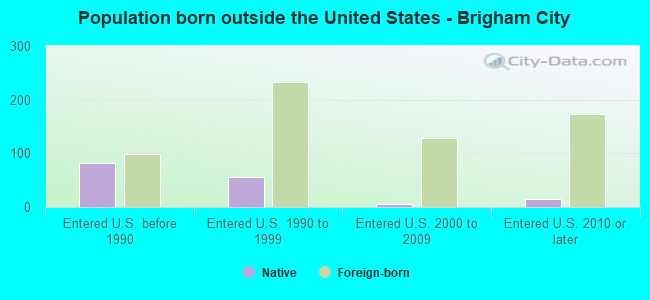
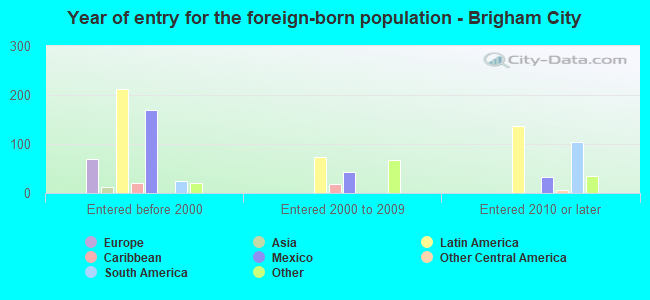
Foreign-born residents in Brigham City 639 residents are foreign born (2.0% Latin America , 0.4% Europe ).
Marital status for residents in Brigham City Marital status - White (Caucasian) population 15 years and over
Males 29.3% Never married55.8% Now married2.4% Separated2.6% Widowed9.9% DivorcedFemales 24.6% Never married53.8% Now married0.4% Separated8.2% Widowed12.9% DivorcedWomen who gave birth in the past 12 months Now married:
65.6% (128)Unmarried:
34.4% (67)
Women who did not give birth in the past 12 months Now married:
52.2% (2,184)Unmarried:
47.8% (1,999)
Marital status - Black or African American population 15 years and over
Males 56.0% Never married21.1% Now married0.0% Separated22.9% Widowed0.0% DivorcedFemales 60.0% Never married40.0% Now married0.0% Separated0.0% Widowed0.0% DivorcedWomen who did not give birth in the past 12 months Now married:
0.0% (0)Unmarried:
100.0% (23)
Marital status - American Indian / Alaska Native population 15 years and over
Males 66.7% Never married33.3% Now married0.0% Separated0.0% Widowed0.0% DivorcedFemales 0.0% Never married100.0% Now married0.0% Separated0.0% Widowed0.0% DivorcedWomen who did not give birth in the past 12 months Now married:
100.0% (26)Unmarried:
0.0% (0)
Marital status - Asian population 15 years and over
Males 19.5% Never married80.5% Now married0.0% Separated0.0% Widowed0.0% DivorcedFemales 0.0% Never married100.0% Now married0.0% Separated0.0% Widowed0.0% DivorcedWomen who did not give birth in the past 12 months Now married:
100.0% (2)Unmarried:
0.0% (0)
Marital status - Native Hawaiian / Pacific Islander population 15 years and over
Males 51.6% Never married29.0% Now married0.0% Separated0.0% Widowed19.4% DivorcedFemales 23.8% Never married76.2% Now married0.0% Separated0.0% Widowed0.0% DivorcedWomen who did not give birth in the past 12 months Now married:
76.2% (39)Unmarried:
23.8% (12)
Marital status - Other race population 15 years and over
Males 9.9% Never married90.1% Now married0.0% Separated0.0% Widowed0.0% DivorcedFemales 16.5% Never married64.1% Now married19.4% Separated0.0% Widowed0.0% DivorcedWomen who gave birth in the past 12 months Now married:
100.0% (15)Unmarried:
0.0% (0)
Women who did not give birth in the past 12 months Now married:
78.5% (71)Unmarried:
21.5% (20)
Marital status - Two or more races population 15 years and over
Males 41.4% Never married58.6% Now married0.0% Separated0.0% Widowed0.0% DivorcedFemales 52.1% Never married46.6% Now married0.0% Separated0.0% Widowed1.3% DivorcedWomen who gave birth in the past 12 months Now married:
100.0% (17)Unmarried:
0.0% (0)
Women who did not give birth in the past 12 months Now married:
38.4% (243)Unmarried:
61.6% (390)
Marital status - White alone, not Hispanic / Latino population 15 years and over
Males 28.4% Never married56.6% Now married2.5% Separated2.6% Widowed10.0% DivorcedFemales 24.5% Never married54.2% Now married0.2% Separated8.7% Widowed12.3% DivorcedWomen who gave birth in the past 12 months Now married:
70.7% (131)Unmarried:
29.3% (54)
Women who did not give birth in the past 12 months Now married:
52.3% (2,103)Unmarried:
47.7% (1,917)
Marital status - Hispanic or Latino population 15 years and over
Males 38.9% Never married56.7% Now married0.0% Separated1.4% Widowed3.0% DivorcedFemales 32.6% Never married51.2% Now married4.5% Separated0.0% Widowed11.7% DivorcedWomen who gave birth in the past 12 months Now married:
65.0% (27)Unmarried:
35.0% (15)
Women who did not give birth in the past 12 months Now married:
50.3% (308)Unmarried:
49.7% (304)
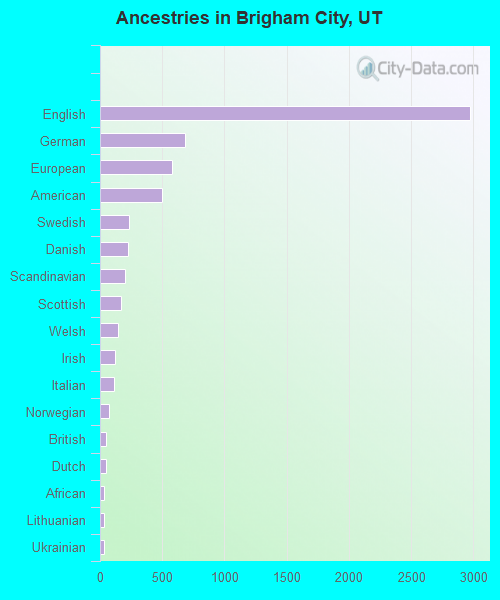
Ancestries in Brigham City
2,978 34.6% English686 8.0% German579 6.7% European499 5.8% American230 2.7% Swedish228 2.6% Danish197 2.3% Scandinavian167 1.9% Scottish141 1.6% Welsh121 1.4% Irish115 1.3% Italian74 0.9% Norwegian48 0.6% British46 0.5% Dutch34 0.4% African31 0.4% Lithuanian29 0.3% Ukrainian24 0.3% Canadian21 0.2% French18 0.2% Polish14 0.2% Russian12 0.1% Swiss6 0.07% Romanian4 0.05% Northern European4 0.05% Portuguese4 0.05% Slovak1 0.01% Icelander
Geographical mobility in Brigham City Same house 1 year ago 14,669 87.2% White (Caucasian)140 95.5% Black or African American98 84.8% American Indian / Alaska Native107 45.7% Asian93 92.6% Native Hawaiian / Pacific Islander268 76.7% Other race1,883 88.5% Two or more races14,330 87.3% White alone, not Hispanic / Latino1,848 85.6% Hispanic or LatinoMoved within same county 1,245 7.4% White / Caucasian2 1.4% Black or African American10 8.8% American Indian / Alaska Native17 7.1% Asian46 13.1% Other race94 4.4% Two or more races1,184 7.2% White alone, not Hispanic / Latino206 9.6% Hispanic or LatinoMoved within same state 529 3.1% White / Caucasian5 3.3% Black or African American5 4.7% American Indian / Alaska Native114 48.8% Asian35 10.0% Other race136 6.4% Two or more races514 3.1% White alone, not Hispanic / Latino99 4.6% Hispanic or LatinoMoved from different state 352 2.1% White / Caucasian6 4.3% Black or African American3 0.1% Two or more races352 2.1% White alone, not Hispanic / Latino10 0.5% Hispanic or LatinoMoved from abroad 36 0.2% White37 0.2% White alone, not Hispanic / Latino
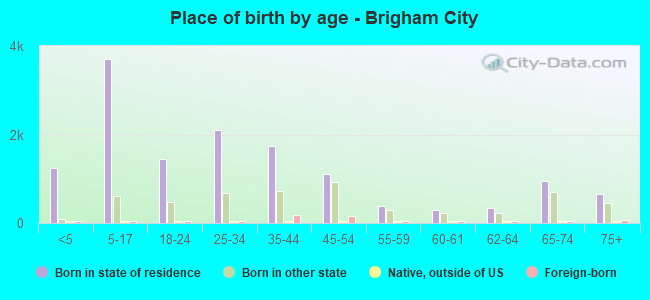
Children Nativity (place of birth) in Brigham City
Children under 6 years - Living with two parents Both parents native 1,421 100.0% NativeBoth parents foreign-born 4 100.0% NativeOne native, one foreign-born parent 15 100.0% NativeChildren under 6 years - Living with one parent Native parent 264 100.0% NativeChildren 6 to 17 years - Living with two parents Both parents native 2,841 98.8% Native35 1.2% Foreign-bornBoth parents foreign-born 110 89.7% Native13 10.3% Foreign-bornOne native, one foreign-born parent 77 100.0% NativeChildren 6 to 17 years - Living with one parent Native parent 736 100.0% NativeForeign-born parent 75 50.7% Native73 49.3% Foreign-born
Grandparents responsible for own grandchildren in Brigham City
Grandparents (30 to 59 years) White / Caucasian 17 21.8% Responsible for grandchildren61 78.2% Not responsible for grandchildrenAsian 5 100.0% Responsible for grandchildrenWhite alone, not Hispanic / Latino 19 22.7% Responsible for grandchildren64 77.3% Not responsible for grandchildrenHispanic or Latino 3 100.0% Responsible for grandchildrenGrandparents (60 years and over) White / Caucasian 29 10.2% Responsible for grandchildren257 89.8% Not responsible for grandchildrenWhite alone, not Hispanic / Latino 29 11.7% Responsible for grandchildren222 88.3% Not responsible for grandchildrenHispanic or Latino 52 100.0% Not responsible for grandchildren