Races in Bridgeport, Connecticut (CT) Detailed Stats
Data:
Races - White alone (%)
Races - White alone (% change since 2000)
Races - Black alone (%)
Races - Black alone (% change since 2000)
Races - American Indian alone (%)
Races - American Indian alone (% change since 2000)
Races - Asian alone (%)
Races - Asian alone (% change since 2000)
Races - Hispanic (%)
Races - Hispanic (% change since 2000)
Races - Native Hawaiian and Other Pacific Islander alone (%)
Races - Native Hawaiian and Other Pacific Islander alone (% change since 2000)
Races - Two or more races(%)
Races - Two or more races(% change since 2000)
Races - Other race alone (%)
Races - Other race alone (% change since 2000)
Racial diversity
Place of birth - Born in state of residence (%)
Place of birth - Born in state of residence (%) - White
Place of birth - Born in state of residence (%) - Black or African American
Place of birth - Born in state of residence (%) - Asian
Place of birth - Born in state of residence (%) - Hispanic or Latino
Place of birth - Born in state of residence (%) - American Indian and Alaska Native
Place of birth - Born in state of residence (%) - Multirace
Place of birth - Born in state of residence (%) - Other Race
Place of birth - Born in other state (%)
Place of birth - Born in other state (%) - White
Place of birth - Born in other state (%) - Black or African American
Place of birth - Born in other state (%) - Asian
Place of birth - Born in other state (%) - Hispanic or Latino
Place of birth - Born in other state (%) - American Indian and Alaska Native
Place of birth - Born in other state (%) - Multirace
Place of birth - Born in other state (%) - Other Race
Place of birth - Native, outside of US (%)
Place of birth - Native, outside of US (%) - White
Place of birth - Native, outside of US (%) - Black or African American
Place of birth - Native, outside of US (%) - Asian
Place of birth - Native, outside of US (%) - Hispanic or Latino
Place of birth - Native, outside of US (%) - American Indian and Alaska Native
Place of birth - Native, outside of US (%) - Multirace
Place of birth - Native, outside of US (%) - Other Race
Place of birth - Foreign born (%)
Place of birth - Foreign born (%) - White
Place of birth - Foreign born (%) - Black or African American
Place of birth - Foreign born (%) - Asian
Place of birth - Foreign born (%) - Hispanic or Latino
Place of birth - Foreign born (%) - American Indian and Alaska Native
Place of birth - Foreign born (%) - Multirace
Place of birth - Foreign born (%) - Other Race
Residents speaking English at home (%)
Residents speaking English at home - Born in the United States (%)
Residents speaking English at home - Native, born elsewhere (%)
Residents speaking English at home - Foreign born (%)
Residents speaking Spanish at home (%)
Residents speaking Spanish at home - Born in the United States (%)
Residents speaking Spanish at home - Native, born elsewhere (%)
Residents speaking Spanish at home - Foreign born (%)
Residents speaking other language at home (%)
Residents speaking other language at home - Born in the United States (%)
Residents speaking other language at home - Native, born elsewhere (%)
Residents speaking other language at home - Foreign born (%)
Marital status - Never married (%)
Marital status - Now married (%)
Marital status - Separated (%)
Marital status - Widowed (%)
Marital status - Divorced (%)
Ancestries Reported - Arab (%)
Ancestries Reported - Czech (%)
Ancestries Reported - Danish (%)
Ancestries Reported - Dutch (%)
Ancestries Reported - English (%)
Ancestries Reported - French (%)
Ancestries Reported - French Canadian (%)
Ancestries Reported - German (%)
Ancestries Reported - Greek (%)
Ancestries Reported - Hungarian (%)
Ancestries Reported - Irish (%)
Ancestries Reported - Italian (%)
Ancestries Reported - Lithuanian (%)
Ancestries Reported - Norwegian (%)
Ancestries Reported - Polish (%)
Ancestries Reported - Portuguese (%)
Ancestries Reported - Russian (%)
Ancestries Reported - Scotch-Irish (%)
Ancestries Reported - Scottish (%)
Ancestries Reported - Slovak (%)
Ancestries Reported - Subsaharan African (%)
Ancestries Reported - Swedish (%)
Ancestries Reported - Swiss (%)
Ancestries Reported - Ukrainian (%)
Ancestries Reported - United States (%)
Ancestries Reported - Welsh (%)
Ancestries Reported - West Indian (%)
Ancestries Reported - Other (%)
Geographical mobility - Same house 1 year ago (%)
Geographical mobility - Same house 1 year ago (%) - White
Geographical mobility - Same house 1 year ago (%) - Black or African American
Geographical mobility - Same house 1 year ago (%) - Asian
Geographical mobility - Same house 1 year ago (%) - Hispanic or Latino
Geographical mobility - Same house 1 year ago (%) - American Indian and Alaska Native
Geographical mobility - Same house 1 year ago (%) - Multirace
Geographical mobility - Same house 1 year ago (%) - Other Race
Geographical mobility - Moved within same county (%)
Geographical mobility - Moved within same county (%) - White
Geographical mobility - Moved within same county (%) - Black or African American
Geographical mobility - Moved within same county (%) - Asian
Geographical mobility - Moved within same county (%) - Hispanic or Latino
Geographical mobility - Moved within same county (%) - American Indian and Alaska Native
Geographical mobility - Moved within same county (%) - Multirace
Geographical mobility - Moved within same county (%) - Other Race
Geographical mobility - Moved from different county within same state (%)
Geographical mobility - Moved from different county within same state (%) - White
Geographical mobility - Moved from different county within same state (%) - Black or African American
Geographical mobility - Moved from different county within same state (%) - Asian
Geographical mobility - Moved from different county within same state (%) - Hispanic or Latino
Geographical mobility - Moved from different county within same state (%) - American Indian and Alaska Native
Geographical mobility - Moved from different county within same state (%) - Multirace
Geographical mobility - Moved from different county within same state (%) - Other Race
Geographical mobility - Moved from different state (%)
Geographical mobility - Moved from different state (%) - White
Geographical mobility - Moved from different state (%) - Black or African American
Geographical mobility - Moved from different state (%) - Asian
Geographical mobility - Moved from different state (%) - Hispanic or Latino
Geographical mobility - Moved from different state (%) - American Indian and Alaska Native
Geographical mobility - Moved from different state (%) - Multirace
Geographical mobility - Moved from different state (%) - Other Race
Geographical mobility - Moved from abroad (%)
Geographical mobility - Moved from abroad (%) - White
Geographical mobility - Moved from abroad (%) - Black or African American
Geographical mobility - Moved from abroad (%) - Asian
Geographical mobility - Moved from abroad (%) - Hispanic or Latino
Geographical mobility - Moved from abroad (%) - American Indian and Alaska Native
Geographical mobility - Moved from abroad (%) - Multirace
Geographical mobility - Moved from abroad (%) - Other Race
Place of birth for the foreign-born population - Ireland (%)
Place of birth for the foreign-born population - Denmark (%)
Place of birth for the foreign-born population - Norway (%)
Place of birth for the foreign-born population - Sweden (%)
Place of birth for the foreign-born population - United Kingdom (%)
Place of birth for the foreign-born population - England (%)
Place of birth for the foreign-born population - Scotland (%)
Place of birth for the foreign-born population - Other Northern Europe (%)
Place of birth for the foreign-born population - Austria (%)
Place of birth for the foreign-born population - Belgium (%)
Place of birth for the foreign-born population - France (%)
Place of birth for the foreign-born population - Germany (%)
Place of birth for the foreign-born population - Netherlands (%)
Place of birth for the foreign-born population - Switzerland (%)
Place of birth for the foreign-born population - Other Western Europe (%)
Place of birth for the foreign-born population - Greece (%)
Place of birth for the foreign-born population - Italy (%)
Place of birth for the foreign-born population - Portugal (%)
Place of birth for the foreign-born population - Spain (%)
Place of birth for the foreign-born population - Other Southern Europe (%)
Place of birth for the foreign-born population - Albania (%)
Place of birth for the foreign-born population - Belarus (%)
Place of birth for the foreign-born population - Bosnia and Herzegovina (%)
Place of birth for the foreign-born population - Bulgaria (%)
Place of birth for the foreign-born population - Croatia (%)
Place of birth for the foreign-born population - Czechoslovakia (%)
Place of birth for the foreign-born population - Hungary (%)
Place of birth for the foreign-born population - Latvia (%)
Place of birth for the foreign-born population - Lithuania (%)
Place of birth for the foreign-born population - North Macedonia (Macedonia) (%)
Place of birth for the foreign-born population - Moldova (%)
Place of birth for the foreign-born population - Poland (%)
Place of birth for the foreign-born population - Romania (%)
Place of birth for the foreign-born population - Russia (%)
Place of birth for the foreign-born population - Serbia (%)
Place of birth for the foreign-born population - Ukraine (%)
Place of birth for the foreign-born population - Other Eastern Europe (%)
Place of birth for the foreign-born population - China (%)
Place of birth for the foreign-born population - Hong Kong (%)
Place of birth for the foreign-born population - Taiwan (%)
Place of birth for the foreign-born population - Japan (%)
Place of birth for the foreign-born population - Korea (%)
Place of birth for the foreign-born population - Other Eastern Asia (%)
Place of birth for the foreign-born population - Afghanistan (%)
Place of birth for the foreign-born population - Bangladesh (%)
Place of birth for the foreign-born population - India (%)
Place of birth for the foreign-born population - Iran (%)
Place of birth for the foreign-born population - Kazakhstan (%)
Place of birth for the foreign-born population - Nepal (%)
Place of birth for the foreign-born population - Pakistan (%)
Place of birth for the foreign-born population - Sri Lanka (%)
Place of birth for the foreign-born population - Uzbekistan (%)
Place of birth for the foreign-born population - Other South Central Asia (%)
Place of birth for the foreign-born population - Burma (%)
Place of birth for the foreign-born population - Cambodia (%)
Place of birth for the foreign-born population - Indonesia (%)
Place of birth for the foreign-born population - Laos (%)
Place of birth for the foreign-born population - Malaysia (%)
Place of birth for the foreign-born population - Philippines (%)
Place of birth for the foreign-born population - Singapore (%)
Place of birth for the foreign-born population - Thailand (%)
Place of birth for the foreign-born population - Vietnam (%)
Place of birth for the foreign-born population - Other South Eastern Asia (%)
Place of birth for the foreign-born population - Armenia (%)
Place of birth for the foreign-born population - Iraq (%)
Place of birth for the foreign-born population - Israel (%)
Place of birth for the foreign-born population - Jordan (%)
Place of birth for the foreign-born population - Kuwait (%)
Place of birth for the foreign-born population - Lebanon (%)
Place of birth for the foreign-born population - Saudi Arabia (%)
Place of birth for the foreign-born population - Syria (%)
Place of birth for the foreign-born population - Turkey (%)
Place of birth for the foreign-born population - Yemen (%)
Place of birth for the foreign-born population - Other Western Asia (%)
Place of birth for the foreign-born population - Eritrea (%)
Place of birth for the foreign-born population - Ethiopia (%)
Place of birth for the foreign-born population - Kenya (%)
Place of birth for the foreign-born population - Somalia (%)
Place of birth for the foreign-born population - Uganda (%)
Place of birth for the foreign-born population - Zimbabwe (%)
Place of birth for the foreign-born population - Other Eastern Africa (%)
Place of birth for the foreign-born population - Cameroon (%)
Place of birth for the foreign-born population - Congo (%)
Place of birth for the foreign-born population - Democratic Republic of Congo (Zaire) (%)
Place of birth for the foreign-born population - Other Middle Africa (%)
Place of birth for the foreign-born population - Egypt (%)
Place of birth for the foreign-born population - Morocco (%)
Place of birth for the foreign-born population - Sudan (%)
Place of birth for the foreign-born population - Other Northern Africa (%)
Place of birth for the foreign-born population - South Africa (%)
Place of birth for the foreign-born population - Other Southern Africa (%)
Place of birth for the foreign-born population - Cabo Verde (%)
Place of birth for the foreign-born population - Ghana (%)
Place of birth for the foreign-born population - Liberia (%)
Place of birth for the foreign-born population - Nigeria (%)
Place of birth for the foreign-born population - Senegal (%)
Place of birth for the foreign-born population - Sierra Leone (%)
Place of birth for the foreign-born population - Other Western Africa (%)
Place of birth for the foreign-born population - Australia (%)
Place of birth for the foreign-born population - New Zealand (%)
Place of birth for the foreign-born population - Fiji (%)
Place of birth for the foreign-born population - Micronesia (%)
Place of birth for the foreign-born population - Bahamas (%)
Place of birth for the foreign-born population - Barbados (%)
Place of birth for the foreign-born population - Cuba (%)
Place of birth for the foreign-born population - Dominica (%)
Place of birth for the foreign-born population - Dominican Republic (%)
Place of birth for the foreign-born population - Grenada (%)
Place of birth for the foreign-born population - Haiti (%)
Place of birth for the foreign-born population - Jamaica (%)
Place of birth for the foreign-born population - St. Vincent and the Grenadines (%)
Place of birth for the foreign-born population - Trinidad and Tobago (%)
Place of birth for the foreign-born population - West Indies (%)
Place of birth for the foreign-born population - Other Caribbean (%)
Place of birth for the foreign-born population - Belize (%)
Place of birth for the foreign-born population - Costa Rica (%)
Place of birth for the foreign-born population - El Salvador (%)
Place of birth for the foreign-born population - Guatemala (%)
Place of birth for the foreign-born population - Honduras (%)
Place of birth for the foreign-born population - Mexico (%)
Place of birth for the foreign-born population - Nicaragua (%)
Place of birth for the foreign-born population - Panama (%)
Place of birth for the foreign-born population - Other Central America (%)
Place of birth for the foreign-born population - Argentina (%)
Place of birth for the foreign-born population - Bolivia (%)
Place of birth for the foreign-born population - Brazil (%)
Place of birth for the foreign-born population - Chile (%)
Place of birth for the foreign-born population - Colombia (%)
Place of birth for the foreign-born population - Ecuador (%)
Place of birth for the foreign-born population - Guyana (%)
Place of birth for the foreign-born population - Peru (%)
Place of birth for the foreign-born population - Uruguay (%)
Place of birth for the foreign-born population - Venezuela (%)
Place of birth for the foreign-born population - Other South America (%)
Place of birth for the foreign-born population - Canada (%)
Place of birth for the foreign-born population - Other Northern America (%)
Place of birth for the foreign-born population - Other (%)
Latest news about races in Bridgeport, CT collected exclusively by city-data.com from local newspapers, TV, and radio stations
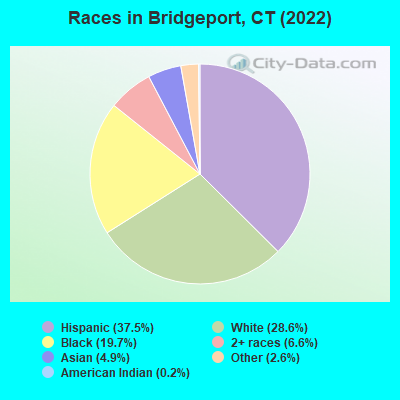
According to 2022 data, the most numerous races in Bridgeport, CT are White alone (42,363 residents), Hispanic (55,606 residents), and Black alone (29,218 residents). 52.9% of Bridgeport residents speak English at home. 32.8% of Bridgeport, CT residents are foreign-born (21.1% born in Latin America, 5.1% born in Asia, 3.9% born in Europe), which is 54.2% greater than the foreign-born rate of 15.0% across the entire state of Connecticut.
Race distribution in Bridgeport
2000 2022
44,478 31.9% Hispanic 43,158 30.9% White alone 40,974 29.4% Black alone 4,788 3.4% Two or more races 4,459 3.2% Asian alone 1,218 0.9% Other race alone 352 0.3% American Indian alone 102 0.07% Native Hawaiian and Other
55,606 37.5% Hispanic 42,363 28.6% White alone 29,218 19.7% Black alone 9,832 6.6% Two or more races 7,198 4.9% Asian alone 3,878 2.6% Other race alone 270 0.2% American Indian alone
2000 2022
2,638,845 77.5% White alone 320,323 9.4% Hispanic 295,571 8.7% Black alone 81,564 2.4% Asian alone 52,896 1.6% Two or more races 8,141 0.2% Other race alone 7,267 0.2% American Indian alone 958 0.03% Native Hawaiian and Other
2,246,913 62.0% White alone 658,978 18.2% Hispanic 353,973 9.8% Black alone 172,929 4.8% Asian alone 159,631 4.4% Two or more races 29,761 0.8% Other race alone 3,428 0.09% American Indian alone 592 0.02% Native Hawaiian and Other
Income and house value in Bridgeport Median household income in 2022 $39,455 White non-Hispanic householders$48,245 Black householders$43,783 American Indian and Alaska Native householders$75,331 Asian householders$41,328 Some other race householders$70,886 Two or more races householders$56,357 Hispanic or Latino race householdersMedian 2022 house value $281,593 White Non-Hispanic householders$248,968 Black or African American householders$318,152 American Indian or Alaska Native householders $312,136 Asian householders$237,168 Some other race householders$278,817 Two or more races householders$249,894 Hispanic or Latino householders
Median age by race in Bridgeport
50.3 Median age for White residents51.9 46.5 34.2 Median age for Black or African American residents33.7 34.6 59.2 Median age for American Indian / Alaska Native residents-666,666,666.0 58.3 39.1 Median age for Asian residents41.1 38.4 -666,666,666.0 Median age for Native Hawaiian / Pacific Islander residents-666,666,666.0 -666,666,666.0 34.1 Median age for Other race residents34.4 33.6 35.3 Median age for Two or more races residents34.7 35.5 55.8 Median age for White alone residents55.2 57.1 33.2 Median age for Hispanic or Latino residents33.5 32.4
Owner/renter occupied households by race in Bridgeport
House owners and renters - White residents 13,716 53.7% Owner occupied11,815 46.3% Renter occupiedHouse owners and renters - Black or African American residents 4,100 39.8% Owner occupied6,193 60.2% Renter occupiedHouse owners and renters - American Indian / Alaska Native residents 147 61.1% Owner occupied94 38.9% Renter occupiedHouse owners and renters - Asian residents 1,764 78.9% Owner occupied472 21.1% Renter occupiedHouse owners and renters - Native Hawaiian / Pacific Islander residents 50 75.0% Owner occupied17 25.0% Renter occupiedHouse owners and renters - Other race residents 3,465 36.5% Owner occupied6,029 63.5% Renter occupiedHouse owners and renters - Two or more races residents 3,270 35.8% Owner occupied5,856 64.2% Renter occupiedHouse owners and renters - White alone residents 12,722 55.1% Owner occupied10,361 44.9% Renter occupiedHouse owners and renters - Hispanic or Latino residents 6,396 38.8% Owner occupied10,087 61.2% Renter occupied
Language usage in Bridgeport
English speakers - Total 52.9% of residents of Bridgeport speak English at home.
31.0% of residents speak Spanish at home 26,358 60.3% Speak English very well17,337 39.7% Speak English less than very well16.1% of residents speak other language at home 11,710 51.5% Speak English very well11,022 48.5% Speak English less than very well
English speakers - Born in the United States 75.7% of residents of Bridgeport speak English at home.
21.6% of residents speak Spanish at home 6,526 92.7% Speak English very well517 7.3% Speak English less than very well2.7% of residents speak other language at home 889 100.0% Speak English very well
English speakers - Native, born elsewhere 19.0% of residents of Bridgeport speak English at home.
78.7% of residents speak Spanish at home 4,923 53.7% Speak English very well4,241 46.3% Speak English less than very well2.3% of residents speak other language at home 80 30.2% Speak English very well185 69.8% Speak English less than very well
English speakers - Foreign-born 23.6% of residents of Bridgeport speak English at home.
34.7% of residents speak Spanish at home 4,512 28.8% Speak English very well11,141 71.2% Speak English less than very well41.7% of residents speak other language at home 8,128 43.2% Speak English very well10,700 56.8% Speak English less than very well
White (Caucasian) - Speak only English Native:
81.9% (34,646)Foreign-born:
19.3% (1,415)
White (Caucasian) - Speak another language Native:
18.1% (7,676)Foreign-born:
80.7% (5,900)
Black or African American - Speak only English Native:
95.5% (18,502)Foreign-born:
69.6% (7,467)
Black or African American - Speak another language Native:
4.5% (867)Foreign-born:
30.4% (3,267)
American Indian / Alaska Native - Speak another language Native:
78.1% (316)Foreign-born:
92.6% (357)
Asian - Speak only English Native:
13.7% (167)Foreign-born:
15.8% (943)
Asian - Speak another language Native:
86.3% (1,055)Foreign-born:
84.2% (5,033)
Native Hawaiian / Pacific Islander - Speak another language Native:
64.1% (47)Foreign-born:
100.0% (76)
Other race - Speak only English Native:
18.9% (3,326)Foreign-born:
4.4% (464)
Other race - Speak another language Native:
81.1% (14,236)Foreign-born:
95.6% (10,015)
Two or more races - Speak only English Native:
47.5% (7,166)Foreign-born:
3.4% (361)
Two or more races - Speak another language Native:
52.5% (7,918)Foreign-born:
96.6% (10,266)
White alone - Speak only English Native:
91.4% (31,745)Foreign-born:
22.1% (1,311)
White alone - Speak another language Native:
8.6% (2,978)Foreign-born:
77.9% (4,634)
Hispanic or Latino - Speak only English Native:
28.8% (10,450)Foreign-born:
3.9% (624)
Hispanic or Latino - Speak another language Native:
71.2% (25,897)Foreign-born:
96.1% (15,263)
Foreign-born residents in Bridgeport 48,842 residents are foreign born (21.1% Latin America , 5.1% Asia , 3.9% Europe ).
This city:
32.8%Connecticut:
15.0%
Marital status for residents in Bridgeport Marital status - White (Caucasian) population 15 years and over
Males 49.2% Never married31.8% Now married0.9% Separated4.4% Widowed13.7% DivorcedFemales 36.6% Never married36.5% Now married6.0% Separated3.0% Widowed17.9% DivorcedWomen who gave birth in the past 12 months Now married:
68.4% (492)Unmarried:
31.6% (228)
Women who did not give birth in the past 12 months Now married:
28.6% (3,915)Unmarried:
71.4% (9,788)
Marital status - Black or African American population 15 years and over
Males 50.0% Never married39.1% Now married2.5% Separated1.9% Widowed6.6% DivorcedFemales 51.9% Never married27.3% Now married4.3% Separated4.8% Widowed11.6% DivorcedWomen who gave birth in the past 12 months Now married:
83.4% (627)Unmarried:
16.6% (125)
Women who did not give birth in the past 12 months Now married:
21.7% (1,821)Unmarried:
78.3% (6,577)
Marital status - American Indian / Alaska Native population 15 years and over
Males 24.6% Never married54.1% Now married0.0% Separated7.2% Widowed14.1% DivorcedFemales 41.3% Never married20.7% Now married2.0% Separated0.0% Widowed36.1% DivorcedWomen who did not give birth in the past 12 months Now married:
18.1% (39)Unmarried:
81.9% (176)
Marital status - Asian population 15 years and over
Males 46.9% Never married48.9% Now married0.0% Separated1.0% Widowed3.2% DivorcedFemales 29.5% Never married61.5% Now married3.8% Separated4.6% Widowed0.7% DivorcedWomen who gave birth in the past 12 months Now married:
56.5% (116)Unmarried:
43.5% (89)
Women who did not give birth in the past 12 months Now married:
61.2% (1,514)Unmarried:
38.8% (961)
Marital status - Native Hawaiian / Pacific Islander population 15 years and over
Males 0.0% Never married100.0% Now married0.0% Separated0.0% Widowed0.0% DivorcedFemales 31.2% Never married68.8% Now married0.0% Separated0.0% Widowed0.0% DivorcedWomen who did not give birth in the past 12 months Now married:
32.4% (13)Unmarried:
67.6% (26)
Marital status - Other race population 15 years and over
Males 53.1% Never married35.6% Now married2.8% Separated1.9% Widowed6.6% DivorcedFemales 47.0% Never married38.8% Now married0.9% Separated9.1% Widowed4.1% DivorcedWomen who gave birth in the past 12 months Now married:
78.1% (328)Unmarried:
21.9% (92)
Women who did not give birth in the past 12 months Now married:
36.5% (2,926)Unmarried:
63.5% (5,085)
Marital status - Two or more races population 15 years and over
Males 42.1% Never married34.0% Now married0.7% Separated2.4% Widowed20.8% DivorcedFemales 34.7% Never married30.6% Now married0.0% Separated6.7% Widowed28.0% DivorcedWomen who gave birth in the past 12 months Now married:
83.5% (137)Unmarried:
16.5% (27)
Women who did not give birth in the past 12 months Now married:
28.5% (1,792)Unmarried:
71.5% (4,493)
Marital status - White alone, not Hispanic / Latino population 15 years and over
Males 46.6% Never married31.6% Now married1.1% Separated5.2% Widowed15.5% DivorcedFemales 31.9% Never married38.2% Now married7.4% Separated3.7% Widowed18.7% DivorcedWomen who gave birth in the past 12 months Now married:
91.9% (472)Unmarried:
8.1% (42)
Women who did not give birth in the past 12 months Now married:
27.0% (2,778)Unmarried:
73.0% (7,522)
Marital status - Hispanic or Latino population 15 years and over
Males 51.1% Never married34.8% Now married0.3% Separated2.2% Widowed11.6% DivorcedFemales 46.5% Never married34.7% Now married1.2% Separated5.4% Widowed12.2% DivorcedWomen who gave birth in the past 12 months Now married:
69.6% (465)Unmarried:
30.4% (203)
Women who did not give birth in the past 12 months Now married:
31.3% (4,466)Unmarried:
68.7% (9,810)
Ancestries in Bridgeport
5,743 6.2% Jamaican5,505 6.0% Brazilian5,272 5.7% Italian2,997 3.2% American2,459 2.7% Haitian2,418 2.6% Irish2,322 2.5% Portuguese1,446 1.6% Polish989 1.1% English951 1.0% Greek831 0.9% German615 0.7% Hungarian577 0.6% Cape Verdean491 0.5% Russian422 0.5% Ghanaian405 0.4% French404 0.4% Slovak394 0.4% Ukrainian371 0.4% European358 0.4% Arab320 0.3% Afghan317 0.3% African254 0.3% Nigerian249 0.3% Lebanese239 0.3% Swedish220 0.2% Lithuanian198 0.2% Eastern European195 0.2% Bahamian177 0.2% Romanian168 0.2% Guyanese167 0.2% Scottish164 0.2% French Canadian157 0.2% British West Indian121 0.1% Croatian105 0.1% Trinidadian and Tobagonian100 0.1% Syrian96 0.1% West Indian82 0.09% Albanian78 0.08% Canadian74 0.08% Austrian73 0.08% Danish73 0.08% Czechoslovakian66 0.07% Barbadian63 0.07% Czech62 0.07% Ethiopian60 0.06% Belizean56 0.06% Dutch53 0.06% Turkish50 0.05% Northern European48 0.05% Zimbabwean39 0.04% Egyptian32 0.03% Scotch-Irish29 0.03% British29 0.03% Jordanian27 0.03% Welsh26 0.03% Latvian23 0.02% Liberian22 0.02% Moroccan16 0.02% Kenyan15 0.02% Slavic11 0.01% Armenian10 0.01% Norwegian9 0.01% Sierra Leonean
Geographical mobility in Bridgeport Same house 1 year ago 42,886 83.6% White (Caucasian)28,412 90.6% Black or African American701 85.8% American Indian / Alaska Native8,736 86.1% Asian153 100.0% Native Hawaiian / Pacific Islander26,696 90.1% Other race17,154 86.7% Two or more races34,871 83.1% White alone, not Hispanic / Latino49,400 90.1% Hispanic or LatinoMoved within same county 4,968 9.7% White / Caucasian1,314 4.2% Black or African American56 6.9% American Indian / Alaska Native444 4.4% Asian1,549 5.2% Other race1,245 6.3% Two or more races4,114 9.8% White alone, not Hispanic / Latino3,049 5.6% Hispanic or LatinoMoved within same state 1,443 2.8% White / Caucasian347 1.1% Black or African American287 2.8% Asian423 1.4% Other race345 1.7% Two or more races1,186 2.8% White alone, not Hispanic / Latino1,212 2.2% Hispanic or LatinoMoved from different state 2,012 3.9% White / Caucasian944 3.0% Black or African American375 3.7% Asian691 2.3% Other race715 3.6% Two or more races1,798 4.3% White alone, not Hispanic / Latino914 1.7% Hispanic or LatinoMoved from abroad 3 0.0% White337 1.1% Black or African American262 2.6% Asian279 0.9% Other race307 1.5% Two or more races3 0.0% White alone, not Hispanic / Latino279 0.5% Hispanic or Latino
Children Nativity (place of birth) in Bridgeport
Children under 6 years - Living with two parents Both parents native 1,549 100.0% NativeBoth parents foreign-born 1,501 95.5% Native71 4.5% Foreign-bornOne native, one foreign-born parent 944 100.0% NativeChildren under 6 years - Living with one parent Native parent 3,976 100.0% NativeForeign-born parent 1,039 100.0% NativeChildren 6 to 17 years - Living with two parents Both parents native 1,570 100.0% NativeBoth parents foreign-born 3,637 80.4% Native885 19.6% Foreign-bornOne native, one foreign-born parent 2,532 100.0% NativeChildren 6 to 17 years - Living with one parent Native parent 5,505 100.0% NativeForeign-born parent 4,885 57.9% Native3,554 42.1% Foreign-born
Place of birth for residents in Bridgeport 32,980 Americas32,793 Latin America12,691 Caribbean11,651 South America8,450 Central America7,917 Asia5,993 Europe3,130 South Central Asia2,740 South Eastern Asia2,680 Southern Europe2,517 Eastern Europe1,951 Africa1,163 Eastern Asia921 Western Africa882 Western Asia881 China446 Western Europe421 Middle Africa348 Northern Europe197 Eastern Africa187 Northern America160 Northern Africa6,138 Brazil5,812 Jamaica4,133 Dominican Republic3,239 Mexico2,134 Ecuador1,786 Haiti1,749 Colombia1,438 Portugal1,431 El Salvador1,229 Vietnam1,198 Honduras1,189 Guatemala1,061 India1,003 Pakistan881 China877 Peru747 Philippines725 Bangladesh663 Poland646 Nicaragua599 Greece566 Italy548 Costa Rica503 Russia386 Laos374 Syria366 Cabo Verde324 Cuba320 Democratic Republic of Congo (Zaire)290 Lithuania282 Germany278 Czechoslovakia251 Romania233 Ukraine229 Trinidad and Tobago211 Thailand204 Chile194 Nigeria190 Ghana190 Lebanon186 Canada183 Venezuela178 Nepal177 England170 Guyana161 Afghanistan142 Korea120 Indonesia104 Argentina103 Barbados99 Albania97 United Kingdom96 Uganda96 Belize95 Latvia94 Jordan90 Liberia82 Dominica82 Uruguay78 Saudi Arabia78 Turkey76 Spain72 St. Lucia65 Panama63 Bahamas61 Netherlands61 France59 Morocco59 Denmark55 Cameroon46 Egypt46 Hungary42 Togo40 Austria35 Zimbabwe35 Kenya30 Ethiopia30 Croatia28 Cambodia26 Grenada23 Sierra Leone19 Japan17 St. Vincent and the Grenadines16 Malaysia13 Sweden13 Iraq10 Congo9 West Indies4 Senegal
Grandparents responsible for own grandchildren in Bridgeport
Grandparents (30 to 59 years) White / Caucasian 56 9.9% Responsible for grandchildren510 90.1% Not responsible for grandchildrenBlack or African American 111 36.4% Responsible for grandchildren193 63.6% Not responsible for grandchildrenAsian 36 100.0% Not responsible for grandchildrenOther race 59 10.4% Responsible for grandchildren511 89.6% Not responsible for grandchildrenTwo or more races 152 41.6% Responsible for grandchildren214 58.4% Not responsible for grandchildrenWhite alone, not Hispanic / Latino 49 14.0% Responsible for grandchildren301 86.0% Not responsible for grandchildrenHispanic or Latino 159 16.2% Responsible for grandchildren821 83.8% Not responsible for grandchildrenGrandparents (60 years and over) White / Caucasian 11 4.2% Responsible for grandchildren252 95.8% Not responsible for grandchildrenBlack or African American 113 16.6% Responsible for grandchildren565 83.4% Not responsible for grandchildrenAsian 136 29.2% Responsible for grandchildren331 70.8% Not responsible for grandchildrenOther race 54 13.3% Responsible for grandchildren354 86.7% Not responsible for grandchildrenTwo or more races 34 29.8% Responsible for grandchildren80 70.2% Not responsible for grandchildrenWhite alone, not Hispanic / Latino 8 6.9% Responsible for grandchildren101 93.1% Not responsible for grandchildrenHispanic or Latino 47 8.1% Responsible for grandchildren537 91.9% Not responsible for grandchildren