Races in Bowling Green, Kentucky (KY) Detailed Stats
Data:
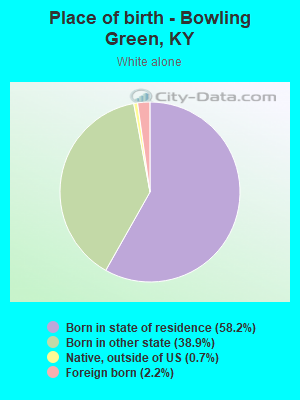
Races - White alone (%)
Races - White alone (% change since 2000)
Races - Black alone (%)
Races - Black alone (% change since 2000)
Races - American Indian alone (%)
Races - American Indian alone (% change since 2000)
Races - Asian alone (%)
Races - Asian alone (% change since 2000)
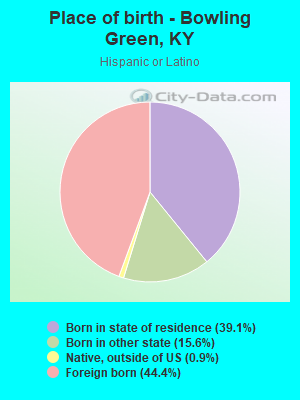
Races - Hispanic (%)
Races - Hispanic (% change since 2000)
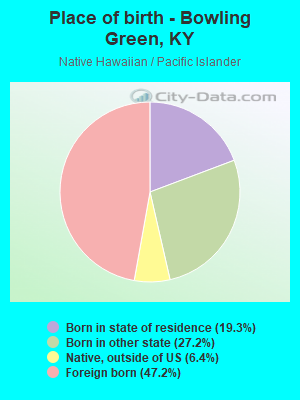
Races - Native Hawaiian and Other Pacific Islander alone (%)
Races - Native Hawaiian and Other Pacific Islander alone (% change since 2000)
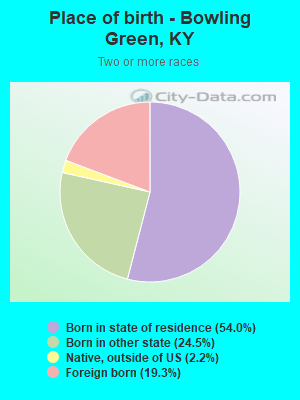
Races - Two or more races(%)
Races - Two or more races(% change since 2000)
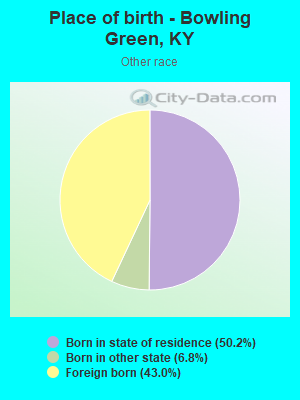
Races - Other race alone (%)
Races - Other race alone (% change since 2000)
Racial diversity
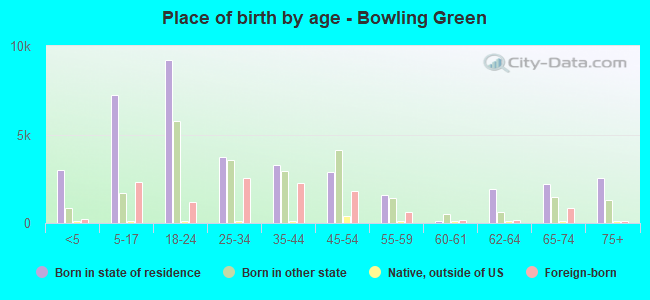
Place of birth - Born in state of residence (%)
Place of birth - Born in state of residence (%) - White
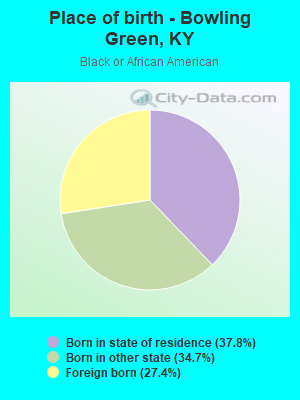
Place of birth - Born in state of residence (%) - Black or African American
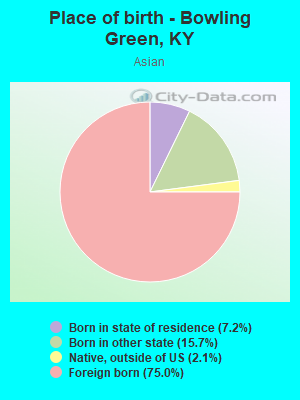
Place of birth - Born in state of residence (%) - Asian
Place of birth - Born in state of residence (%) - Hispanic or Latino
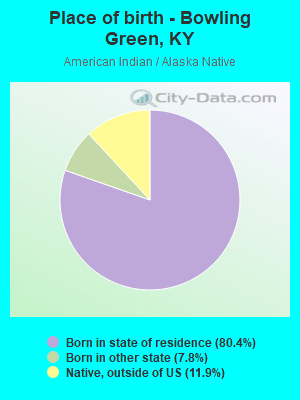
Place of birth - Born in state of residence (%) - American Indian and Alaska Native
Place of birth - Born in state of residence (%) - Multirace
Place of birth - Born in state of residence (%) - Other Race
Place of birth - Born in other state (%)
Place of birth - Born in other state (%) - White
Place of birth - Born in other state (%) - Black or African American
Place of birth - Born in other state (%) - Asian
Place of birth - Born in other state (%) - Hispanic or Latino
Place of birth - Born in other state (%) - American Indian and Alaska Native
Place of birth - Born in other state (%) - Multirace
Place of birth - Born in other state (%) - Other Race
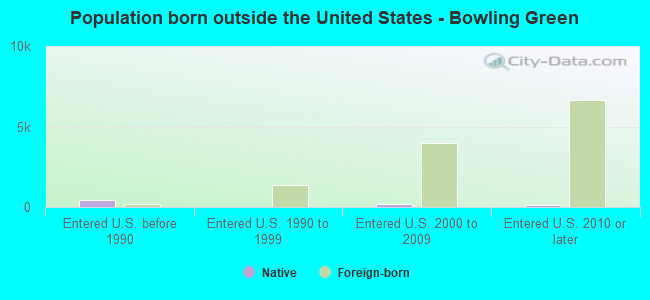
Place of birth - Native, outside of US (%)
Place of birth - Native, outside of US (%) - White
Place of birth - Native, outside of US (%) - Black or African American
Place of birth - Native, outside of US (%) - Asian
Place of birth - Native, outside of US (%) - Hispanic or Latino
Place of birth - Native, outside of US (%) - American Indian and Alaska Native
Place of birth - Native, outside of US (%) - Multirace
Place of birth - Native, outside of US (%) - Other Race
Place of birth - Foreign born (%)
Place of birth - Foreign born (%) - White
Place of birth - Foreign born (%) - Black or African American
Place of birth - Foreign born (%) - Asian
Place of birth - Foreign born (%) - Hispanic or Latino
Place of birth - Foreign born (%) - American Indian and Alaska Native
Place of birth - Foreign born (%) - Multirace
Place of birth - Foreign born (%) - Other Race
Residents speaking English at home (%)
Residents speaking English at home - Born in the United States (%)
Residents speaking English at home - Native, born elsewhere (%)
Residents speaking English at home - Foreign born (%)
Residents speaking Spanish at home (%)
Residents speaking Spanish at home - Born in the United States (%)
Residents speaking Spanish at home - Native, born elsewhere (%)
Residents speaking Spanish at home - Foreign born (%)
Residents speaking other language at home (%)
Residents speaking other language at home - Born in the United States (%)
Residents speaking other language at home - Native, born elsewhere (%)
Residents speaking other language at home - Foreign born (%)
Marital status - Never married (%)
Marital status - Now married (%)
Marital status - Separated (%)
Marital status - Widowed (%)
Marital status - Divorced (%)
Ancestries Reported - Arab (%)
Ancestries Reported - Czech (%)
Ancestries Reported - Danish (%)
Ancestries Reported - Dutch (%)
Ancestries Reported - English (%)
Ancestries Reported - French (%)
Ancestries Reported - French Canadian (%)
Ancestries Reported - German (%)
Ancestries Reported - Greek (%)
Ancestries Reported - Hungarian (%)
Ancestries Reported - Irish (%)
Ancestries Reported - Italian (%)
Ancestries Reported - Lithuanian (%)
Ancestries Reported - Norwegian (%)
Ancestries Reported - Polish (%)
Ancestries Reported - Portuguese (%)
Ancestries Reported - Russian (%)
Ancestries Reported - Scotch-Irish (%)
Ancestries Reported - Scottish (%)
Ancestries Reported - Slovak (%)
Ancestries Reported - Subsaharan African (%)
Ancestries Reported - Swedish (%)
Ancestries Reported - Swiss (%)
Ancestries Reported - Ukrainian (%)
Ancestries Reported - United States (%)
Ancestries Reported - Welsh (%)
Ancestries Reported - West Indian (%)
Ancestries Reported - Other (%)
Geographical mobility - Same house 1 year ago (%)
Geographical mobility - Same house 1 year ago (%) - White
Geographical mobility - Same house 1 year ago (%) - Black or African American
Geographical mobility - Same house 1 year ago (%) - Asian
Geographical mobility - Same house 1 year ago (%) - Hispanic or Latino
Geographical mobility - Same house 1 year ago (%) - American Indian and Alaska Native
Geographical mobility - Same house 1 year ago (%) - Multirace
Geographical mobility - Same house 1 year ago (%) - Other Race
Geographical mobility - Moved within same county (%)
Geographical mobility - Moved within same county (%) - White
Geographical mobility - Moved within same county (%) - Black or African American
Geographical mobility - Moved within same county (%) - Asian
Geographical mobility - Moved within same county (%) - Hispanic or Latino
Geographical mobility - Moved within same county (%) - American Indian and Alaska Native
Geographical mobility - Moved within same county (%) - Multirace
Geographical mobility - Moved within same county (%) - Other Race
Geographical mobility - Moved from different county within same state (%)
Geographical mobility - Moved from different county within same state (%) - White
Geographical mobility - Moved from different county within same state (%) - Black or African American
Geographical mobility - Moved from different county within same state (%) - Asian
Geographical mobility - Moved from different county within same state (%) - Hispanic or Latino
Geographical mobility - Moved from different county within same state (%) - American Indian and Alaska Native
Geographical mobility - Moved from different county within same state (%) - Multirace
Geographical mobility - Moved from different county within same state (%) - Other Race
Geographical mobility - Moved from different state (%)
Geographical mobility - Moved from different state (%) - White
Geographical mobility - Moved from different state (%) - Black or African American
Geographical mobility - Moved from different state (%) - Asian
Geographical mobility - Moved from different state (%) - Hispanic or Latino
Geographical mobility - Moved from different state (%) - American Indian and Alaska Native
Geographical mobility - Moved from different state (%) - Multirace
Geographical mobility - Moved from different state (%) - Other Race
Geographical mobility - Moved from abroad (%)
Geographical mobility - Moved from abroad (%) - White
Geographical mobility - Moved from abroad (%) - Black or African American
Geographical mobility - Moved from abroad (%) - Asian
Geographical mobility - Moved from abroad (%) - Hispanic or Latino
Geographical mobility - Moved from abroad (%) - American Indian and Alaska Native
Geographical mobility - Moved from abroad (%) - Multirace
Geographical mobility - Moved from abroad (%) - Other Race
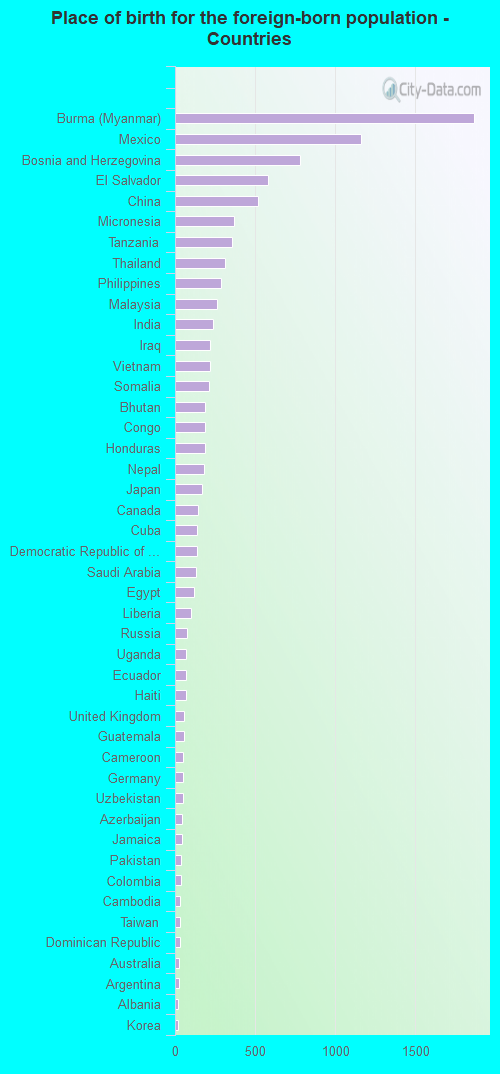
Place of birth for the foreign-born population - Ireland (%)
Place of birth for the foreign-born population - Denmark (%)
Place of birth for the foreign-born population - Norway (%)
Place of birth for the foreign-born population - Sweden (%)
Place of birth for the foreign-born population - United Kingdom (%)
Place of birth for the foreign-born population - England (%)
Place of birth for the foreign-born population - Scotland (%)
Place of birth for the foreign-born population - Other Northern Europe (%)
Place of birth for the foreign-born population - Austria (%)
Place of birth for the foreign-born population - Belgium (%)
Place of birth for the foreign-born population - France (%)
Place of birth for the foreign-born population - Germany (%)
Place of birth for the foreign-born population - Netherlands (%)
Place of birth for the foreign-born population - Switzerland (%)
Place of birth for the foreign-born population - Other Western Europe (%)
Place of birth for the foreign-born population - Greece (%)
Place of birth for the foreign-born population - Italy (%)
Place of birth for the foreign-born population - Portugal (%)
Place of birth for the foreign-born population - Spain (%)
Place of birth for the foreign-born population - Other Southern Europe (%)
Place of birth for the foreign-born population - Albania (%)
Place of birth for the foreign-born population - Belarus (%)
Place of birth for the foreign-born population - Bosnia and Herzegovina (%)
Place of birth for the foreign-born population - Bulgaria (%)
Place of birth for the foreign-born population - Croatia (%)
Place of birth for the foreign-born population - Czechoslovakia (%)
Place of birth for the foreign-born population - Hungary (%)
Place of birth for the foreign-born population - Latvia (%)
Place of birth for the foreign-born population - Lithuania (%)
Place of birth for the foreign-born population - North Macedonia (Macedonia) (%)
Place of birth for the foreign-born population - Moldova (%)
Place of birth for the foreign-born population - Poland (%)
Place of birth for the foreign-born population - Romania (%)
Place of birth for the foreign-born population - Russia (%)
Place of birth for the foreign-born population - Serbia (%)
Place of birth for the foreign-born population - Ukraine (%)
Place of birth for the foreign-born population - Other Eastern Europe (%)
Place of birth for the foreign-born population - China (%)
Place of birth for the foreign-born population - Hong Kong (%)
Place of birth for the foreign-born population - Taiwan (%)
Place of birth for the foreign-born population - Japan (%)
Place of birth for the foreign-born population - Korea (%)
Place of birth for the foreign-born population - Other Eastern Asia (%)
Place of birth for the foreign-born population - Afghanistan (%)
Place of birth for the foreign-born population - Bangladesh (%)
Place of birth for the foreign-born population - India (%)
Place of birth for the foreign-born population - Iran (%)
Place of birth for the foreign-born population - Kazakhstan (%)
Place of birth for the foreign-born population - Nepal (%)
Place of birth for the foreign-born population - Pakistan (%)
Place of birth for the foreign-born population - Sri Lanka (%)
Place of birth for the foreign-born population - Uzbekistan (%)
Place of birth for the foreign-born population - Other South Central Asia (%)
Place of birth for the foreign-born population - Burma (%)
Place of birth for the foreign-born population - Cambodia (%)
Place of birth for the foreign-born population - Indonesia (%)
Place of birth for the foreign-born population - Laos (%)
Place of birth for the foreign-born population - Malaysia (%)
Place of birth for the foreign-born population - Philippines (%)
Place of birth for the foreign-born population - Singapore (%)
Place of birth for the foreign-born population - Thailand (%)
Place of birth for the foreign-born population - Vietnam (%)
Place of birth for the foreign-born population - Other South Eastern Asia (%)
Place of birth for the foreign-born population - Armenia (%)
Place of birth for the foreign-born population - Iraq (%)
Place of birth for the foreign-born population - Israel (%)
Place of birth for the foreign-born population - Jordan (%)
Place of birth for the foreign-born population - Kuwait (%)
Place of birth for the foreign-born population - Lebanon (%)
Place of birth for the foreign-born population - Saudi Arabia (%)
Place of birth for the foreign-born population - Syria (%)
Place of birth for the foreign-born population - Turkey (%)
Place of birth for the foreign-born population - Yemen (%)
Place of birth for the foreign-born population - Other Western Asia (%)
Place of birth for the foreign-born population - Eritrea (%)
Place of birth for the foreign-born population - Ethiopia (%)
Place of birth for the foreign-born population - Kenya (%)
Place of birth for the foreign-born population - Somalia (%)
Place of birth for the foreign-born population - Uganda (%)
Place of birth for the foreign-born population - Zimbabwe (%)
Place of birth for the foreign-born population - Other Eastern Africa (%)
Place of birth for the foreign-born population - Cameroon (%)
Place of birth for the foreign-born population - Congo (%)
Place of birth for the foreign-born population - Democratic Republic of Congo (Zaire) (%)
Place of birth for the foreign-born population - Other Middle Africa (%)
Place of birth for the foreign-born population - Egypt (%)
Place of birth for the foreign-born population - Morocco (%)
Place of birth for the foreign-born population - Sudan (%)
Place of birth for the foreign-born population - Other Northern Africa (%)
Place of birth for the foreign-born population - South Africa (%)
Place of birth for the foreign-born population - Other Southern Africa (%)
Place of birth for the foreign-born population - Cabo Verde (%)
Place of birth for the foreign-born population - Ghana (%)
Place of birth for the foreign-born population - Liberia (%)
Place of birth for the foreign-born population - Nigeria (%)
Place of birth for the foreign-born population - Senegal (%)
Place of birth for the foreign-born population - Sierra Leone (%)
Place of birth for the foreign-born population - Other Western Africa (%)
Place of birth for the foreign-born population - Australia (%)
Place of birth for the foreign-born population - New Zealand (%)
Place of birth for the foreign-born population - Fiji (%)
Place of birth for the foreign-born population - Micronesia (%)
Place of birth for the foreign-born population - Bahamas (%)
Place of birth for the foreign-born population - Barbados (%)
Place of birth for the foreign-born population - Cuba (%)
Place of birth for the foreign-born population - Dominica (%)
Place of birth for the foreign-born population - Dominican Republic (%)
Place of birth for the foreign-born population - Grenada (%)
Place of birth for the foreign-born population - Haiti (%)
Place of birth for the foreign-born population - Jamaica (%)
Place of birth for the foreign-born population - St. Vincent and the Grenadines (%)
Place of birth for the foreign-born population - Trinidad and Tobago (%)
Place of birth for the foreign-born population - West Indies (%)
Place of birth for the foreign-born population - Other Caribbean (%)
Place of birth for the foreign-born population - Belize (%)
Place of birth for the foreign-born population - Costa Rica (%)
Place of birth for the foreign-born population - El Salvador (%)
Place of birth for the foreign-born population - Guatemala (%)
Place of birth for the foreign-born population - Honduras (%)
Place of birth for the foreign-born population - Mexico (%)
Place of birth for the foreign-born population - Nicaragua (%)
Place of birth for the foreign-born population - Panama (%)
Place of birth for the foreign-born population - Other Central America (%)
Place of birth for the foreign-born population - Argentina (%)
Place of birth for the foreign-born population - Bolivia (%)
Place of birth for the foreign-born population - Brazil (%)
Place of birth for the foreign-born population - Chile (%)
Place of birth for the foreign-born population - Colombia (%)
Place of birth for the foreign-born population - Ecuador (%)
Place of birth for the foreign-born population - Guyana (%)
Place of birth for the foreign-born population - Peru (%)
Place of birth for the foreign-born population - Uruguay (%)
Place of birth for the foreign-born population - Venezuela (%)
Place of birth for the foreign-born population - Other South America (%)
Place of birth for the foreign-born population - Canada (%)
Place of birth for the foreign-born population - Other Northern America (%)
Place of birth for the foreign-born population - Other (%)
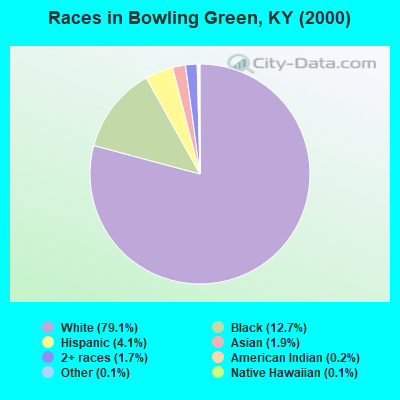
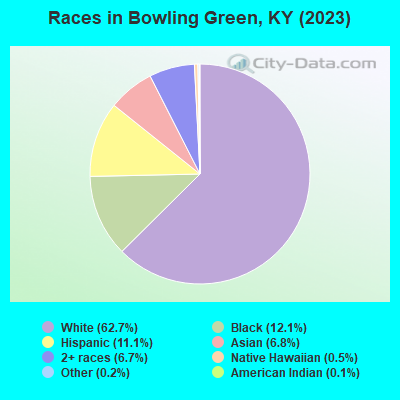
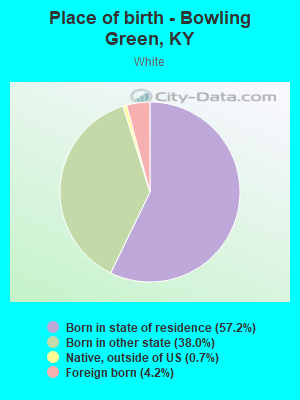
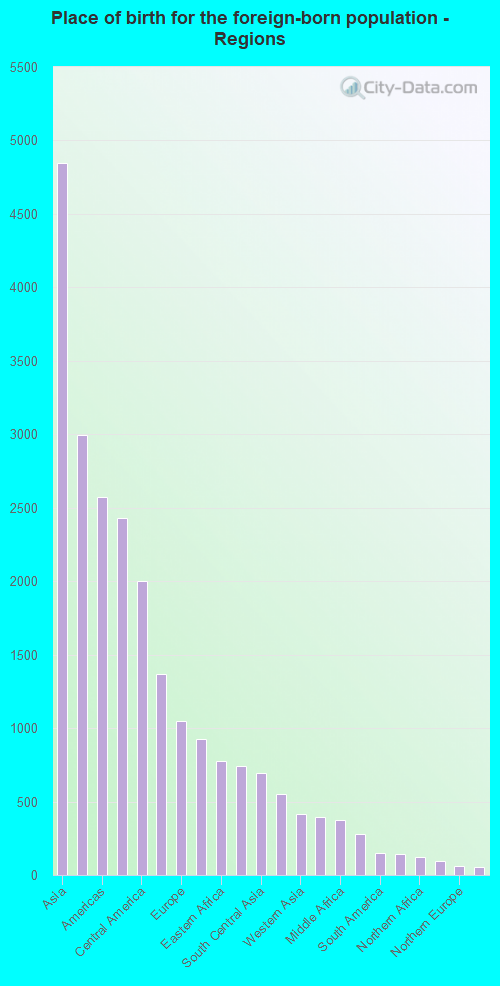
According to 2022 data, the most numerous races in Bowling Green, KY are White alone (48,381 residents), Black alone (8,828 residents), and Hispanic (7,355 residents). 78.6% of Bowling Green residents speak English at home. 13.7% of Bowling Green, KY residents are foreign-born (6.6% born in Asia, 3.3% born in Latin America, 1.9% born in Africa, 1.4% born in Europe), which is 70.8% greater than the foreign-born rate of 4.0% across the entire state of Kentucky.
Race distribution in Bowling Green
2000 2022
3,608,013 89.3% White alone 293,639 7.3% Black alone 59,939 1.5% Hispanic 37,750 0.9% Two or more races 29,368 0.7% Asian alone 7,939 0.2% American Indian alone 3,846 0.10% Other race alone 1,275 0.03% Native Hawaiian and Other
3,710,998 82.2% White alone 343,194 7.6% Black alone 187,483 4.2% Hispanic 187,394 4.2% Two or more races 62,240 1.4% Asian alone 13,529 0.3% Other race alone 4,302 0.10% American Indian alone 3,170 0.07% Native Hawaiian and Other
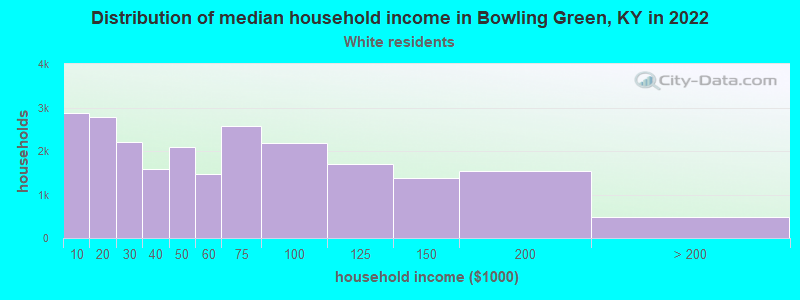
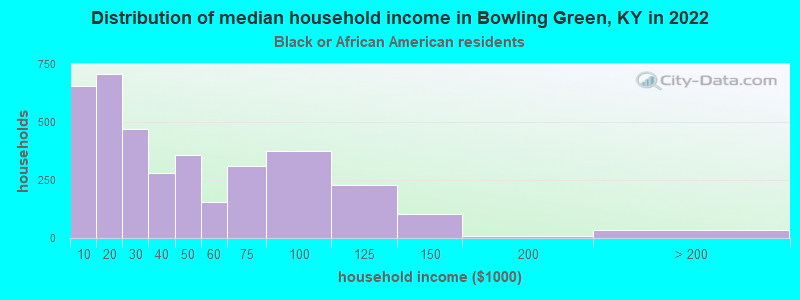
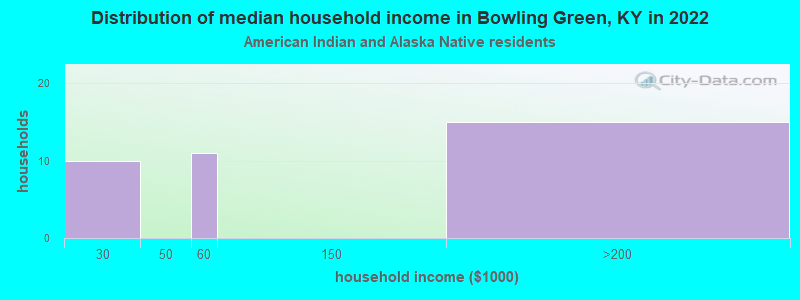
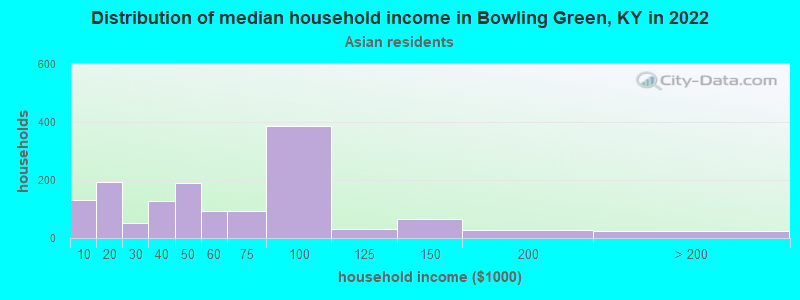
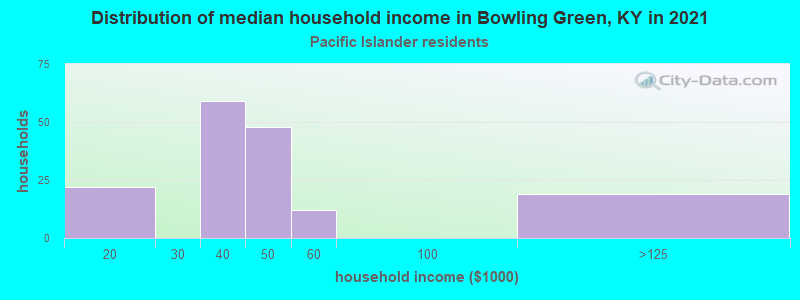
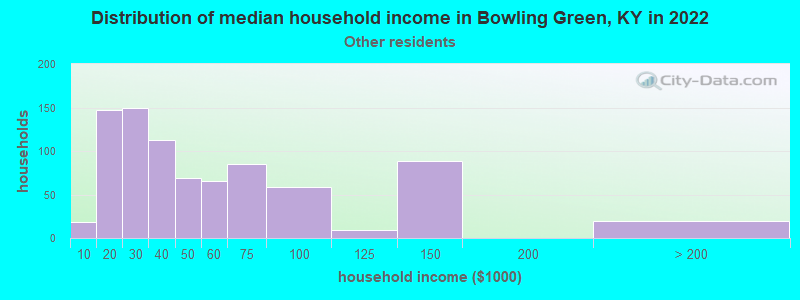
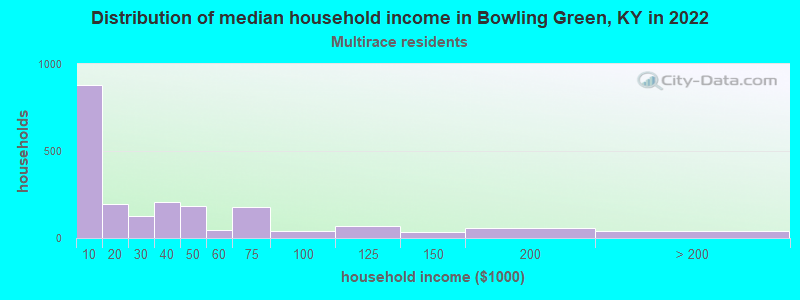
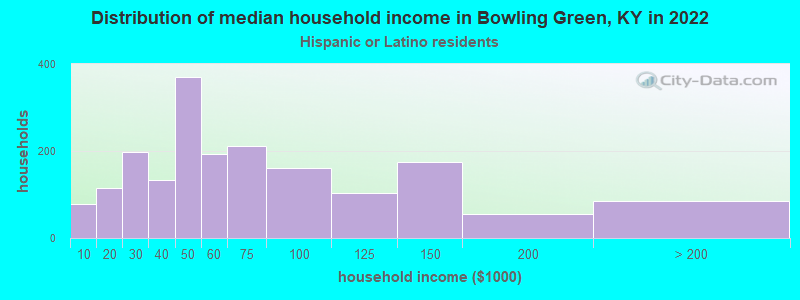
Income and house value in Bowling Green Median household income in 2022 $47,797 White non-Hispanic householders$34,139 Black householders$80,438 Asian householders$30,292 Some other race householders$37,577 Two or more races householders$31,892 Hispanic or Latino race householdersMedian 2022 house value $280,839 White Non-Hispanic householders$173,040 Black or African American householders$136,597 American Indian or Alaska Native householders $245,670 Asian householders$200,818 Some other race householders$192,917 Two or more races householders$219,167 Hispanic or Latino householders
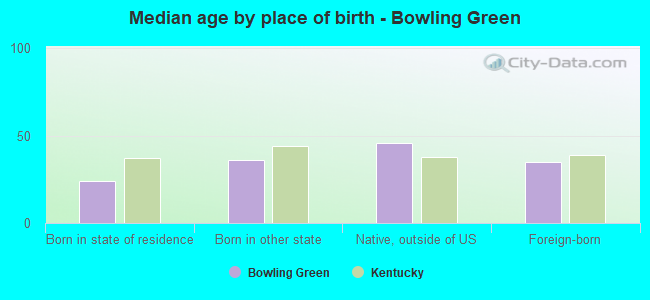
Median age by race in Bowling Green
33.0 Median age for White residents31.7 35.5 33.7 Median age for Black or African American residents23.7 40.3 -666,666,666.0 Median age for American Indian / Alaska Native residents-666,666,666.0 -666,666,666.0 33.1 Median age for Asian residents33.5 31.6 18.9 Median age for Native Hawaiian / Pacific Islander residents-666,666,666.0 14.0 21.4 Median age for Other race residents26.2 15.9 21.2 Median age for Two or more races residents13.2 29.5 32.1 Median age for White alone residents31.3 34.9 27.8 Median age for Hispanic or Latino residents25.7 29.4
Owner/renter occupied households by race in Bowling Green
House owners and renters - White residents 8,826 38.6% Owner occupied14,021 61.4% Renter occupiedHouse owners and renters - Black or African American residents 874 23.0% Owner occupied2,920 77.0% Renter occupiedHouse owners and renters - American Indian / Alaska Native residents 14 54.4% Owner occupied12 45.6% Renter occupiedHouse owners and renters - Asian residents 653 35.2% Owner occupied1,200 64.8% Renter occupiedHouse owners and renters - Native Hawaiian / Pacific Islander residents 44 39.8% Owner occupied67 60.2% Renter occupiedHouse owners and renters - Other race residents 247 26.0% Owner occupied702 74.0% Renter occupiedHouse owners and renters - Two or more races residents 749 40.9% Owner occupied1,082 59.1% Renter occupiedHouse owners and renters - White alone residents 8,605 38.3% Owner occupied13,870 61.7% Renter occupiedHouse owners and renters - Hispanic or Latino residents 721 37.3% Owner occupied1,214 62.7% Renter occupied
Language usage in Bowling Green
English speakers - Total 78.6% of residents of Bowling Green speak English at home.
8.4% of residents speak Spanish at home 2,505 42.1% Speak English very well3,445 57.9% Speak English less than very well13.0% of residents speak other language at home 2,622 28.5% Speak English very well6,588 71.5% Speak English less than very well
English speakers - Born in the United States 93.7% of residents of Bowling Green speak English at home.
5.0% of residents speak Spanish at home 751 64.7% Speak English very well409 35.3% Speak English less than very well1.4% of residents speak other language at home 326 100.0% Speak English very well
English speakers - Native, born elsewhere 76.6% of residents of Bowling Green speak English at home.
9.9% of residents speak Spanish at home 63 100.0% Speak English very well13.5% of residents speak other language at home 86 100.0% Speak English very well
English speakers - Foreign-born 6.4% of residents of Bowling Green speak English at home.
26.4% of residents speak Spanish at home 439 13.9% Speak English very well2,725 86.1% Speak English less than very well67.3% of residents speak other language at home 1,787 22.2% Speak English very well6,280 77.8% Speak English less than very well
White (Caucasian) - Speak only English Native:
96.4% (44,637)Foreign-born:
5.5% (115)
White (Caucasian) - Speak another language Native:
3.6% (1,679)Foreign-born:
94.5% (1,977)
Black or African American - Speak only English Native:
98.6% (7,043)Foreign-born:
0.3% (5)
Black or African American - Speak another language Native:
1.4% (101)Foreign-born:
96.7% (1,467)
Asian - Speak only English Native:
31.7% (278)Foreign-born:
6.4% (235)
Asian - Speak another language Native:
68.9% (605)Foreign-born:
94.1% (3,476)
Native Hawaiian / Pacific Islander - Speak another language Native:
51.2% (129)Foreign-born:
100.0% (371)
Other race - Speak only English Native:
32.2% (447)Foreign-born:
4.1% (69)
Other race - Speak another language Native:
67.8% (943)Foreign-born:
95.9% (1,594)
Two or more races - Speak only English Native:
74.4% (2,959)Foreign-born:
43.6% (479)
Two or more races - Speak another language Native:
25.6% (1,018)Foreign-born:
56.4% (620)
White alone - Speak only English Native:
97.2% (43,256)Foreign-born:
25.3% (307)
White alone - Speak another language Native:
3.0% (1,328)Foreign-born:
94.8% (1,150)
Hispanic or Latino - Speak only English Native:
36.5% (1,249)Foreign-born:
3.1% (100)
Hispanic or Latino - Speak another language Native:
63.5% (2,177)Foreign-born:
96.9% (3,164)
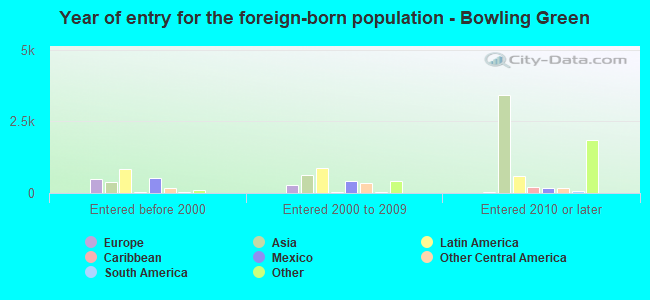
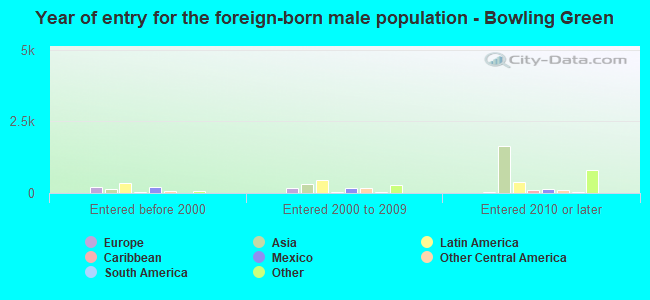
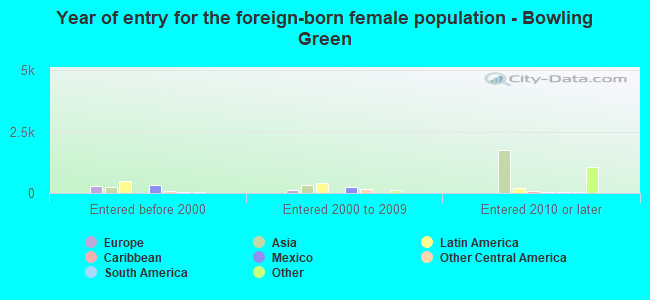
Foreign-born residents in Bowling Green 10,237 residents are foreign born (6.6% Asia , 3.3% Latin America , 1.9% Africa , 1.4% Europe ).
This city:
13.7%Kentucky:
4.1%
Marital status for residents in Bowling Green Marital status - White (Caucasian) population 15 years and over
Males 49.6% Never married35.1% Now married2.4% Separated3.1% Widowed9.9% DivorcedFemales 44.8% Never married32.0% Now married1.2% Separated6.3% Widowed15.6% DivorcedWomen who gave birth in the past 12 months Now married:
100.0% (90)Unmarried:
0.0% (0)
Women who did not give birth in the past 12 months Now married:
26.2% (3,769)Unmarried:
73.8% (10,624)
Marital status - Black or African American population 15 years and over
Males 50.3% Never married32.8% Now married9.4% Separated1.4% Widowed6.2% DivorcedFemales 43.7% Never married26.8% Now married0.0% Separated3.3% Widowed26.3% DivorcedWomen who gave birth in the past 12 months Now married:
32.4% (73)Unmarried:
67.6% (152)
Women who did not give birth in the past 12 months Now married:
23.1% (573)Unmarried:
76.9% (1,907)
Marital status - American Indian / Alaska Native population 15 years and over
Males 65.7% Never married34.3% Now married0.0% Separated0.0% Widowed0.0% DivorcedFemales 41.9% Never married34.9% Now married0.0% Separated0.0% Widowed23.3% DivorcedWomen who did not give birth in the past 12 months Now married:
34.9% (18)Unmarried:
65.1% (33)
Marital status - Asian population 15 years and over
Males 34.8% Never married57.9% Now married0.5% Separated0.9% Widowed6.0% DivorcedFemales 30.1% Never married62.4% Now married0.2% Separated1.6% Widowed5.7% DivorcedWomen who gave birth in the past 12 months Now married:
100.0% (115)Unmarried:
0.0% (0)
Women who did not give birth in the past 12 months Now married:
56.1% (662)Unmarried:
43.9% (518)
Marital status - Native Hawaiian / Pacific Islander population 15 years and over
Males 76.6% Never married23.4% Now married0.0% Separated0.0% Widowed0.0% DivorcedFemales 57.1% Never married27.9% Now married0.0% Separated15.1% Widowed0.0% DivorcedWomen who did not give birth in the past 12 months Now married:
24.2% (42)Unmarried:
75.8% (132)
Marital status - Other race population 15 years and over
Males 43.7% Never married46.8% Now married6.7% Separated0.0% Widowed2.8% DivorcedFemales 44.1% Never married39.2% Now married1.3% Separated3.3% Widowed12.1% DivorcedWomen who gave birth in the past 12 months Now married:
31.8% (28)Unmarried:
68.2% (59)
Women who did not give birth in the past 12 months Now married:
46.1% (305)Unmarried:
53.9% (357)
Marital status - Two or more races population 15 years and over
Males 54.4% Never married37.2% Now married1.6% Separated2.3% Widowed4.6% DivorcedFemales 72.5% Never married11.4% Now married2.6% Separated5.3% Widowed8.2% DivorcedWomen who gave birth in the past 12 months Now married:
14.9% (14)Unmarried:
85.1% (82)
Women who did not give birth in the past 12 months Now married:
10.7% (159)Unmarried:
89.3% (1,324)
Marital status - White alone, not Hispanic / Latino population 15 years and over
Males 48.2% Never married35.9% Now married2.3% Separated3.2% Widowed10.4% DivorcedFemales 44.9% Never married32.1% Now married1.2% Separated6.5% Widowed15.4% DivorcedWomen who gave birth in the past 12 months Now married:
100.0% (90)Unmarried:
0.0% (0)
Women who did not give birth in the past 12 months Now married:
26.9% (3,769)Unmarried:
73.1% (10,238)
Marital status - Hispanic or Latino population 15 years and over
Males 61.1% Never married36.1% Now married1.2% Separated0.0% Widowed1.6% DivorcedFemales 40.7% Never married43.2% Now married0.0% Separated6.1% Widowed10.0% DivorcedWomen who gave birth in the past 12 months Now married:
60.2% (87)Unmarried:
39.8% (57)
Women who did not give birth in the past 12 months Now married:
39.1% (646)Unmarried:
60.9% (1,006)
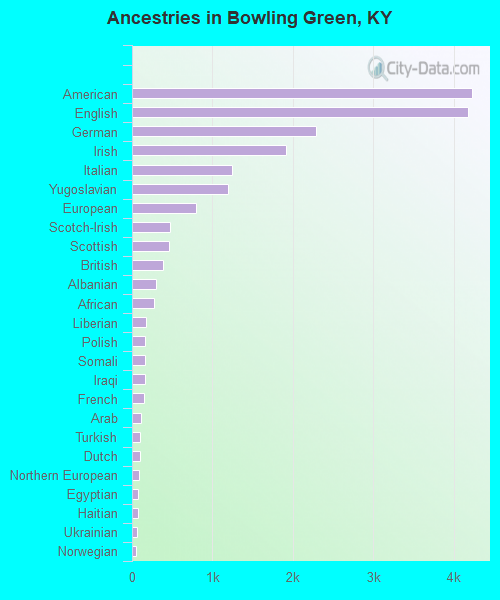
Ancestries in Bowling Green
4,230 11.5% American4,185 11.4% English2,293 6.2% German1,912 5.2% Irish1,250 3.4% Italian1,197 3.3% Yugoslavian795 2.2% European467 1.3% Scotch-Irish462 1.3% Scottish386 1.1% British294 0.8% Albanian270 0.7% African169 0.5% Liberian164 0.4% Polish159 0.4% Somali156 0.4% Iraqi150 0.4% French116 0.3% Arab103 0.3% Turkish95 0.3% Dutch82 0.2% Northern European77 0.2% Egyptian76 0.2% Haitian56 0.2% Ukrainian51 0.1% Norwegian48 0.1% Russian47 0.1% Jamaican45 0.1% Portuguese39 0.1% Lebanese35 0.10% Scandinavian30 0.08% Sierra Leonean26 0.07% Welsh25 0.07% Serbian19 0.05% Ethiopian17 0.05% French Canadian16 0.04% Swedish13 0.04% Canadian11 0.03% Greek10 0.03% Kenyan10 0.03% Croatian9 0.02% Palestinian8 0.02% Australian
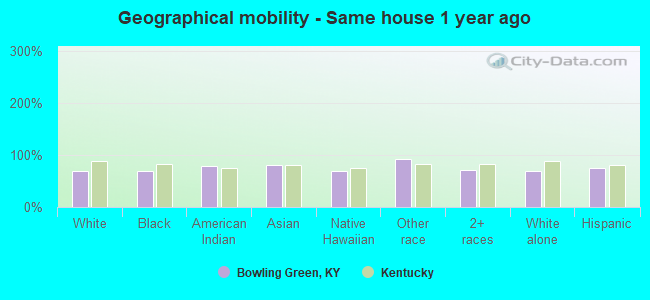
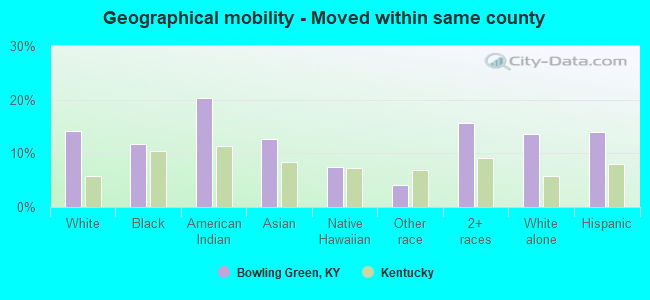
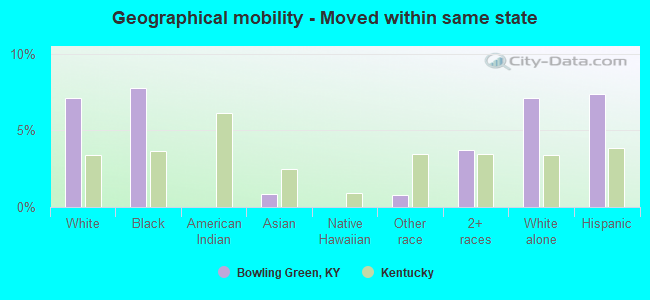
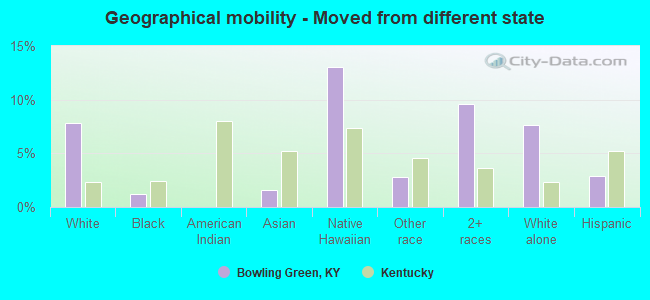
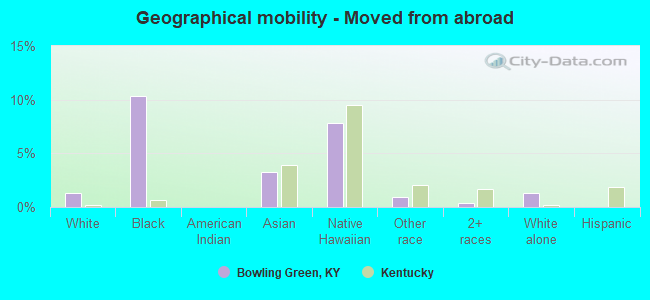
Geographical mobility in Bowling Green Same house 1 year ago 34,700 69.5% White (Caucasian)6,267 68.9% Black or African American85 79.0% American Indian / Alaska Native4,103 80.5% Asian466 68.5% Native Hawaiian / Pacific Islander2,607 92.8% Other race3,834 72.0% Two or more races33,920 70.3% White alone, not Hispanic / Latino5,579 75.9% Hispanic or LatinoMoved within same county 7,079 14.2% White / Caucasian1,067 11.7% Black or African American22 20.2% American Indian / Alaska Native647 12.7% Asian51 7.5% Native Hawaiian / Pacific Islander115 4.1% Other race835 15.7% Two or more races6,541 13.6% White alone, not Hispanic / Latino1,022 13.9% Hispanic or LatinoMoved within same state 3,554 7.1% White / Caucasian704 7.7% Black or African American42 0.8% Asian23 0.8% Other race198 3.7% Two or more races3,435 7.1% White alone, not Hispanic / Latino543 7.4% Hispanic or LatinoMoved from different state 3,919 7.9% White / Caucasian112 1.2% Black or African American82 1.6% Asian89 13.0% Native Hawaiian / Pacific Islander80 2.8% Other race512 9.6% Two or more races3,708 7.7% White alone, not Hispanic / Latino211 2.9% Hispanic or LatinoMoved from abroad 646 1.3% White942 10.4% Black or African American168 3.3% Asian53 7.8% Native Hawaiian / Pacific Islander27 1.0% Other race20 0.4% Two or more races646 1.3% White alone, not Hispanic / Latino
Children Nativity (place of birth) in Bowling Green
Children under 6 years - Living with two parents Both parents native 1,440 100.0% NativeBoth parents foreign-born 981 83.2% Native198 16.8% Foreign-bornOne native, one foreign-born parent 747 100.0% NativeChildren under 6 years - Living with one parent Native parent 941 100.0% NativeForeign-born parent 663 85.2% Native115 14.8% Foreign-bornChildren 6 to 17 years - Living with two parents Both parents native 2,312 100.0% NativeBoth parents foreign-born 834 38.6% Native1,329 61.4% Foreign-bornOne native, one foreign-born parent 690 100.0% NativeChildren 6 to 17 years - Living with one parent Native parent 1,799 99.5% Native9 0.5% Foreign-bornForeign-born parent 1,266 59.3% Native868 40.7% Foreign-born
Grandparents responsible for own grandchildren in Bowling Green
Grandparents (30 to 59 years) White / Caucasian 143 85.1% Responsible for grandchildren25 14.9% Not responsible for grandchildrenBlack or African American 173 79.4% Responsible for grandchildren45 20.6% Not responsible for grandchildrenAsian 6 8.6% Responsible for grandchildren65 91.4% Not responsible for grandchildrenTwo or more races 8 100.0% Responsible for grandchildrenWhite alone, not Hispanic / Latino 143 89.9% Responsible for grandchildren16 10.1% Not responsible for grandchildrenHispanic or Latino 7 100.0% Not responsible for grandchildrenGrandparents (60 years and over) White / Caucasian 139 41.2% Responsible for grandchildren198 58.8% Not responsible for grandchildrenBlack or African American 66 79.4% Responsible for grandchildren17 20.6% Not responsible for grandchildrenAsian 95 100.0% Not responsible for grandchildrenWhite alone, not Hispanic / Latino 139 41.2% Responsible for grandchildren198 58.8% Not responsible for grandchildrenHispanic or Latino 2 100.0% Not responsible for grandchildren