Races in Boca Ciega, Florida (FL) Detailed Stats
Ancestries, Foreign-born residents, place of birth
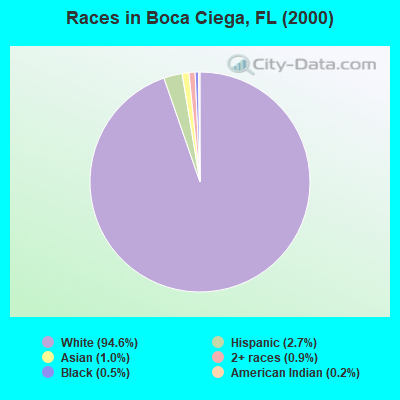
Race distribution in Boca Ciega

- 65,84494.6%White alone
- 1,8952.7%Hispanic
- 6821.0%Asian alone
- 6160.9%Two or more races
- 3320.5%Black alone
- 1710.2%American Indian alone
- 380.05%Other race alone
- 260.04%Native Hawaiian and Other
Pacific Islander alone
2000
2022
-
- 10,458,50965.4%White alone
- 2,682,71516.8%Hispanic
- 2,264,26814.2%Black alone
- 261,6931.6%Asian alone
- 236,9541.5%Two or more races
- 42,3580.3%American Indian alone
- 28,9940.2%Other race alone
- 6,8870.04%Native Hawaiian and Other
Pacific Islander alone

-
- 11,309,40350.8%White alone
- 6,025,03927.1%Hispanic
- 3,241,01514.6%Black alone
- 861,6303.9%Two or more races
- 623,6922.8%Asian alone
- 152,0540.7%Other race alone
- 22,5040.1%American Indian alone
- 9,4860.04%Native Hawaiian and Other
Pacific Islander alone

Income and house value in Boca Ciega
- Median household income in 2022
- $71,677White non-Hispanic householders
- $76,772Black householders
- $26,795American Indian and Alaska Native householders
- $112,596Asian householders
- $40,664Some other race householders
- $88,177Two or more races householders
- $67,820Hispanic or Latino race householders
- Median 2022 house value
- $487,457White Non-Hispanic householders
- $439,593Black or African American householders
- $346,384American Indian or Alaska Native householders
- $512,228Asian householders
- $302,718Some other race householders
- $428,257Two or more races householders
- $476,121Hispanic or Latino householders
Household income for White non-Hispanic householders

Household income for Black householders

Household income for American Indian and Alaska Native householders

Household income for Asian householders

Household income for Two or more races householders

Household income for Hispanic or Latino race householders

Zip code: 33772