Races in Bloomington, Minnesota (MN) Detailed Stats
Data:
Races - White alone (%)
Races - White alone (% change since 2000)
Races - Black alone (%)
Races - Black alone (% change since 2000)
Races - American Indian alone (%)
Races - American Indian alone (% change since 2000)
Races - Asian alone (%)
Races - Asian alone (% change since 2000)
Races - Hispanic (%)
Races - Hispanic (% change since 2000)
Races - Native Hawaiian and Other Pacific Islander alone (%)
Races - Native Hawaiian and Other Pacific Islander alone (% change since 2000)
Races - Two or more races(%)
Races - Two or more races(% change since 2000)
Races - Other race alone (%)
Races - Other race alone (% change since 2000)
Racial diversity
Place of birth - Born in state of residence (%)
Place of birth - Born in state of residence (%) - White
Place of birth - Born in state of residence (%) - Black or African American
Place of birth - Born in state of residence (%) - Asian
Place of birth - Born in state of residence (%) - Hispanic or Latino
Place of birth - Born in state of residence (%) - American Indian and Alaska Native
Place of birth - Born in state of residence (%) - Multirace
Place of birth - Born in state of residence (%) - Other Race
Place of birth - Born in other state (%)
Place of birth - Born in other state (%) - White
Place of birth - Born in other state (%) - Black or African American
Place of birth - Born in other state (%) - Asian
Place of birth - Born in other state (%) - Hispanic or Latino
Place of birth - Born in other state (%) - American Indian and Alaska Native
Place of birth - Born in other state (%) - Multirace
Place of birth - Born in other state (%) - Other Race
Place of birth - Native, outside of US (%)
Place of birth - Native, outside of US (%) - White
Place of birth - Native, outside of US (%) - Black or African American
Place of birth - Native, outside of US (%) - Asian
Place of birth - Native, outside of US (%) - Hispanic or Latino
Place of birth - Native, outside of US (%) - American Indian and Alaska Native
Place of birth - Native, outside of US (%) - Multirace
Place of birth - Native, outside of US (%) - Other Race
Place of birth - Foreign born (%)
Place of birth - Foreign born (%) - White
Place of birth - Foreign born (%) - Black or African American
Place of birth - Foreign born (%) - Asian
Place of birth - Foreign born (%) - Hispanic or Latino
Place of birth - Foreign born (%) - American Indian and Alaska Native
Place of birth - Foreign born (%) - Multirace
Place of birth - Foreign born (%) - Other Race
Residents speaking English at home (%)
Residents speaking English at home - Born in the United States (%)
Residents speaking English at home - Native, born elsewhere (%)
Residents speaking English at home - Foreign born (%)
Residents speaking Spanish at home (%)
Residents speaking Spanish at home - Born in the United States (%)
Residents speaking Spanish at home - Native, born elsewhere (%)
Residents speaking Spanish at home - Foreign born (%)
Residents speaking other language at home (%)
Residents speaking other language at home - Born in the United States (%)
Residents speaking other language at home - Native, born elsewhere (%)
Residents speaking other language at home - Foreign born (%)
Marital status - Never married (%)
Marital status - Now married (%)
Marital status - Separated (%)
Marital status - Widowed (%)
Marital status - Divorced (%)
Ancestries Reported - Arab (%)
Ancestries Reported - Czech (%)
Ancestries Reported - Danish (%)
Ancestries Reported - Dutch (%)
Ancestries Reported - English (%)
Ancestries Reported - French (%)
Ancestries Reported - French Canadian (%)
Ancestries Reported - German (%)
Ancestries Reported - Greek (%)
Ancestries Reported - Hungarian (%)
Ancestries Reported - Irish (%)
Ancestries Reported - Italian (%)
Ancestries Reported - Lithuanian (%)
Ancestries Reported - Norwegian (%)
Ancestries Reported - Polish (%)
Ancestries Reported - Portuguese (%)
Ancestries Reported - Russian (%)
Ancestries Reported - Scotch-Irish (%)
Ancestries Reported - Scottish (%)
Ancestries Reported - Slovak (%)
Ancestries Reported - Subsaharan African (%)
Ancestries Reported - Swedish (%)
Ancestries Reported - Swiss (%)
Ancestries Reported - Ukrainian (%)
Ancestries Reported - United States (%)
Ancestries Reported - Welsh (%)
Ancestries Reported - West Indian (%)
Ancestries Reported - Other (%)
Geographical mobility - Same house 1 year ago (%)
Geographical mobility - Same house 1 year ago (%) - White
Geographical mobility - Same house 1 year ago (%) - Black or African American
Geographical mobility - Same house 1 year ago (%) - Asian
Geographical mobility - Same house 1 year ago (%) - Hispanic or Latino
Geographical mobility - Same house 1 year ago (%) - American Indian and Alaska Native
Geographical mobility - Same house 1 year ago (%) - Multirace
Geographical mobility - Same house 1 year ago (%) - Other Race
Geographical mobility - Moved within same county (%)
Geographical mobility - Moved within same county (%) - White
Geographical mobility - Moved within same county (%) - Black or African American
Geographical mobility - Moved within same county (%) - Asian
Geographical mobility - Moved within same county (%) - Hispanic or Latino
Geographical mobility - Moved within same county (%) - American Indian and Alaska Native
Geographical mobility - Moved within same county (%) - Multirace
Geographical mobility - Moved within same county (%) - Other Race
Geographical mobility - Moved from different county within same state (%)
Geographical mobility - Moved from different county within same state (%) - White
Geographical mobility - Moved from different county within same state (%) - Black or African American
Geographical mobility - Moved from different county within same state (%) - Asian
Geographical mobility - Moved from different county within same state (%) - Hispanic or Latino
Geographical mobility - Moved from different county within same state (%) - American Indian and Alaska Native
Geographical mobility - Moved from different county within same state (%) - Multirace
Geographical mobility - Moved from different county within same state (%) - Other Race
Geographical mobility - Moved from different state (%)
Geographical mobility - Moved from different state (%) - White
Geographical mobility - Moved from different state (%) - Black or African American
Geographical mobility - Moved from different state (%) - Asian
Geographical mobility - Moved from different state (%) - Hispanic or Latino
Geographical mobility - Moved from different state (%) - American Indian and Alaska Native
Geographical mobility - Moved from different state (%) - Multirace
Geographical mobility - Moved from different state (%) - Other Race
Geographical mobility - Moved from abroad (%)
Geographical mobility - Moved from abroad (%) - White
Geographical mobility - Moved from abroad (%) - Black or African American
Geographical mobility - Moved from abroad (%) - Asian
Geographical mobility - Moved from abroad (%) - Hispanic or Latino
Geographical mobility - Moved from abroad (%) - American Indian and Alaska Native
Geographical mobility - Moved from abroad (%) - Multirace
Geographical mobility - Moved from abroad (%) - Other Race
Place of birth for the foreign-born population - Ireland (%)
Place of birth for the foreign-born population - Denmark (%)
Place of birth for the foreign-born population - Norway (%)
Place of birth for the foreign-born population - Sweden (%)
Place of birth for the foreign-born population - United Kingdom (%)
Place of birth for the foreign-born population - England (%)
Place of birth for the foreign-born population - Scotland (%)
Place of birth for the foreign-born population - Other Northern Europe (%)
Place of birth for the foreign-born population - Austria (%)
Place of birth for the foreign-born population - Belgium (%)
Place of birth for the foreign-born population - France (%)
Place of birth for the foreign-born population - Germany (%)
Place of birth for the foreign-born population - Netherlands (%)
Place of birth for the foreign-born population - Switzerland (%)
Place of birth for the foreign-born population - Other Western Europe (%)
Place of birth for the foreign-born population - Greece (%)
Place of birth for the foreign-born population - Italy (%)
Place of birth for the foreign-born population - Portugal (%)
Place of birth for the foreign-born population - Spain (%)
Place of birth for the foreign-born population - Other Southern Europe (%)
Place of birth for the foreign-born population - Albania (%)
Place of birth for the foreign-born population - Belarus (%)
Place of birth for the foreign-born population - Bosnia and Herzegovina (%)
Place of birth for the foreign-born population - Bulgaria (%)
Place of birth for the foreign-born population - Croatia (%)
Place of birth for the foreign-born population - Czechoslovakia (%)
Place of birth for the foreign-born population - Hungary (%)
Place of birth for the foreign-born population - Latvia (%)
Place of birth for the foreign-born population - Lithuania (%)
Place of birth for the foreign-born population - North Macedonia (Macedonia) (%)
Place of birth for the foreign-born population - Moldova (%)
Place of birth for the foreign-born population - Poland (%)
Place of birth for the foreign-born population - Romania (%)
Place of birth for the foreign-born population - Russia (%)
Place of birth for the foreign-born population - Serbia (%)
Place of birth for the foreign-born population - Ukraine (%)
Place of birth for the foreign-born population - Other Eastern Europe (%)
Place of birth for the foreign-born population - China (%)
Place of birth for the foreign-born population - Hong Kong (%)
Place of birth for the foreign-born population - Taiwan (%)
Place of birth for the foreign-born population - Japan (%)
Place of birth for the foreign-born population - Korea (%)
Place of birth for the foreign-born population - Other Eastern Asia (%)
Place of birth for the foreign-born population - Afghanistan (%)
Place of birth for the foreign-born population - Bangladesh (%)
Place of birth for the foreign-born population - India (%)
Place of birth for the foreign-born population - Iran (%)
Place of birth for the foreign-born population - Kazakhstan (%)
Place of birth for the foreign-born population - Nepal (%)
Place of birth for the foreign-born population - Pakistan (%)
Place of birth for the foreign-born population - Sri Lanka (%)
Place of birth for the foreign-born population - Uzbekistan (%)
Place of birth for the foreign-born population - Other South Central Asia (%)
Place of birth for the foreign-born population - Burma (%)
Place of birth for the foreign-born population - Cambodia (%)
Place of birth for the foreign-born population - Indonesia (%)
Place of birth for the foreign-born population - Laos (%)
Place of birth for the foreign-born population - Malaysia (%)
Place of birth for the foreign-born population - Philippines (%)
Place of birth for the foreign-born population - Singapore (%)
Place of birth for the foreign-born population - Thailand (%)
Place of birth for the foreign-born population - Vietnam (%)
Place of birth for the foreign-born population - Other South Eastern Asia (%)
Place of birth for the foreign-born population - Armenia (%)
Place of birth for the foreign-born population - Iraq (%)
Place of birth for the foreign-born population - Israel (%)
Place of birth for the foreign-born population - Jordan (%)
Place of birth for the foreign-born population - Kuwait (%)
Place of birth for the foreign-born population - Lebanon (%)
Place of birth for the foreign-born population - Saudi Arabia (%)
Place of birth for the foreign-born population - Syria (%)
Place of birth for the foreign-born population - Turkey (%)
Place of birth for the foreign-born population - Yemen (%)
Place of birth for the foreign-born population - Other Western Asia (%)
Place of birth for the foreign-born population - Eritrea (%)
Place of birth for the foreign-born population - Ethiopia (%)
Place of birth for the foreign-born population - Kenya (%)
Place of birth for the foreign-born population - Somalia (%)
Place of birth for the foreign-born population - Uganda (%)
Place of birth for the foreign-born population - Zimbabwe (%)
Place of birth for the foreign-born population - Other Eastern Africa (%)
Place of birth for the foreign-born population - Cameroon (%)
Place of birth for the foreign-born population - Congo (%)
Place of birth for the foreign-born population - Democratic Republic of Congo (Zaire) (%)
Place of birth for the foreign-born population - Other Middle Africa (%)
Place of birth for the foreign-born population - Egypt (%)
Place of birth for the foreign-born population - Morocco (%)
Place of birth for the foreign-born population - Sudan (%)
Place of birth for the foreign-born population - Other Northern Africa (%)
Place of birth for the foreign-born population - South Africa (%)
Place of birth for the foreign-born population - Other Southern Africa (%)
Place of birth for the foreign-born population - Cabo Verde (%)
Place of birth for the foreign-born population - Ghana (%)
Place of birth for the foreign-born population - Liberia (%)
Place of birth for the foreign-born population - Nigeria (%)
Place of birth for the foreign-born population - Senegal (%)
Place of birth for the foreign-born population - Sierra Leone (%)
Place of birth for the foreign-born population - Other Western Africa (%)
Place of birth for the foreign-born population - Australia (%)
Place of birth for the foreign-born population - New Zealand (%)
Place of birth for the foreign-born population - Fiji (%)
Place of birth for the foreign-born population - Micronesia (%)
Place of birth for the foreign-born population - Bahamas (%)
Place of birth for the foreign-born population - Barbados (%)
Place of birth for the foreign-born population - Cuba (%)
Place of birth for the foreign-born population - Dominica (%)
Place of birth for the foreign-born population - Dominican Republic (%)
Place of birth for the foreign-born population - Grenada (%)
Place of birth for the foreign-born population - Haiti (%)
Place of birth for the foreign-born population - Jamaica (%)
Place of birth for the foreign-born population - St. Vincent and the Grenadines (%)
Place of birth for the foreign-born population - Trinidad and Tobago (%)
Place of birth for the foreign-born population - West Indies (%)
Place of birth for the foreign-born population - Other Caribbean (%)
Place of birth for the foreign-born population - Belize (%)
Place of birth for the foreign-born population - Costa Rica (%)
Place of birth for the foreign-born population - El Salvador (%)
Place of birth for the foreign-born population - Guatemala (%)
Place of birth for the foreign-born population - Honduras (%)
Place of birth for the foreign-born population - Mexico (%)
Place of birth for the foreign-born population - Nicaragua (%)
Place of birth for the foreign-born population - Panama (%)
Place of birth for the foreign-born population - Other Central America (%)
Place of birth for the foreign-born population - Argentina (%)
Place of birth for the foreign-born population - Bolivia (%)
Place of birth for the foreign-born population - Brazil (%)
Place of birth for the foreign-born population - Chile (%)
Place of birth for the foreign-born population - Colombia (%)
Place of birth for the foreign-born population - Ecuador (%)
Place of birth for the foreign-born population - Guyana (%)
Place of birth for the foreign-born population - Peru (%)
Place of birth for the foreign-born population - Uruguay (%)
Place of birth for the foreign-born population - Venezuela (%)
Place of birth for the foreign-born population - Other South America (%)
Place of birth for the foreign-born population - Canada (%)
Place of birth for the foreign-born population - Other Northern America (%)
Place of birth for the foreign-born population - Other (%)
Latest news about races in Bloomington, MN collected exclusively by city-data.com from local newspapers, TV, and radio stations
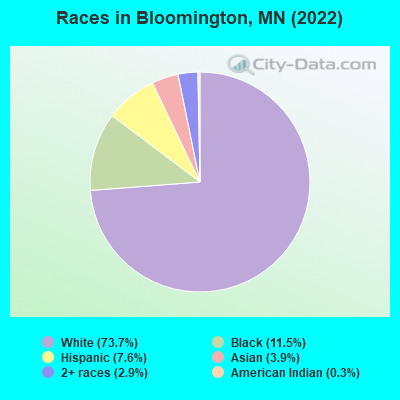
According to 2022 data, the most numerous races in Bloomington, MN are White alone (64,744 residents), Black alone (10,123 residents), and Hispanic (6,654 residents). 83.6% of Bloomington residents speak English at home. 14.5% of Bloomington, MN residents are foreign-born (5.0% born in Africa, 4.1% born in Asia, 3.6% born in Latin America), which is 44.9% greater than the foreign-born rate of 8.0% across the entire state of Minnesota.
Race distribution in Bloomington
2000 2022
74,008 86.9% White alone 4,306 5.1% Asian alone 2,854 3.4% Black alone 2,290 2.7% Hispanic 1,290 1.5% Two or more races 265 0.3% American Indian alone 132 0.2% Other race alone 27 0.03% Native Hawaiian and Other
64,744 73.7% White alone 10,123 11.5% Black alone 6,654 7.6% Hispanic 3,461 3.9% Asian alone 2,519 2.9% Two or more races 298 0.3% American Indian alone
2000 2022
4,337,143 88.2% White alone 168,813 3.4% Black alone 143,382 2.9% Hispanic 141,083 2.9% Asian alone 70,304 1.4% Two or more races 52,009 1.1% American Indian alone 5,031 0.1% Other race alone 1,714 0.03% Native Hawaiian and Other
4,356,347 76.2% White alone 395,179 6.9% Black alone 333,830 5.8% Hispanic 294,800 5.2% Asian alone 259,649 4.5% Two or more races 42,125 0.7% American Indian alone 32,976 0.6% Other race alone 2,278 0.04% Native Hawaiian and Other
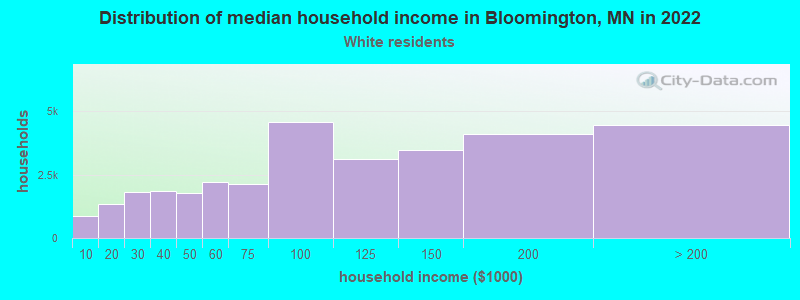
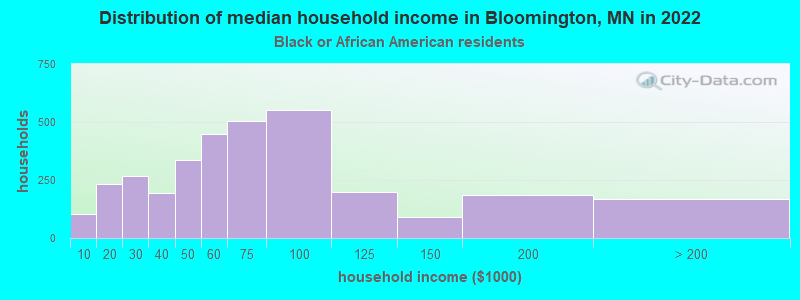
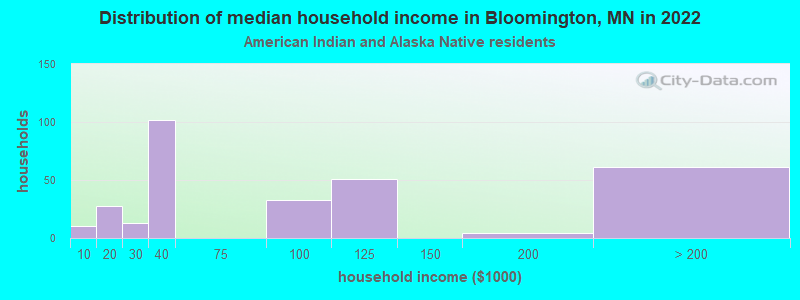
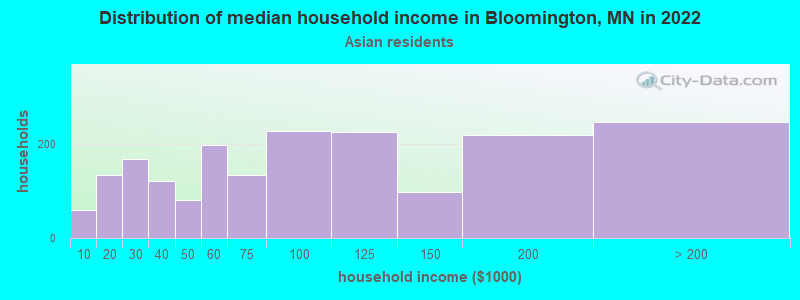
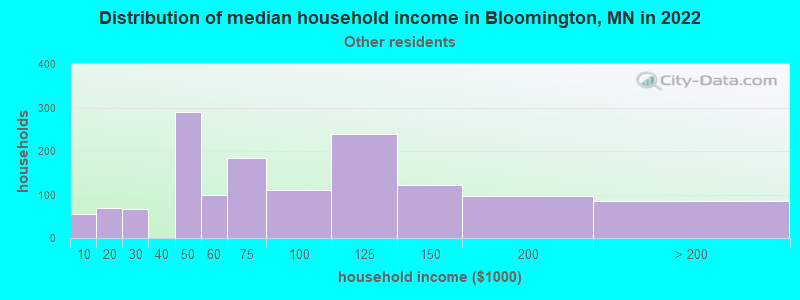
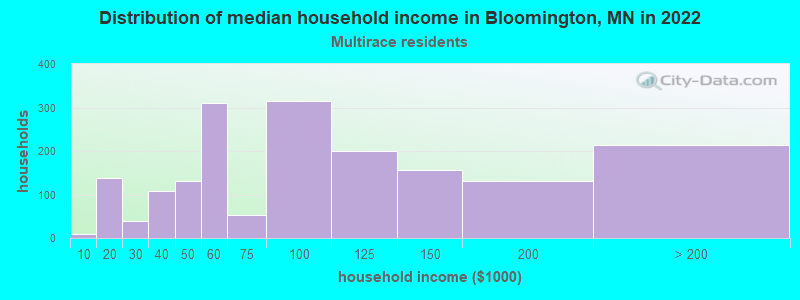
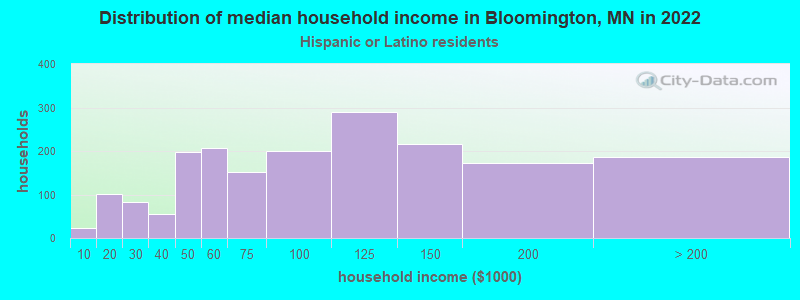
Income and house value in Bloomington Median household income in 2022 $93,435 White non-Hispanic householders$60,861 Black householders$68,767 Asian householders$111,591 Some other race householders$98,354 Two or more races householders$110,985 Hispanic or Latino race householdersMedian 2022 house value $357,583 White Non-Hispanic householders$286,357 Black or African American householders$295,321 American Indian or Alaska Native householders $350,800 Asian householders$205,925 Native Hawaiian and other Pacific Islander householders$325,604 Some other race householders$324,635 Two or more races householders$335,537 Hispanic or Latino householders
Median age by race in Bloomington
49.3 Median age for White residents48.2 51.1 27.8 Median age for Black or African American residents23.1 36.0 27.6 Median age for American Indian / Alaska Native residents44.6 16.7 50.3 Median age for Asian residents54.1 46.9 -666,666,666.0 Median age for Native Hawaiian / Pacific Islander residents-666,666,666.0 -666,666,666.0 25.3 Median age for Other race residents25.0 26.5 24.2 Median age for Two or more races residents25.0 20.9 50.3 Median age for White alone residents49.3 51.3 20.9 Median age for Hispanic or Latino residents24.2 20.5
Owner/renter occupied households by race in Bloomington
House owners and renters - White residents 23,737 74.9% Owner occupied7,953 25.1% Renter occupiedHouse owners and renters - Black or African American residents 439 11.8% Owner occupied3,267 88.2% Renter occupiedHouse owners and renters - American Indian / Alaska Native residents 109 34.7% Owner occupied204 65.3% Renter occupiedHouse owners and renters - Asian residents 1,013 53.1% Owner occupied894 46.9% Renter occupiedHouse owners and renters - Other race residents 361 60.6% Owner occupied235 39.4% Renter occupiedHouse owners and renters - Two or more races residents 639 68.4% Owner occupied295 31.6% Renter occupiedHouse owners and renters - White alone residents 23,638 75.4% Owner occupied7,714 24.6% Renter occupiedHouse owners and renters - Hispanic or Latino residents 674 51.0% Owner occupied648 49.0% Renter occupied
Language usage in Bloomington
English speakers - Total 83.6% of residents of Bloomington speak English at home.
4.2% of residents speak Spanish at home 2,184 63.7% Speak English very well1,244 36.3% Speak English less than very well12.2% of residents speak other language at home 4,938 49.2% Speak English very well5,094 50.8% Speak English less than very well
English speakers - Born in the United States 94.6% of residents of Bloomington speak English at home.
2.2% of residents speak Spanish at home 447 88.9% Speak English very well56 11.1% Speak English less than very well3.2% of residents speak other language at home 660 92.4% Speak English very well54 7.6% Speak English less than very well
All residents speak only English at home
English speakers - Foreign-born 11.1% of residents of Bloomington speak English at home.
8.9% of residents speak Spanish at home 91 9.3% Speak English very well883 90.7% Speak English less than very well80.0% of residents speak other language at home 3,818 43.5% Speak English very well4,950 56.5% Speak English less than very well
White (Caucasian) - Speak only English Native:
97.3% (58,566)Foreign-born:
27.7% (470)
White (Caucasian) - Speak another language Native:
2.7% (1,595)Foreign-born:
72.3% (1,224)
Black or African American - Speak only English Native:
81.3% (3,418)Foreign-born:
9.1% (434)
Black or African American - Speak another language Native:
18.9% (797)Foreign-born:
96.6% (4,619)
American Indian / Alaska Native - Speak another language Native:
35.4% (152)Foreign-born:
76.9% (85)
Asian - Speak only English Native:
65.2% (770)Foreign-born:
14.6% (334)
Asian - Speak another language Native:
34.8% (411)Foreign-born:
85.4% (1,946)
Other race - Speak only English Native:
50.8% (1,706)Foreign-born:
12.2% (222)
Other race - Speak another language Native:
49.1% (1,647)Foreign-born:
87.9% (1,605)
Two or more races - Speak only English Native:
93.2% (4,870)Foreign-born:
12.9% (133)
Two or more races - Speak another language Native:
7.7% (403)Foreign-born:
86.3% (891)
White alone - Speak only English Native:
98.3% (58,228)Foreign-born:
30.3% (470)
White alone - Speak another language Native:
1.7% (1,025)Foreign-born:
69.7% (1,083)
Hispanic or Latino - Speak only English Native:
50.7% (2,350)Foreign-born:
19.2% (231)
Hispanic or Latino - Speak another language Native:
49.3% (2,282)Foreign-born:
80.8% (974)
Foreign-born residents in Bloomington 12,838 residents are foreign born (5.0% Africa , 4.1% Asia , 3.6% Latin America ).
This city:
14.5%Minnesota:
8.5%
Marital status for residents in Bloomington Marital status - White (Caucasian) population 15 years and over
Males 31.0% Never married56.9% Now married0.3% Separated4.2% Widowed7.6% DivorcedFemales 25.4% Never married53.5% Now married0.0% Separated9.6% Widowed11.5% DivorcedWomen who gave birth in the past 12 months Now married:
92.2% (822)Unmarried:
7.8% (70)
Women who did not give birth in the past 12 months Now married:
45.8% (4,917)Unmarried:
54.2% (5,827)
Marital status - Black or African American population 15 years and over
Males 48.7% Never married44.6% Now married1.4% Separated0.0% Widowed5.3% DivorcedFemales 34.0% Never married37.6% Now married13.8% Separated5.0% Widowed9.6% DivorcedWomen who gave birth in the past 12 months Now married:
44.2% (86)Unmarried:
55.8% (109)
Women who did not give birth in the past 12 months Now married:
36.2% (973)Unmarried:
63.8% (1,711)
Marital status - American Indian / Alaska Native population 15 years and over
Males 51.7% Never married27.5% Now married0.0% Separated0.0% Widowed20.8% DivorcedFemales 15.5% Never married51.0% Now married18.4% Separated4.4% Widowed10.7% DivorcedWomen who did not give birth in the past 12 months Now married:
63.4% (75)Unmarried:
36.6% (43)
Marital status - Asian population 15 years and over
Males 42.4% Never married53.1% Now married0.9% Separated1.0% Widowed2.5% DivorcedFemales 36.9% Never married49.6% Now married1.0% Separated2.9% Widowed9.6% DivorcedWomen who gave birth in the past 12 months Now married:
79.7% (63)Unmarried:
20.3% (16)
Women who did not give birth in the past 12 months Now married:
35.7% (556)Unmarried:
64.3% (1,001)
Marital status - Other race population 15 years and over
Males 59.4% Never married38.3% Now married0.0% Separated0.0% Widowed2.3% DivorcedFemales 43.3% Never married44.1% Now married0.0% Separated3.2% Widowed9.5% DivorcedWomen who gave birth in the past 12 months Now married:
0.0% (0)Unmarried:
100.0% (2)
Women who did not give birth in the past 12 months Now married:
35.2% (413)Unmarried:
64.8% (762)
Marital status - Two or more races population 15 years and over
Males 54.4% Never married39.3% Now married0.0% Separated0.0% Widowed6.4% DivorcedFemales 47.4% Never married39.3% Now married0.0% Separated0.6% Widowed12.7% DivorcedWomen who gave birth in the past 12 months Now married:
45.8% (59)Unmarried:
54.2% (70)
Women who did not give birth in the past 12 months Now married:
29.1% (421)Unmarried:
70.9% (1,022)
Marital status - White alone, not Hispanic / Latino population 15 years and over
Males 30.4% Never married57.3% Now married0.3% Separated4.3% Widowed7.7% DivorcedFemales 25.7% Never married53.3% Now married0.0% Separated9.7% Widowed11.3% DivorcedWomen who gave birth in the past 12 months Now married:
92.2% (822)Unmarried:
7.8% (70)
Women who did not give birth in the past 12 months Now married:
45.2% (4,725)Unmarried:
54.8% (5,729)
Marital status - Hispanic or Latino population 15 years and over
Males 57.8% Never married39.2% Now married0.9% Separated0.0% Widowed2.1% DivorcedFemales 42.7% Never married44.6% Now married0.5% Separated3.1% Widowed9.1% DivorcedWomen who gave birth in the past 12 months Now married:
58.8% (41)Unmarried:
41.2% (29)
Women who did not give birth in the past 12 months Now married:
37.8% (742)Unmarried:
62.2% (1,223)
Ancestries in Bloomington
6,618 16.9% German3,397 8.7% Norwegian2,001 5.1% Irish1,975 5.0% Somali1,596 4.1% Swedish1,592 4.1% American1,130 2.9% English1,080 2.8% European748 1.9% Scandinavian691 1.8% Ethiopian562 1.4% Iranian548 1.4% African523 1.3% Polish498 1.3% Italian311 0.8% Czech279 0.7% French263 0.7% Sudanese256 0.7% Nigerian226 0.6% Northern European211 0.5% Ghanaian203 0.5% Eastern European181 0.5% Scottish178 0.5% Scotch-Irish131 0.3% French Canadian130 0.3% Dutch127 0.3% Kenyan119 0.3% Latvian116 0.3% Sierra Leonean100 0.3% Finnish93 0.2% Ukrainian91 0.2% Liberian83 0.2% Greek72 0.2% Russian71 0.2% Yugoslavian68 0.2% Brazilian66 0.2% Ugandan65 0.2% Danish59 0.2% Czechoslovakian56 0.1% Hungarian56 0.1% Icelander54 0.1% Belgian44 0.1% Austrian44 0.1% Luxembourger39 0.10% Slovene38 0.10% Albanian33 0.08% British27 0.07% Lebanese27 0.07% Jamaican26 0.07% Australian24 0.06% Welsh20 0.05% Macedonian18 0.05% Swiss16 0.04% Canadian15 0.04% West Indian13 0.03% Egyptian13 0.03% Armenian13 0.03% Slovak13 0.03% Haitian12 0.03% Guyanese11 0.03% Jordanian9 0.02% Arab9 0.02% Pennsylvania German8 0.02% Croatian7 0.02% Celtic5 0.01% Serbian
Geographical mobility in Bloomington Same house 1 year ago 58,625 90.6% White (Caucasian)5,407 54.1% Black or African American523 94.7% American Indian / Alaska Native2,682 77.5% Asian4,327 83.3% Other race6,384 87.7% Two or more races57,653 90.6% White alone, not Hispanic / Latino6,534 84.5% Hispanic or LatinoMoved within same county 2,999 4.6% White / Caucasian1,608 16.1% Black or African American6 1.1% American Indian / Alaska Native454 13.1% Asian1 94.6% Native Hawaiian / Pacific Islander576 11.1% Other race264 3.6% Two or more races2,999 4.7% White alone, not Hispanic / Latino638 8.3% Hispanic or LatinoMoved within same state 1,712 2.6% White / Caucasian477 4.8% Black or African American37 6.8% American Indian / Alaska Native176 5.1% Asian142 2.7% Other race370 5.1% Two or more races1,712 2.7% White alone, not Hispanic / Latino165 2.1% Hispanic or LatinoMoved from different state 1,279 2.0% White / Caucasian111 1.1% Black or African American1 0.2% American Indian / Alaska Native149 4.3% Asian83 1.6% Other race459 6.3% Two or more races1,202 1.9% White alone, not Hispanic / Latino419 5.4% Hispanic or LatinoMoved from abroad 82 0.1% White2,387 23.9% Black or African American26 0.5% Other race82 0.1% White alone, not Hispanic / Latino26 0.3% Hispanic or Latino
Children Nativity (place of birth) in Bloomington
Children under 6 years - Living with two parents Both parents native 3,174 100.0% NativeBoth parents foreign-born 884 90.3% Native95 9.7% Foreign-bornOne native, one foreign-born parent 279 100.0% NativeChildren under 6 years - Living with one parent Native parent 780 97.1% Native23 2.9% Foreign-bornForeign-born parent 137 79.7% Native35 20.3% Foreign-bornChildren 6 to 17 years - Living with two parents Both parents native 5,069 98.1% Native97 1.9% Foreign-bornBoth parents foreign-born 1,424 78.3% Native395 21.7% Foreign-bornOne native, one foreign-born parent 776 96.8% Native25 3.2% Foreign-bornChildren 6 to 17 years - Living with one parent Native parent 1,841 100.0% NativeForeign-born parent 759 59.4% Native519 40.6% Foreign-born
Place of birth for residents in Bloomington 4,593 Africa3,774 Asia3,549 Americas3,297 Latin America3,270 Eastern Africa2,178 Central America1,467 South Eastern Asia1,308 South Central Asia996 Western Africa879 Europe774 Eastern Asia717 South America487 China401 Caribbean345 Eastern Europe321 Northern Africa252 Northern Europe251 Northern America233 Western Europe224 Western Asia47 Southern Europe40 Oceania40 Australia and New Zealand Subregion1,822 Mexico1,387 Somalia1,008 Kenya872 Vietnam812 Ethiopia758 India405 China310 Sudan300 Cuba267 Ghana261 Korea256 Guyana251 Canada246 Nigeria209 Uzbekistan198 Philippines195 Liberia187 Germany167 Laos143 Guatemala140 El Salvador132 Togo126 United Arab Emirates125 Sierra Leone109 Pakistan104 Thailand96 Cambodia95 Venezuela91 England87 Bolivia84 Russia71 Ecuador66 Brazil66 Nepal64 Latvia63 Uganda61 Bangladesh58 Iran51 Taiwan46 Czechoslovakia45 Albania44 Sri Lanka43 Colombia40 Australia40 France38 Dominican Republic37 Peru35 Scotland35 Jamaica34 Saudi Arabia31 Ukraine31 Argentina30 Nicaragua30 Hong Kong27 Italy27 Chile27 Malaysia25 Ireland24 Iraq24 Japan23 Honduras20 Sweden19 Greece16 Bosnia and Herzegovina15 Moldova14 Norway13 Senegal12 Panama11 Egypt8 Belarus8 Lebanon7 Denmark6 Jordan6 Netherlands5 Costa Rica4 Bahamas
Grandparents responsible for own grandchildren in Bloomington
Grandparents (30 to 59 years) White / Caucasian 69 81.2% Responsible for grandchildren16 18.8% Not responsible for grandchildrenBlack or African American 158 71.2% Responsible for grandchildren64 28.8% Not responsible for grandchildrenAsian 49 100.0% Not responsible for grandchildrenOther race 28 100.0% Not responsible for grandchildrenWhite alone, not Hispanic / Latino 47 72.2% Responsible for grandchildren18 27.8% Not responsible for grandchildrenHispanic or Latino 14 100.0% Not responsible for grandchildrenGrandparents (60 years and over) White / Caucasian 92 31.0% Responsible for grandchildren206 69.0% Not responsible for grandchildrenBlack or African American 3 100.0% Not responsible for grandchildrenAsian 9 8.0% Responsible for grandchildren100 92.0% Not responsible for grandchildrenOther race 41 100.0% Not responsible for grandchildrenWhite alone, not Hispanic / Latino 95 31.7% Responsible for grandchildren204 68.3% Not responsible for grandchildrenHispanic or Latino 52 100.0% Not responsible for grandchildren