Races in Belton, Texas (TX) Detailed Stats
Data:
Races - White alone (%)
Races - White alone (% change since 2000)
Races - Black alone (%)
Races - Black alone (% change since 2000)
Races - American Indian alone (%)
Races - American Indian alone (% change since 2000)
Races - Asian alone (%)
Races - Asian alone (% change since 2000)
Races - Hispanic (%)
Races - Hispanic (% change since 2000)
Races - Native Hawaiian and Other Pacific Islander alone (%)
Races - Native Hawaiian and Other Pacific Islander alone (% change since 2000)
Races - Two or more races(%)
Races - Two or more races(% change since 2000)
Races - Other race alone (%)
Races - Other race alone (% change since 2000)
Racial diversity
Place of birth - Born in state of residence (%)
Place of birth - Born in state of residence (%) - White
Place of birth - Born in state of residence (%) - Black or African American
Place of birth - Born in state of residence (%) - Asian
Place of birth - Born in state of residence (%) - Hispanic or Latino
Place of birth - Born in state of residence (%) - American Indian and Alaska Native
Place of birth - Born in state of residence (%) - Multirace
Place of birth - Born in state of residence (%) - Other Race
Place of birth - Born in other state (%)
Place of birth - Born in other state (%) - White
Place of birth - Born in other state (%) - Black or African American
Place of birth - Born in other state (%) - Asian
Place of birth - Born in other state (%) - Hispanic or Latino
Place of birth - Born in other state (%) - American Indian and Alaska Native
Place of birth - Born in other state (%) - Multirace
Place of birth - Born in other state (%) - Other Race
Place of birth - Native, outside of US (%)
Place of birth - Native, outside of US (%) - White
Place of birth - Native, outside of US (%) - Black or African American
Place of birth - Native, outside of US (%) - Asian
Place of birth - Native, outside of US (%) - Hispanic or Latino
Place of birth - Native, outside of US (%) - American Indian and Alaska Native
Place of birth - Native, outside of US (%) - Multirace
Place of birth - Native, outside of US (%) - Other Race
Place of birth - Foreign born (%)
Place of birth - Foreign born (%) - White
Place of birth - Foreign born (%) - Black or African American
Place of birth - Foreign born (%) - Asian
Place of birth - Foreign born (%) - Hispanic or Latino
Place of birth - Foreign born (%) - American Indian and Alaska Native
Place of birth - Foreign born (%) - Multirace
Place of birth - Foreign born (%) - Other Race
Residents speaking English at home (%)
Residents speaking English at home - Born in the United States (%)
Residents speaking English at home - Native, born elsewhere (%)
Residents speaking English at home - Foreign born (%)
Residents speaking Spanish at home (%)
Residents speaking Spanish at home - Born in the United States (%)
Residents speaking Spanish at home - Native, born elsewhere (%)
Residents speaking Spanish at home - Foreign born (%)
Residents speaking other language at home (%)
Residents speaking other language at home - Born in the United States (%)
Residents speaking other language at home - Native, born elsewhere (%)
Residents speaking other language at home - Foreign born (%)
Marital status - Never married (%)
Marital status - Now married (%)
Marital status - Separated (%)
Marital status - Widowed (%)
Marital status - Divorced (%)
Ancestries Reported - Arab (%)
Ancestries Reported - Czech (%)
Ancestries Reported - Danish (%)
Ancestries Reported - Dutch (%)
Ancestries Reported - English (%)
Ancestries Reported - French (%)
Ancestries Reported - French Canadian (%)
Ancestries Reported - German (%)
Ancestries Reported - Greek (%)
Ancestries Reported - Hungarian (%)
Ancestries Reported - Irish (%)
Ancestries Reported - Italian (%)
Ancestries Reported - Lithuanian (%)
Ancestries Reported - Norwegian (%)
Ancestries Reported - Polish (%)
Ancestries Reported - Portuguese (%)
Ancestries Reported - Russian (%)
Ancestries Reported - Scotch-Irish (%)
Ancestries Reported - Scottish (%)
Ancestries Reported - Slovak (%)
Ancestries Reported - Subsaharan African (%)
Ancestries Reported - Swedish (%)
Ancestries Reported - Swiss (%)
Ancestries Reported - Ukrainian (%)
Ancestries Reported - United States (%)
Ancestries Reported - Welsh (%)
Ancestries Reported - West Indian (%)
Ancestries Reported - Other (%)
Geographical mobility - Same house 1 year ago (%)
Geographical mobility - Same house 1 year ago (%) - White
Geographical mobility - Same house 1 year ago (%) - Black or African American
Geographical mobility - Same house 1 year ago (%) - Asian
Geographical mobility - Same house 1 year ago (%) - Hispanic or Latino
Geographical mobility - Same house 1 year ago (%) - American Indian and Alaska Native
Geographical mobility - Same house 1 year ago (%) - Multirace
Geographical mobility - Same house 1 year ago (%) - Other Race
Geographical mobility - Moved within same county (%)
Geographical mobility - Moved within same county (%) - White
Geographical mobility - Moved within same county (%) - Black or African American
Geographical mobility - Moved within same county (%) - Asian
Geographical mobility - Moved within same county (%) - Hispanic or Latino
Geographical mobility - Moved within same county (%) - American Indian and Alaska Native
Geographical mobility - Moved within same county (%) - Multirace
Geographical mobility - Moved within same county (%) - Other Race
Geographical mobility - Moved from different county within same state (%)
Geographical mobility - Moved from different county within same state (%) - White
Geographical mobility - Moved from different county within same state (%) - Black or African American
Geographical mobility - Moved from different county within same state (%) - Asian
Geographical mobility - Moved from different county within same state (%) - Hispanic or Latino
Geographical mobility - Moved from different county within same state (%) - American Indian and Alaska Native
Geographical mobility - Moved from different county within same state (%) - Multirace
Geographical mobility - Moved from different county within same state (%) - Other Race
Geographical mobility - Moved from different state (%)
Geographical mobility - Moved from different state (%) - White
Geographical mobility - Moved from different state (%) - Black or African American
Geographical mobility - Moved from different state (%) - Asian
Geographical mobility - Moved from different state (%) - Hispanic or Latino
Geographical mobility - Moved from different state (%) - American Indian and Alaska Native
Geographical mobility - Moved from different state (%) - Multirace
Geographical mobility - Moved from different state (%) - Other Race
Geographical mobility - Moved from abroad (%)
Geographical mobility - Moved from abroad (%) - White
Geographical mobility - Moved from abroad (%) - Black or African American
Geographical mobility - Moved from abroad (%) - Asian
Geographical mobility - Moved from abroad (%) - Hispanic or Latino
Geographical mobility - Moved from abroad (%) - American Indian and Alaska Native
Geographical mobility - Moved from abroad (%) - Multirace
Geographical mobility - Moved from abroad (%) - Other Race
Place of birth for the foreign-born population - Ireland (%)
Place of birth for the foreign-born population - Denmark (%)
Place of birth for the foreign-born population - Norway (%)
Place of birth for the foreign-born population - Sweden (%)
Place of birth for the foreign-born population - United Kingdom (%)
Place of birth for the foreign-born population - England (%)
Place of birth for the foreign-born population - Scotland (%)
Place of birth for the foreign-born population - Other Northern Europe (%)
Place of birth for the foreign-born population - Austria (%)
Place of birth for the foreign-born population - Belgium (%)
Place of birth for the foreign-born population - France (%)
Place of birth for the foreign-born population - Germany (%)
Place of birth for the foreign-born population - Netherlands (%)
Place of birth for the foreign-born population - Switzerland (%)
Place of birth for the foreign-born population - Other Western Europe (%)
Place of birth for the foreign-born population - Greece (%)
Place of birth for the foreign-born population - Italy (%)
Place of birth for the foreign-born population - Portugal (%)
Place of birth for the foreign-born population - Spain (%)
Place of birth for the foreign-born population - Other Southern Europe (%)
Place of birth for the foreign-born population - Albania (%)
Place of birth for the foreign-born population - Belarus (%)
Place of birth for the foreign-born population - Bosnia and Herzegovina (%)
Place of birth for the foreign-born population - Bulgaria (%)
Place of birth for the foreign-born population - Croatia (%)
Place of birth for the foreign-born population - Czechoslovakia (%)
Place of birth for the foreign-born population - Hungary (%)
Place of birth for the foreign-born population - Latvia (%)
Place of birth for the foreign-born population - Lithuania (%)
Place of birth for the foreign-born population - North Macedonia (Macedonia) (%)
Place of birth for the foreign-born population - Moldova (%)
Place of birth for the foreign-born population - Poland (%)
Place of birth for the foreign-born population - Romania (%)
Place of birth for the foreign-born population - Russia (%)
Place of birth for the foreign-born population - Serbia (%)
Place of birth for the foreign-born population - Ukraine (%)
Place of birth for the foreign-born population - Other Eastern Europe (%)
Place of birth for the foreign-born population - China (%)
Place of birth for the foreign-born population - Hong Kong (%)
Place of birth for the foreign-born population - Taiwan (%)
Place of birth for the foreign-born population - Japan (%)
Place of birth for the foreign-born population - Korea (%)
Place of birth for the foreign-born population - Other Eastern Asia (%)
Place of birth for the foreign-born population - Afghanistan (%)
Place of birth for the foreign-born population - Bangladesh (%)
Place of birth for the foreign-born population - India (%)
Place of birth for the foreign-born population - Iran (%)
Place of birth for the foreign-born population - Kazakhstan (%)
Place of birth for the foreign-born population - Nepal (%)
Place of birth for the foreign-born population - Pakistan (%)
Place of birth for the foreign-born population - Sri Lanka (%)
Place of birth for the foreign-born population - Uzbekistan (%)
Place of birth for the foreign-born population - Other South Central Asia (%)
Place of birth for the foreign-born population - Burma (%)
Place of birth for the foreign-born population - Cambodia (%)
Place of birth for the foreign-born population - Indonesia (%)
Place of birth for the foreign-born population - Laos (%)
Place of birth for the foreign-born population - Malaysia (%)
Place of birth for the foreign-born population - Philippines (%)
Place of birth for the foreign-born population - Singapore (%)
Place of birth for the foreign-born population - Thailand (%)
Place of birth for the foreign-born population - Vietnam (%)
Place of birth for the foreign-born population - Other South Eastern Asia (%)
Place of birth for the foreign-born population - Armenia (%)
Place of birth for the foreign-born population - Iraq (%)
Place of birth for the foreign-born population - Israel (%)
Place of birth for the foreign-born population - Jordan (%)
Place of birth for the foreign-born population - Kuwait (%)
Place of birth for the foreign-born population - Lebanon (%)
Place of birth for the foreign-born population - Saudi Arabia (%)
Place of birth for the foreign-born population - Syria (%)
Place of birth for the foreign-born population - Turkey (%)
Place of birth for the foreign-born population - Yemen (%)
Place of birth for the foreign-born population - Other Western Asia (%)
Place of birth for the foreign-born population - Eritrea (%)
Place of birth for the foreign-born population - Ethiopia (%)
Place of birth for the foreign-born population - Kenya (%)
Place of birth for the foreign-born population - Somalia (%)
Place of birth for the foreign-born population - Uganda (%)
Place of birth for the foreign-born population - Zimbabwe (%)
Place of birth for the foreign-born population - Other Eastern Africa (%)
Place of birth for the foreign-born population - Cameroon (%)
Place of birth for the foreign-born population - Congo (%)
Place of birth for the foreign-born population - Democratic Republic of Congo (Zaire) (%)
Place of birth for the foreign-born population - Other Middle Africa (%)
Place of birth for the foreign-born population - Egypt (%)
Place of birth for the foreign-born population - Morocco (%)
Place of birth for the foreign-born population - Sudan (%)
Place of birth for the foreign-born population - Other Northern Africa (%)
Place of birth for the foreign-born population - South Africa (%)
Place of birth for the foreign-born population - Other Southern Africa (%)
Place of birth for the foreign-born population - Cabo Verde (%)
Place of birth for the foreign-born population - Ghana (%)
Place of birth for the foreign-born population - Liberia (%)
Place of birth for the foreign-born population - Nigeria (%)
Place of birth for the foreign-born population - Senegal (%)
Place of birth for the foreign-born population - Sierra Leone (%)
Place of birth for the foreign-born population - Other Western Africa (%)
Place of birth for the foreign-born population - Australia (%)
Place of birth for the foreign-born population - New Zealand (%)
Place of birth for the foreign-born population - Fiji (%)
Place of birth for the foreign-born population - Micronesia (%)
Place of birth for the foreign-born population - Bahamas (%)
Place of birth for the foreign-born population - Barbados (%)
Place of birth for the foreign-born population - Cuba (%)
Place of birth for the foreign-born population - Dominica (%)
Place of birth for the foreign-born population - Dominican Republic (%)
Place of birth for the foreign-born population - Grenada (%)
Place of birth for the foreign-born population - Haiti (%)
Place of birth for the foreign-born population - Jamaica (%)
Place of birth for the foreign-born population - St. Vincent and the Grenadines (%)
Place of birth for the foreign-born population - Trinidad and Tobago (%)
Place of birth for the foreign-born population - West Indies (%)
Place of birth for the foreign-born population - Other Caribbean (%)
Place of birth for the foreign-born population - Belize (%)
Place of birth for the foreign-born population - Costa Rica (%)
Place of birth for the foreign-born population - El Salvador (%)
Place of birth for the foreign-born population - Guatemala (%)
Place of birth for the foreign-born population - Honduras (%)
Place of birth for the foreign-born population - Mexico (%)
Place of birth for the foreign-born population - Nicaragua (%)
Place of birth for the foreign-born population - Panama (%)
Place of birth for the foreign-born population - Other Central America (%)
Place of birth for the foreign-born population - Argentina (%)
Place of birth for the foreign-born population - Bolivia (%)
Place of birth for the foreign-born population - Brazil (%)
Place of birth for the foreign-born population - Chile (%)
Place of birth for the foreign-born population - Colombia (%)
Place of birth for the foreign-born population - Ecuador (%)
Place of birth for the foreign-born population - Guyana (%)
Place of birth for the foreign-born population - Peru (%)
Place of birth for the foreign-born population - Uruguay (%)
Place of birth for the foreign-born population - Venezuela (%)
Place of birth for the foreign-born population - Other South America (%)
Place of birth for the foreign-born population - Canada (%)
Place of birth for the foreign-born population - Other Northern America (%)
Place of birth for the foreign-born population - Other (%)
Latest news about races in Belton, TX collected exclusively by city-data.com from local newspapers, TV, and radio stations
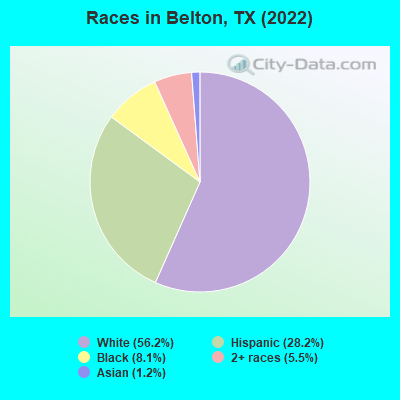
According to 2022 data, the most numerous races in Belton, TX are Hispanic (6,799 residents), White alone (13,556 residents), and Black alone (1,951 residents). 77.2% of Belton residents speak English at home. 8.5% of Belton, TX residents are foreign-born (5.7% born in Latin America, 1.6% born in Asia), which is 99.5% less than the foreign-born rate of 17.0% across the entire state of Texas.
Race distribution in Belton
2000 2022
10,933,313 52.4% White alone 6,669,666 32.0% Hispanic 2,364,255 11.3% Black alone 554,445 2.7% Asian alone 230,567 1.1% Two or more races 68,859 0.3% American Indian alone 19,958 0.10% Other race alone 10,757 0.05% Native Hawaiian and Other
12,070,642 40.2% Hispanic 11,683,430 38.9% White alone 3,508,706 11.7% Black alone 1,608,173 5.4% Asian alone 956,560 3.2% Two or more races 125,763 0.4% Other race alone 47,023 0.2% American Indian alone 29,275 0.10% Native Hawaiian and Other
Income and house value in Belton Median household income in 2022 $59,205 White non-Hispanic householders$94,104 Asian householders$41,006 Some other race householders$64,984 Two or more races householders$47,971 Hispanic or Latino race householdersMedian 2022 house value $306,714 White Non-Hispanic householders$234,272 Black or African American householders$258,843 American Indian or Alaska Native householders $137,682 Asian householders$196,144 Some other race householders$204,617 Two or more races householders$198,263 Hispanic or Latino householders
Median age by race in Belton
32.4 Median age for White residents33.1 32.3 30.7 Median age for Black or African American residents31.3 25.2 36.4 Median age for American Indian / Alaska Native residents-664,664,664.0 -898,550,723.7 19.9 Median age for Asian residents21.6 31.2 -635,318,703.6 Median age for Native Hawaiian / Pacific Islander residents-616,509,926.2 -1,002,096,435.1 24.6 Median age for Other race residents16.0 33.0 22.6 Median age for Two or more races residents25.9 16.9 32.7 Median age for White alone residents32.3 32.6 27.2 Median age for Hispanic or Latino residents29.2 26.5
Owner/renter occupied households by race in Belton
House owners and renters - White residents 2,909 52.5% Owner occupied2,632 47.5% Renter occupiedHouse owners and renters - Black or African American residents 335 53.0% Owner occupied297 47.0% Renter occupiedHouse owners and renters - Asian residents 61 57.5% Owner occupied45 42.5% Renter occupiedHouse owners and renters - Other race residents 494 64.6% Owner occupied270 35.4% Renter occupiedHouse owners and renters - Two or more races residents 273 31.5% Owner occupied595 68.5% Renter occupiedHouse owners and renters - White alone residents 2,771 53.5% Owner occupied2,412 46.5% Renter occupiedHouse owners and renters - Hispanic or Latino residents 882 46.0% Owner occupied1,037 54.0% Renter occupied
Language usage in Belton
English speakers - Total 77.2% of residents of Belton speak English at home.
19.1% of residents speak Spanish at home 2,764 63.6% Speak English very well1,582 36.4% Speak English less than very well4.0% of residents speak other language at home 732 80.8% Speak English very well174 19.2% Speak English less than very well
English speakers - Born in the United States 91.8% of residents of Belton speak English at home.
6.6% of residents speak Spanish at home 388 88.2% Speak English very well52 11.8% Speak English less than very well1.3% of residents speak other language at home 84 100.0% Speak English very well
English speakers - Native, born elsewhere 28.2% of residents of Belton speak English at home.
60.0% of residents speak Spanish at home 312 92.3% Speak English very well26 7.7% Speak English less than very well9.1% of residents speak other language at home 51 100.0% Speak English less than very well
English speakers - Foreign-born 8.7% of residents of Belton speak English at home.
60.2% of residents speak Spanish at home 440 31.8% Speak English very well943 68.2% Speak English less than very well30.8% of residents speak other language at home 588 82.9% Speak English very well121 17.1% Speak English less than very well
White (Caucasian) - Speak only English Native:
95.5% (12,692)Foreign-born:
24.0% (182)
White (Caucasian) - Speak another language Native:
5.2% (685)Foreign-born:
72.2% (549)
Black or African American - Speak only English Native:
86.6% (1,549)Foreign-born:
2.3% (7)
Black or African American - Speak another language Native:
12.1% (217)Foreign-born:
100.0% (296)
Asian - Speak only English Native:
95.2% (119)Foreign-born:
2.0% (3)
Asian - Speak another language Native:
11.0% (14)Foreign-born:
100.0% (137)
Other race - Speak another language Native:
55.8% (1,265)Foreign-born:
100.0% (501)
Two or more races - Speak only English Native:
68.5% (2,077)Foreign-born:
4.9% (20)
Two or more races - Speak another language Native:
31.5% (956)Foreign-born:
93.5% (385)
White alone - Speak only English Native:
97.5% (12,212)Foreign-born:
32.3% (187)
White alone - Speak another language Native:
2.4% (307)Foreign-born:
67.3% (390)
Hispanic or Latino - Speak only English Native:
46.4% (2,238)Foreign-born:
1.8% (23)
Hispanic or Latino - Speak another language Native:
53.4% (2,573)Foreign-born:
98.8% (1,291)
Foreign-born residents in Belton 2,054 residents are foreign born (5.7% Latin America , 1.6% Asia ).
This city:
8.5%Texas:
17.1%
Marital status for residents in Belton Marital status - White (Caucasian) population 15 years and over
Males 40.2% Never married46.3% Now married2.2% Separated3.3% Widowed8.0% DivorcedFemales 40.0% Never married33.9% Now married3.6% Separated7.3% Widowed15.1% DivorcedWomen who gave birth in the past 12 months Now married:
46.9% (36)Unmarried:
53.1% (41)
Women who did not give birth in the past 12 months Now married:
29.6% (1,315)Unmarried:
70.4% (3,131)
Marital status - Black or African American population 15 years and over
Males 60.1% Never married21.0% Now married11.7% Separated0.0% Widowed7.2% DivorcedFemales 57.6% Never married17.7% Now married0.0% Separated12.9% Widowed11.8% DivorcedWomen who gave birth in the past 12 months Now married:
0.0% (0)Unmarried:
100.0% (36)
Women who did not give birth in the past 12 months Now married:
15.5% (88)Unmarried:
84.5% (479)
Marital status - American Indian / Alaska Native population 15 years and over
Males 51.4% Never married0.0% Now married48.6% Separated0.0% Widowed0.0% DivorcedFemales 100.0% Never married0.0% Now married0.0% Separated0.0% Widowed0.0% DivorcedWomen who did not give birth in the past 12 months Now married:
0.0% (0)Unmarried:
100.0% (6)
Marital status - Asian population 15 years and over
Males 93.3% Never married6.7% Now married0.0% Separated0.0% Widowed0.0% DivorcedFemales 49.0% Never married51.0% Now married0.0% Separated0.0% Widowed0.0% DivorcedWomen who gave birth in the past 12 months Now married:
100.0% (7)Unmarried:
0.0% (0)
Women who did not give birth in the past 12 months Now married:
46.0% (76)Unmarried:
54.0% (89)
Marital status - Other race population 15 years and over
Males 33.2% Never married52.7% Now married5.5% Separated1.7% Widowed6.9% DivorcedFemales 36.7% Never married37.1% Now married1.6% Separated8.7% Widowed16.0% DivorcedWomen who did not give birth in the past 12 months Now married:
37.5% (351)Unmarried:
62.5% (585)
Marital status - Two or more races population 15 years and over
Males 57.9% Never married33.2% Now married2.3% Separated1.1% Widowed5.5% DivorcedFemales 39.6% Never married37.6% Now married8.2% Separated10.2% Widowed4.4% DivorcedWomen who did not give birth in the past 12 months Now married:
45.9% (322)Unmarried:
54.1% (379)
Marital status - White alone, not Hispanic / Latino population 15 years and over
Males 40.1% Never married46.8% Now married2.4% Separated3.2% Widowed7.5% DivorcedFemales 40.4% Never married32.9% Now married3.0% Separated8.0% Widowed15.7% DivorcedWomen who gave birth in the past 12 months Now married:
46.9% (39)Unmarried:
53.1% (44)
Women who did not give birth in the past 12 months Now married:
26.2% (1,017)Unmarried:
73.8% (2,871)
Marital status - Hispanic or Latino population 15 years and over
Males 39.1% Never married45.8% Now married3.8% Separated2.5% Widowed8.9% DivorcedFemales 37.3% Never married39.6% Now married5.1% Separated6.8% Widowed11.3% DivorcedWomen who did not give birth in the past 12 months Now married:
43.4% (863)Unmarried:
56.6% (1,125)
Ancestries in Belton
919 7.7% American878 7.3% German752 6.3% English644 5.4% Irish204 1.7% Jordanian186 1.6% European166 1.4% Italian138 1.2% Czech130 1.1% Scottish96 0.8% Welsh84 0.7% African69 0.6% French68 0.6% Dutch59 0.5% Basque56 0.5% Scotch-Irish52 0.4% British47 0.4% Hungarian45 0.4% Eastern European44 0.4% Serbian42 0.4% Northern European41 0.3% Danish27 0.2% Portuguese21 0.2% Russian18 0.2% Australian17 0.1% Swiss16 0.1% French Canadian13 0.1% Albanian10 0.08% Polish9 0.08% Sudanese7 0.06% Swedish4 0.03% Greek4 0.03% Jamaican
Geographical mobility in Belton Same house 1 year ago 10,428 71.7% White (Caucasian)1,432 67.1% Black or African American26 44.7% American Indian / Alaska Native91 32.6% Asian2,318 75.2% Other race2,267 58.8% Two or more races9,779 72.4% White alone, not Hispanic / Latino4,535 67.6% Hispanic or LatinoMoved within same county 1,549 10.7% White / Caucasian320 15.0% Black or African American21 37.6% American Indian / Alaska Native100 35.8% Asian619 20.1% Other race1,519 39.4% Two or more races1,313 9.7% White alone, not Hispanic / Latino1,790 26.7% Hispanic or LatinoMoved within same state 1,903 13.1% White / Caucasian253 11.9% Black or African American5 9.0% American Indian / Alaska Native62 22.1% Asian27 0.9% Other race107 2.8% Two or more races1,717 12.7% White alone, not Hispanic / Latino271 4.0% Hispanic or LatinoMoved from different state 551 3.8% White / Caucasian15 0.7% Black or African American50 17.8% Asian12 0.4% Other race129 3.4% Two or more races510 3.8% White alone, not Hispanic / Latino130 1.9% Hispanic or LatinoMoved from abroad 55 0.4% White1 0.1% Black or African American5 0.2% Other race79 2.1% Two or more races16 0.1% White alone, not Hispanic / Latino57 0.9% Hispanic or Latino
Children Nativity (place of birth) in Belton
Children under 6 years - Living with two parents Both parents native 545 95.5% Native25 4.5% Foreign-bornBoth parents foreign-born 230 60.1% Native152 39.9% Foreign-bornOne native, one foreign-born parent 33 100.0% NativeChildren under 6 years - Living with one parent Native parent 339 100.0% NativeForeign-born parent 12 100.0% NativeChildren 6 to 17 years - Living with two parents Both parents native 1,713 100.0% NativeBoth parents foreign-born 312 75.9% Native99 24.1% Foreign-bornOne native, one foreign-born parent 117 100.0% NativeChildren 6 to 17 years - Living with one parent Native parent 1,546 100.0% NativeForeign-born parent 125 58.3% Native89 41.7% Foreign-born
Grandparents responsible for own grandchildren in Belton
Grandparents (30 to 59 years) White / Caucasian 34 37.7% Responsible for grandchildren57 62.3% Not responsible for grandchildrenWhite alone, not Hispanic / Latino 12 27.4% Responsible for grandchildren32 72.6% Not responsible for grandchildrenHispanic or Latino 25 33.6% Responsible for grandchildren49 66.4% Not responsible for grandchildrenGrandparents (60 years and over) White / Caucasian 95 41.0% Responsible for grandchildren137 59.0% Not responsible for grandchildrenWhite alone, not Hispanic / Latino 105 39.0% Responsible for grandchildren165 61.0% Not responsible for grandchildrenHispanic or Latino 9 23.0% Responsible for grandchildren29 77.0% Not responsible for grandchildren