Races in Athens-Clarke County, Georgia (GA) Detailed Stats
Data:
Races - White alone (%)
Races - White alone (% change since 2000)
Races - Black alone (%)
Races - Black alone (% change since 2000)
Races - American Indian alone (%)
Races - American Indian alone (% change since 2000)
Races - Asian alone (%)
Races - Asian alone (% change since 2000)
Races - Hispanic (%)
Races - Hispanic (% change since 2000)
Races - Native Hawaiian and Other Pacific Islander alone (%)
Races - Native Hawaiian and Other Pacific Islander alone (% change since 2000)
Races - Two or more races(%)
Races - Two or more races(% change since 2000)
Races - Other race alone (%)
Races - Other race alone (% change since 2000)
Racial diversity
Place of birth - Born in state of residence (%)
Place of birth - Born in state of residence (%) - White
Place of birth - Born in state of residence (%) - Black or African American
Place of birth - Born in state of residence (%) - Asian
Place of birth - Born in state of residence (%) - Hispanic or Latino
Place of birth - Born in state of residence (%) - American Indian and Alaska Native
Place of birth - Born in state of residence (%) - Multirace
Place of birth - Born in state of residence (%) - Other Race
Place of birth - Born in other state (%)
Place of birth - Born in other state (%) - White
Place of birth - Born in other state (%) - Black or African American
Place of birth - Born in other state (%) - Asian
Place of birth - Born in other state (%) - Hispanic or Latino
Place of birth - Born in other state (%) - American Indian and Alaska Native
Place of birth - Born in other state (%) - Multirace
Place of birth - Born in other state (%) - Other Race
Place of birth - Native, outside of US (%)
Place of birth - Native, outside of US (%) - White
Place of birth - Native, outside of US (%) - Black or African American
Place of birth - Native, outside of US (%) - Asian
Place of birth - Native, outside of US (%) - Hispanic or Latino
Place of birth - Native, outside of US (%) - American Indian and Alaska Native
Place of birth - Native, outside of US (%) - Multirace
Place of birth - Native, outside of US (%) - Other Race
Place of birth - Foreign born (%)
Place of birth - Foreign born (%) - White
Place of birth - Foreign born (%) - Black or African American
Place of birth - Foreign born (%) - Asian
Place of birth - Foreign born (%) - Hispanic or Latino
Place of birth - Foreign born (%) - American Indian and Alaska Native
Place of birth - Foreign born (%) - Multirace
Place of birth - Foreign born (%) - Other Race
Residents speaking English at home (%)
Residents speaking English at home - Born in the United States (%)
Residents speaking English at home - Native, born elsewhere (%)
Residents speaking English at home - Foreign born (%)
Residents speaking Spanish at home (%)
Residents speaking Spanish at home - Born in the United States (%)
Residents speaking Spanish at home - Native, born elsewhere (%)
Residents speaking Spanish at home - Foreign born (%)
Residents speaking other language at home (%)
Residents speaking other language at home - Born in the United States (%)
Residents speaking other language at home - Native, born elsewhere (%)
Residents speaking other language at home - Foreign born (%)
Marital status - Never married (%)
Marital status - Now married (%)
Marital status - Separated (%)
Marital status - Widowed (%)
Marital status - Divorced (%)
Ancestries Reported - Arab (%)
Ancestries Reported - Czech (%)
Ancestries Reported - Danish (%)
Ancestries Reported - Dutch (%)
Ancestries Reported - English (%)
Ancestries Reported - French (%)
Ancestries Reported - French Canadian (%)
Ancestries Reported - German (%)
Ancestries Reported - Greek (%)
Ancestries Reported - Hungarian (%)
Ancestries Reported - Irish (%)
Ancestries Reported - Italian (%)
Ancestries Reported - Lithuanian (%)
Ancestries Reported - Norwegian (%)
Ancestries Reported - Polish (%)
Ancestries Reported - Portuguese (%)
Ancestries Reported - Russian (%)
Ancestries Reported - Scotch-Irish (%)
Ancestries Reported - Scottish (%)
Ancestries Reported - Slovak (%)
Ancestries Reported - Subsaharan African (%)
Ancestries Reported - Swedish (%)
Ancestries Reported - Swiss (%)
Ancestries Reported - Ukrainian (%)
Ancestries Reported - United States (%)
Ancestries Reported - Welsh (%)
Ancestries Reported - West Indian (%)
Ancestries Reported - Other (%)
Geographical mobility - Same house 1 year ago (%)
Geographical mobility - Same house 1 year ago (%) - White
Geographical mobility - Same house 1 year ago (%) - Black or African American
Geographical mobility - Same house 1 year ago (%) - Asian
Geographical mobility - Same house 1 year ago (%) - Hispanic or Latino
Geographical mobility - Same house 1 year ago (%) - American Indian and Alaska Native
Geographical mobility - Same house 1 year ago (%) - Multirace
Geographical mobility - Same house 1 year ago (%) - Other Race
Geographical mobility - Moved within same county (%)
Geographical mobility - Moved within same county (%) - White
Geographical mobility - Moved within same county (%) - Black or African American
Geographical mobility - Moved within same county (%) - Asian
Geographical mobility - Moved within same county (%) - Hispanic or Latino
Geographical mobility - Moved within same county (%) - American Indian and Alaska Native
Geographical mobility - Moved within same county (%) - Multirace
Geographical mobility - Moved within same county (%) - Other Race
Geographical mobility - Moved from different county within same state (%)
Geographical mobility - Moved from different county within same state (%) - White
Geographical mobility - Moved from different county within same state (%) - Black or African American
Geographical mobility - Moved from different county within same state (%) - Asian
Geographical mobility - Moved from different county within same state (%) - Hispanic or Latino
Geographical mobility - Moved from different county within same state (%) - American Indian and Alaska Native
Geographical mobility - Moved from different county within same state (%) - Multirace
Geographical mobility - Moved from different county within same state (%) - Other Race
Geographical mobility - Moved from different state (%)
Geographical mobility - Moved from different state (%) - White
Geographical mobility - Moved from different state (%) - Black or African American
Geographical mobility - Moved from different state (%) - Asian
Geographical mobility - Moved from different state (%) - Hispanic or Latino
Geographical mobility - Moved from different state (%) - American Indian and Alaska Native
Geographical mobility - Moved from different state (%) - Multirace
Geographical mobility - Moved from different state (%) - Other Race
Geographical mobility - Moved from abroad (%)
Geographical mobility - Moved from abroad (%) - White
Geographical mobility - Moved from abroad (%) - Black or African American
Geographical mobility - Moved from abroad (%) - Asian
Geographical mobility - Moved from abroad (%) - Hispanic or Latino
Geographical mobility - Moved from abroad (%) - American Indian and Alaska Native
Geographical mobility - Moved from abroad (%) - Multirace
Geographical mobility - Moved from abroad (%) - Other Race
Place of birth for the foreign-born population - Ireland (%)
Place of birth for the foreign-born population - Denmark (%)
Place of birth for the foreign-born population - Norway (%)
Place of birth for the foreign-born population - Sweden (%)
Place of birth for the foreign-born population - United Kingdom (%)
Place of birth for the foreign-born population - England (%)
Place of birth for the foreign-born population - Scotland (%)
Place of birth for the foreign-born population - Other Northern Europe (%)
Place of birth for the foreign-born population - Austria (%)
Place of birth for the foreign-born population - Belgium (%)
Place of birth for the foreign-born population - France (%)
Place of birth for the foreign-born population - Germany (%)
Place of birth for the foreign-born population - Netherlands (%)
Place of birth for the foreign-born population - Switzerland (%)
Place of birth for the foreign-born population - Other Western Europe (%)
Place of birth for the foreign-born population - Greece (%)
Place of birth for the foreign-born population - Italy (%)
Place of birth for the foreign-born population - Portugal (%)
Place of birth for the foreign-born population - Spain (%)
Place of birth for the foreign-born population - Other Southern Europe (%)
Place of birth for the foreign-born population - Albania (%)
Place of birth for the foreign-born population - Belarus (%)
Place of birth for the foreign-born population - Bosnia and Herzegovina (%)
Place of birth for the foreign-born population - Bulgaria (%)
Place of birth for the foreign-born population - Croatia (%)
Place of birth for the foreign-born population - Czechoslovakia (%)
Place of birth for the foreign-born population - Hungary (%)
Place of birth for the foreign-born population - Latvia (%)
Place of birth for the foreign-born population - Lithuania (%)
Place of birth for the foreign-born population - North Macedonia (Macedonia) (%)
Place of birth for the foreign-born population - Moldova (%)
Place of birth for the foreign-born population - Poland (%)
Place of birth for the foreign-born population - Romania (%)
Place of birth for the foreign-born population - Russia (%)
Place of birth for the foreign-born population - Serbia (%)
Place of birth for the foreign-born population - Ukraine (%)
Place of birth for the foreign-born population - Other Eastern Europe (%)
Place of birth for the foreign-born population - China (%)
Place of birth for the foreign-born population - Hong Kong (%)
Place of birth for the foreign-born population - Taiwan (%)
Place of birth for the foreign-born population - Japan (%)
Place of birth for the foreign-born population - Korea (%)
Place of birth for the foreign-born population - Other Eastern Asia (%)
Place of birth for the foreign-born population - Afghanistan (%)
Place of birth for the foreign-born population - Bangladesh (%)
Place of birth for the foreign-born population - India (%)
Place of birth for the foreign-born population - Iran (%)
Place of birth for the foreign-born population - Kazakhstan (%)
Place of birth for the foreign-born population - Nepal (%)
Place of birth for the foreign-born population - Pakistan (%)
Place of birth for the foreign-born population - Sri Lanka (%)
Place of birth for the foreign-born population - Uzbekistan (%)
Place of birth for the foreign-born population - Other South Central Asia (%)
Place of birth for the foreign-born population - Burma (%)
Place of birth for the foreign-born population - Cambodia (%)
Place of birth for the foreign-born population - Indonesia (%)
Place of birth for the foreign-born population - Laos (%)
Place of birth for the foreign-born population - Malaysia (%)
Place of birth for the foreign-born population - Philippines (%)
Place of birth for the foreign-born population - Singapore (%)
Place of birth for the foreign-born population - Thailand (%)
Place of birth for the foreign-born population - Vietnam (%)
Place of birth for the foreign-born population - Other South Eastern Asia (%)
Place of birth for the foreign-born population - Armenia (%)
Place of birth for the foreign-born population - Iraq (%)
Place of birth for the foreign-born population - Israel (%)
Place of birth for the foreign-born population - Jordan (%)
Place of birth for the foreign-born population - Kuwait (%)
Place of birth for the foreign-born population - Lebanon (%)
Place of birth for the foreign-born population - Saudi Arabia (%)
Place of birth for the foreign-born population - Syria (%)
Place of birth for the foreign-born population - Turkey (%)
Place of birth for the foreign-born population - Yemen (%)
Place of birth for the foreign-born population - Other Western Asia (%)
Place of birth for the foreign-born population - Eritrea (%)
Place of birth for the foreign-born population - Ethiopia (%)
Place of birth for the foreign-born population - Kenya (%)
Place of birth for the foreign-born population - Somalia (%)
Place of birth for the foreign-born population - Uganda (%)
Place of birth for the foreign-born population - Zimbabwe (%)
Place of birth for the foreign-born population - Other Eastern Africa (%)
Place of birth for the foreign-born population - Cameroon (%)
Place of birth for the foreign-born population - Congo (%)
Place of birth for the foreign-born population - Democratic Republic of Congo (Zaire) (%)
Place of birth for the foreign-born population - Other Middle Africa (%)
Place of birth for the foreign-born population - Egypt (%)
Place of birth for the foreign-born population - Morocco (%)
Place of birth for the foreign-born population - Sudan (%)
Place of birth for the foreign-born population - Other Northern Africa (%)
Place of birth for the foreign-born population - South Africa (%)
Place of birth for the foreign-born population - Other Southern Africa (%)
Place of birth for the foreign-born population - Cabo Verde (%)
Place of birth for the foreign-born population - Ghana (%)
Place of birth for the foreign-born population - Liberia (%)
Place of birth for the foreign-born population - Nigeria (%)
Place of birth for the foreign-born population - Senegal (%)
Place of birth for the foreign-born population - Sierra Leone (%)
Place of birth for the foreign-born population - Other Western Africa (%)
Place of birth for the foreign-born population - Australia (%)
Place of birth for the foreign-born population - New Zealand (%)
Place of birth for the foreign-born population - Fiji (%)
Place of birth for the foreign-born population - Micronesia (%)
Place of birth for the foreign-born population - Bahamas (%)
Place of birth for the foreign-born population - Barbados (%)
Place of birth for the foreign-born population - Cuba (%)
Place of birth for the foreign-born population - Dominica (%)
Place of birth for the foreign-born population - Dominican Republic (%)
Place of birth for the foreign-born population - Grenada (%)
Place of birth for the foreign-born population - Haiti (%)
Place of birth for the foreign-born population - Jamaica (%)
Place of birth for the foreign-born population - St. Vincent and the Grenadines (%)
Place of birth for the foreign-born population - Trinidad and Tobago (%)
Place of birth for the foreign-born population - West Indies (%)
Place of birth for the foreign-born population - Other Caribbean (%)
Place of birth for the foreign-born population - Belize (%)
Place of birth for the foreign-born population - Costa Rica (%)
Place of birth for the foreign-born population - El Salvador (%)
Place of birth for the foreign-born population - Guatemala (%)
Place of birth for the foreign-born population - Honduras (%)
Place of birth for the foreign-born population - Mexico (%)
Place of birth for the foreign-born population - Nicaragua (%)
Place of birth for the foreign-born population - Panama (%)
Place of birth for the foreign-born population - Other Central America (%)
Place of birth for the foreign-born population - Argentina (%)
Place of birth for the foreign-born population - Bolivia (%)
Place of birth for the foreign-born population - Brazil (%)
Place of birth for the foreign-born population - Chile (%)
Place of birth for the foreign-born population - Colombia (%)
Place of birth for the foreign-born population - Ecuador (%)
Place of birth for the foreign-born population - Guyana (%)
Place of birth for the foreign-born population - Peru (%)
Place of birth for the foreign-born population - Uruguay (%)
Place of birth for the foreign-born population - Venezuela (%)
Place of birth for the foreign-born population - Other South America (%)
Place of birth for the foreign-born population - Canada (%)
Place of birth for the foreign-born population - Other Northern America (%)
Place of birth for the foreign-born population - Other (%)
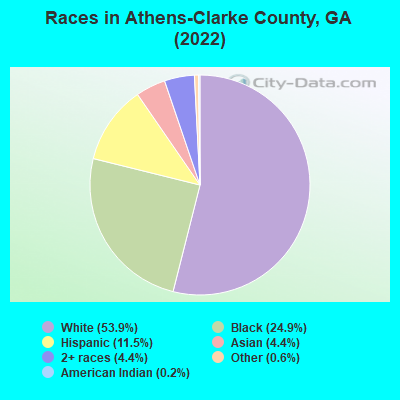
According to 2022 data, the most numerous races in Athens-Clarke County, GA are White alone (68,944 residents), Black alone (31,888 residents), and Hispanic (14,751 residents). 84.7% of Athens-Clarke County residents speak English at home. 10.0% of Athens-Clarke County, GA residents are foreign-born (4.6% born in Latin America, 3.0% born in Asia), which is about the same as the foreign-born rate of 10.0% across the entire state of Georgia.
Race distribution in Athens-Clarke County
2000 2022
61,950 61.8% White alone 27,284 27.2% Black alone 6,402 6.4% Hispanic 3,147 3.1% Asian alone 1,115 1.1% Two or more races 167 0.2% Other race alone 160 0.2% American Indian alone 41 0.04% Native Hawaiian and Other
68,944 53.9% White alone 31,888 24.9% Black alone 14,751 11.5% Hispanic 5,685 4.4% Asian alone 5,587 4.4% Two or more races 812 0.6% Other race alone 314 0.2% American Indian alone
2000 2022
5,128,661 62.6% White alone 2,331,465 28.5% Black alone 435,227 5.3% Hispanic 171,513 2.1% Asian alone 87,364 1.1% Two or more races 17,670 0.2% American Indian alone 11,275 0.1% Other race alone 3,278 0.04% Native Hawaiian and Other
5,415,657 49.6% White alone 3,349,240 30.7% Black alone 1,132,604 10.4% Hispanic 479,156 4.4% Asian alone 462,923 4.2% Two or more races 54,416 0.5% Other race alone 11,923 0.1% American Indian alone 6,957 0.06% Native Hawaiian and Other
Income and house value in Athens-Clarke County Median household income in 2022 $54,973 White non-Hispanic householders$38,255 Black householders$33,212 Asian householders$69,457 Some other race householders$58,710 Two or more races householders$60,203 Hispanic or Latino race householdersMedian 2022 house value $370,198 White Non-Hispanic householders$230,772 Black or African American householders$176,685 American Indian or Alaska Native householders $407,458 Asian householders$331,435 Some other race householders$234,078 Two or more races householders$364,789 Hispanic or Latino householders
Median age by race in Athens-Clarke County
28.3 Median age for White residents27.4 29.2 31.6 Median age for Black or African American residents31.2 33.0 21.1 Median age for American Indian / Alaska Native residents21.4 14.8 22.8 Median age for Asian residents24.0 22.5 -666,666,666.0 Median age for Native Hawaiian / Pacific Islander residents-666,666,666.0 -666,666,666.0 20.8 Median age for Other race residents25.3 20.7 26.3 Median age for Two or more races residents34.2 20.2 28.9 Median age for White alone residents28.4 29.4 23.0 Median age for Hispanic or Latino residents25.4 22.8
Owner/renter occupied households by race in Athens-Clarke County
House owners and renters - White residents 13,600 42.6% Owner occupied18,301 57.4% Renter occupiedHouse owners and renters - Black or African American residents 4,263 31.5% Owner occupied9,251 68.5% Renter occupiedHouse owners and renters - American Indian / Alaska Native residents 74 43.9% Owner occupied95 56.1% Renter occupiedHouse owners and renters - Asian residents 436 19.8% Owner occupied1,765 80.2% Renter occupiedHouse owners and renters - Native Hawaiian / Pacific Islander residents 9 100.0% Renter occupiedHouse owners and renters - Other race residents 843 61.4% Owner occupied529 38.6% Renter occupiedHouse owners and renters - Two or more races residents 1,426 39.4% Owner occupied2,193 60.6% Renter occupiedHouse owners and renters - White alone residents 13,600 43.8% Owner occupied17,461 56.2% Renter occupiedHouse owners and renters - Hispanic or Latino residents 1,562 34.2% Owner occupied3,003 65.8% Renter occupied
Language usage in Athens-Clarke County
English speakers - Total 84.7% of residents of Athens-Clarke County speak English at home.
8.3% of residents speak Spanish at home 6,011 58.8% Speak English very well4,205 41.2% Speak English less than very well6.9% of residents speak other language at home 6,678 78.9% Speak English very well1,786 21.1% Speak English less than very well
English speakers - Born in the United States 92.0% of residents of Athens-Clarke County speak English at home.
3.3% of residents speak Spanish at home 1,085 84.0% Speak English very well207 16.0% Speak English less than very well4.7% of residents speak other language at home 1,638 87.5% Speak English very well234 12.5% Speak English less than very well
English speakers - Native, born elsewhere 54.5% of residents of Athens-Clarke County speak English at home.
30.1% of residents speak Spanish at home 156 100.0% Speak English very well15.4% of residents speak other language at home 80 100.0% Speak English very well
English speakers - Foreign-born 21.8% of residents of Athens-Clarke County speak English at home.
40.4% of residents speak Spanish at home 1,109 22.8% Speak English very well3,757 77.2% Speak English less than very well37.8% of residents speak other language at home 3,256 71.6% Speak English very well1,291 28.4% Speak English less than very well
White (Caucasian) - Speak only English Native:
95.6% (64,716)Foreign-born:
29.3% (505)
White (Caucasian) - Speak another language Native:
4.4% (2,999)Foreign-born:
70.7% (1,217)
Black or African American - Speak only English Native:
97.6% (29,573)Foreign-born:
48.4% (717)
Black or African American - Speak another language Native:
2.4% (729)Foreign-born:
51.5% (764)
American Indian / Alaska Native - Speak only English Native:
46.5% (185)Foreign-born:
0.8% (3)
American Indian / Alaska Native - Speak another language Native:
54.3% (217)Foreign-born:
99.5% (439)
Asian - Speak only English Native:
15.8% (289)Foreign-born:
17.8% (697)
Asian - Speak another language Native:
84.2% (1,535)Foreign-born:
82.2% (3,223)
Other race - Speak only English Native:
36.4% (919)Foreign-born:
2.5% (55)
Other race - Speak another language Native:
63.2% (1,594)Foreign-born:
96.9% (2,145)
Two or more races - Speak only English Native:
69.6% (6,136)Foreign-born:
14.2% (533)
Two or more races - Speak another language Native:
30.4% (2,677)Foreign-born:
85.8% (3,213)
White alone - Speak only English Native:
96.4% (63,461)Foreign-born:
41.7% (505)
White alone - Speak another language Native:
3.6% (2,350)Foreign-born:
58.3% (705)
Hispanic or Latino - Speak only English Native:
36.3% (2,948)Foreign-born:
11.7% (643)
Hispanic or Latino - Speak another language Native:
63.7% (5,175)Foreign-born:
88.3% (4,866)
Foreign-born residents in Athens-Clarke County 12,777 residents are foreign born (4.6% Latin America , 3.0% Asia ).
This city:
10.0%Georgia:
10.4%
Marital status for residents in Athens-Clarke County Marital status - White (Caucasian) population 15 years and over
Males 57.1% Never married31.9% Now married0.7% Separated2.4% Widowed7.9% DivorcedFemales 52.0% Never married32.3% Now married1.1% Separated6.8% Widowed7.9% DivorcedWomen who gave birth in the past 12 months Now married:
43.5% (54)Unmarried:
56.5% (70)
Women who did not give birth in the past 12 months Now married:
26.0% (6,090)Unmarried:
74.0% (17,329)
Marital status - Black or African American population 15 years and over
Males 69.7% Never married20.5% Now married0.0% Separated1.9% Widowed7.8% DivorcedFemales 53.6% Never married18.0% Now married4.6% Separated5.9% Widowed17.8% DivorcedWomen who gave birth in the past 12 months Now married:
40.4% (192)Unmarried:
59.6% (283)
Women who did not give birth in the past 12 months Now married:
17.2% (1,659)Unmarried:
82.8% (8,011)
Marital status - American Indian / Alaska Native population 15 years and over
Males 72.2% Never married27.4% Now married0.0% Separated0.0% Widowed0.3% DivorcedFemales 68.5% Never married31.5% Now married0.0% Separated0.0% Widowed0.0% DivorcedWomen who gave birth in the past 12 months Now married:
100.0% (74)Unmarried:
0.0% (0)
Women who did not give birth in the past 12 months Now married:
0.0% (0)Unmarried:
100.0% (162)
Marital status - Asian population 15 years and over
Males 65.6% Never married30.1% Now married1.5% Separated0.0% Widowed2.8% DivorcedFemales 55.3% Never married39.3% Now married0.4% Separated3.6% Widowed1.4% DivorcedWomen who gave birth in the past 12 months Now married:
100.0% (11)Unmarried:
0.0% (0)
Women who did not give birth in the past 12 months Now married:
29.9% (618)Unmarried:
70.1% (1,446)
Marital status - Native Hawaiian / Pacific Islander population 15 years and over
Males 0.0% Never married100.0% Now married0.0% Separated0.0% Widowed0.0% DivorcedFemales 100.0% Never married0.0% Now married0.0% Separated0.0% Widowed0.0% DivorcedWomen who did not give birth in the past 12 months Now married:
0.0% (0)Unmarried:
100.0% (9)
Marital status - Other race population 15 years and over
Males 46.6% Never married35.7% Now married5.1% Separated0.0% Widowed12.7% DivorcedFemales 31.5% Never married40.2% Now married3.6% Separated7.1% Widowed17.6% DivorcedWomen who gave birth in the past 12 months Now married:
46.5% (26)Unmarried:
53.5% (30)
Women who did not give birth in the past 12 months Now married:
42.1% (615)Unmarried:
57.9% (844)
Marital status - Two or more races population 15 years and over
Males 51.7% Never married39.4% Now married3.7% Separated0.0% Widowed5.2% DivorcedFemales 58.7% Never married29.5% Now married1.8% Separated5.7% Widowed4.3% DivorcedWomen who gave birth in the past 12 months Now married:
33.3% (19)Unmarried:
66.7% (38)
Women who did not give birth in the past 12 months Now married:
31.1% (1,320)Unmarried:
68.9% (2,928)
Marital status - White alone, not Hispanic / Latino population 15 years and over
Males 56.2% Never married33.0% Now married0.4% Separated2.5% Widowed7.9% DivorcedFemales 52.1% Never married31.8% Now married0.9% Separated7.0% Widowed8.1% DivorcedWomen who gave birth in the past 12 months Now married:
43.5% (54)Unmarried:
56.5% (70)
Women who did not give birth in the past 12 months Now married:
24.9% (5,615)Unmarried:
75.1% (16,935)
Marital status - Hispanic or Latino population 15 years and over
Males 50.9% Never married36.6% Now married6.2% Separated0.0% Widowed6.3% DivorcedFemales 46.7% Never married36.6% Now married2.9% Separated4.9% Widowed9.0% DivorcedWomen who gave birth in the past 12 months Now married:
100.0% (113)Unmarried:
0.0% (0)
Women who did not give birth in the past 12 months Now married:
31.3% (1,393)Unmarried:
68.7% (3,055)
Ancestries in Athens-Clarke County
7,833 11.7% English3,549 5.3% Irish3,326 5.0% German2,972 4.4% American2,217 3.3% European1,526 2.3% Italian1,399 2.1% Scottish706 1.1% Scotch-Irish693 1.0% African686 1.0% French517 0.8% Polish398 0.6% British312 0.5% Nigerian310 0.5% Dutch293 0.4% Egyptian220 0.3% Welsh211 0.3% Russian209 0.3% Canadian205 0.3% Swedish195 0.3% Kenyan190 0.3% Lebanese185 0.3% Jamaican181 0.3% Norwegian150 0.2% Scandinavian146 0.2% Haitian145 0.2% Czech134 0.2% Ghanaian119 0.2% Israeli112 0.2% Turkish107 0.2% Greek104 0.2% Hungarian100 0.1% Iranian96 0.1% Northern European95 0.1% Latvian78 0.1% Brazilian63 0.09% Belgian61 0.09% Eastern European49 0.07% French Canadian48 0.07% Portuguese42 0.06% Cajun41 0.06% Czechoslovakian36 0.05% Bulgarian30 0.04% Swiss28 0.04% Ethiopian27 0.04% Liberian23 0.03% Sudanese21 0.03% Lithuanian20 0.03% Slavic19 0.03% Sierra Leonean16 0.02% Finnish16 0.02% Austrian14 0.02% Romanian14 0.02% Palestinian13 0.02% Trinidadian and Tobagonian10 0.01% South African10 0.01% Zimbabwean10 0.01% Jordanian9 0.01% Danish9 0.01% Ukrainian8 0.01% Pennsylvania German6 0.01% Carpatho Rusyn6 0.01% Slovak
Geographical mobility in Athens-Clarke County Same house 1 year ago 46,479 65.1% White (Caucasian)27,121 85.6% Black or African American1,195 95.4% American Indian / Alaska Native2,957 51.5% Asian45 100.0% Native Hawaiian / Pacific Islander4,095 82.1% Other race10,140 76.1% Two or more races44,751 65.0% White alone, not Hispanic / Latino11,441 79.6% Hispanic or LatinoMoved within same county 8,886 12.4% White / Caucasian2,286 7.2% Black or African American45 3.6% American Indian / Alaska Native426 7.4% Asian586 11.7% Other race1,076 8.1% Two or more races8,484 12.3% White alone, not Hispanic / Latino1,302 9.1% Hispanic or LatinoMoved within same state 12,536 17.6% White / Caucasian1,744 5.5% Black or African American13 1.0% American Indian / Alaska Native2,084 36.3% Asian141 2.8% Other race1,367 10.3% Two or more races12,160 17.7% White alone, not Hispanic / Latino941 6.5% Hispanic or LatinoMoved from different state 3,076 4.3% White / Caucasian532 1.7% Black or African American211 3.7% Asian80 1.6% Other race30 0.2% Two or more races3,025 4.4% White alone, not Hispanic / Latino459 3.2% Hispanic or LatinoMoved from abroad 421 0.6% White66 1.1% Asian80 1.6% Other race720 5.4% Two or more races421 0.6% White alone, not Hispanic / Latino253 1.8% Hispanic or Latino
Children Nativity (place of birth) in Athens-Clarke County
Children under 6 years - Living with two parents Both parents native 2,903 98.9% Native34 1.1% Foreign-bornBoth parents foreign-born 256 94.0% Native17 6.0% Foreign-bornOne native, one foreign-born parent 557 100.0% NativeChildren under 6 years - Living with one parent Native parent 2,683 100.0% NativeForeign-born parent 217 100.0% NativeChildren 6 to 17 years - Living with two parents Both parents native 4,290 100.0% NativeBoth parents foreign-born 1,114 73.5% Native401 26.5% Foreign-bornOne native, one foreign-born parent 892 95.4% Native43 4.6% Foreign-bornChildren 6 to 17 years - Living with one parent Native parent 5,442 100.0% NativeForeign-born parent 1,404 52.3% Native1,283 47.7% Foreign-born
Place of birth for residents in Athens-Clarke County 6,386 Americas6,078 Latin America4,505 Central America4,013 Asia1,619 Eastern Asia1,218 Europe1,181 South Central Asia1,148 Africa1,142 South America954 China871 South Eastern Asia502 Western Africa467 Northern Europe429 Caribbean362 Western Europe338 Eastern Africa328 Western Asia307 Northern America259 Eastern Europe243 Northern Africa129 Southern Europe64 Southern Africa10 Oceania10 Australia and New Zealand Subregion3,121 Mexico897 China828 India654 El Salvador606 Korea448 Honduras388 Philippines351 Colombia307 Canada290 Peru262 Nigeria246 Burma (Myanmar)223 Guatemala212 Kenya211 England185 Venezuela179 United Kingdom167 Germany141 France133 Brazil131 Turkey123 Argentina122 Israel122 Egypt121 Sudan99 Iran97 Haiti95 Dominica93 Dominican Republic93 Jamaica89 Zimbabwe87 Pakistan75 Vietnam67 Thailand65 Togo64 South Africa62 Bangladesh61 Lebanon60 Spain59 Italy58 Japan58 Poland50 Panama44 Russia41 Ghana39 Bulgaria39 Ireland38 Liberia34 Ethiopia34 Hong Kong31 Sierra Leone30 Netherlands29 Malaysia29 Kazakhstan27 Sri Lanka27 Cuba27 Laos23 Singapore22 Taiwan21 Trinidad and Tobago21 Ukraine21 Ecuador20 Czechoslovakia19 Austria15 Norway15 Romania15 Latvia14 Chile13 Cambodia13 Jordan13 Uruguay10 Australia9 Portugal8 Costa Rica8 Bolivia6 Nepal2 Belgium1 Tanzania
Grandparents responsible for own grandchildren in Athens-Clarke County
Grandparents (30 to 59 years) White / Caucasian 35 67.2% Responsible for grandchildren17 32.8% Not responsible for grandchildrenBlack or African American 111 30.8% Responsible for grandchildren250 69.2% Not responsible for grandchildrenAsian 17 100.0% Not responsible for grandchildrenOther race 46 100.0% Not responsible for grandchildrenTwo or more races 4 5.4% Responsible for grandchildren65 94.6% Not responsible for grandchildrenWhite alone, not Hispanic / Latino 36 66.4% Responsible for grandchildren18 33.6% Not responsible for grandchildrenHispanic or Latino 78 100.0% Not responsible for grandchildrenGrandparents (60 years and over) White / Caucasian 50 17.8% Responsible for grandchildren230 82.2% Not responsible for grandchildrenBlack or African American 56 14.6% Responsible for grandchildren324 85.4% Not responsible for grandchildrenAsian 16 100.0% Not responsible for grandchildrenOther race 66 100.0% Not responsible for grandchildrenTwo or more races 38 100.0% Not responsible for grandchildrenWhite alone, not Hispanic / Latino 50 17.1% Responsible for grandchildren242 82.9% Not responsible for grandchildrenHispanic or Latino 124 100.0% Not responsible for grandchildren