Races in Ashland, Ohio (OH) Detailed Stats
Latest news about races in Ashland, OH collected exclusively by city-data.com from local newspapers, TV, and radio stations
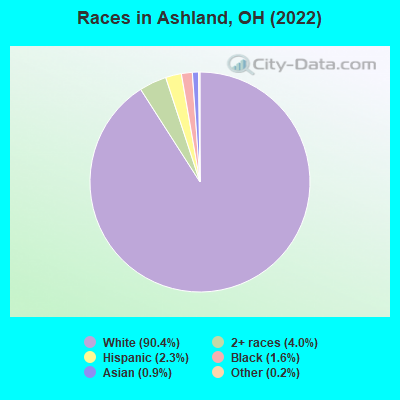
According to 2022 data, the most numerous races in Ashland, OH are White alone (17,401 residents), Black alone (317 residents), and Two or more races (771 residents). 97.3% of Ashland residents speak English at home. 1.8% of Ashland, OH residents are foreign-born , which is 123.7% less than the foreign-born rate of 4.0% across the entire state of Ohio.
Race distribution in Ashland
2000 2022
9,538,111 84.0% White alone 1,290,662 11.4% Black alone 217,123 1.9% Hispanic 137,770 1.2% Two or more races 131,670 1.2% Asian alone 21,985 0.2% American Indian alone 13,483 0.1% Other race alone 2,336 0.02% Native Hawaiian and Other
8,948,793 76.1% White alone 1,401,403 11.9% Black alone 529,291 4.5% Two or more races 517,232 4.4% Hispanic 293,387 2.5% Asian alone 52,805 0.4% Other race alone 9,785 0.08% American Indian alone 3,362 0.03% Native Hawaiian and Other
Income and house value in Ashland Median household income in 2022 $56,545 White non-Hispanic householders$33,847 Two or more races householders$33,588 Hispanic or Latino race householdersMedian 2022 house value $154,010 White Non-Hispanic householders$136,320 Black or African American householders over $1,000,000 Asian householders$195,114 Two or more races householders
Median age by race in Ashland
40.4 Median age for White residents37.7 41.9 51.1 Median age for Black or African American residents51.5 62.8 82.6 Median age for American Indian / Alaska Native residents23.0 -658,163,264.6 38.9 Median age for Asian residents30.9 39.2 -800,387,596.1 Median age for Native Hawaiian / Pacific Islander residents-750,242,953.6 -805,394,989.6 15.9 Median age for Other race residents16.4 10.6 19.2 Median age for Two or more races residents23.0 19.2 40.4 Median age for White alone residents37.9 42.1 23.9 Median age for Hispanic or Latino residents23.5 26.8
Owner/renter occupied households by race in Ashland
House owners and renters - White residents 4,762 64.9% Owner occupied2,579 35.1% Renter occupiedHouse owners and renters - Black or African American residents 161 90.9% Owner occupied16 9.1% Renter occupiedHouse owners and renters - American Indian / Alaska Native residents 77 100.0% Renter occupiedHouse owners and renters - Asian residents 69 55.0% Owner occupied56 45.0% Renter occupiedHouse owners and renters - Other race residents 12 31.3% Owner occupied26 68.7% Renter occupiedHouse owners and renters - Two or more races residents 153 46.9% Owner occupied174 53.1% Renter occupiedHouse owners and renters - White alone residents 4,777 64.6% Owner occupied2,615 35.4% Renter occupiedHouse owners and renters - Hispanic or Latino residents 107 58.6% Owner occupied76 41.4% Renter occupied
Language usage in Ashland
English speakers - Total 97.3% of residents of Ashland speak English at home.
1.0% of residents speak Spanish at home 164 93.2% Speak English very well12 6.8% Speak English less than very well1.5% of residents speak other language at home 188 67.9% Speak English very well89 32.1% Speak English less than very well
English speakers - Born in the United States 96.8% of residents of Ashland speak English at home.
1.0% of residents speak Spanish at home 28 100.0% Speak English very well2.1% of residents speak other language at home 53 91.4% Speak English very well5 8.6% Speak English less than very well
English speakers - Native, born elsewhere 92.1% of residents of Ashland speak English at home.
7.9% of residents speak Spanish at home 3 100.0% Speak English very well
English speakers - Foreign-born 32.8% of residents of Ashland speak English at home.
28.8% of residents speak Spanish at home 87 87.9% Speak English very well12 12.1% Speak English less than very well36.6% of residents speak other language at home 44 34.9% Speak English very well82 65.1% Speak English less than very well
White (Caucasian) - Speak only English Native:
99.4% (16,468)Foreign-born:
65.2% (41)
White (Caucasian) - Speak another language Native:
0.8% (126)Foreign-born:
38.7% (24)
Asian - Speak only English Native:
82.4% (52)Foreign-born:
19.8% (23)
Asian - Speak another language Native:
19.3% (12)Foreign-born:
79.7% (93)
Two or more races - Speak only English Native:
90.2% (797)Foreign-born:
43.9% (54)
Two or more races - Speak another language Native:
9.7% (86)Foreign-born:
50.0% (62)
White alone - Speak only English Native:
99.1% (16,391)Foreign-born:
60.4% (42)
White alone - Speak another language Native:
0.9% (141)Foreign-born:
40.2% (28)
Hispanic or Latino - Speak only English Native:
84.7% (248)Foreign-born:
30.1% (46)
Hispanic or Latino - Speak another language Native:
14.1% (41)Foreign-born:
68.7% (104)
Foreign-born residents in Ashland 344 residents are foreign born
Marital status for residents in Ashland Marital status - White (Caucasian) population 15 years and over
Males 34.4% Never married49.6% Now married2.2% Separated2.6% Widowed11.3% DivorcedFemales 30.3% Never married43.8% Now married1.3% Separated12.0% Widowed12.6% DivorcedWomen who gave birth in the past 12 months Now married:
50.5% (96)Unmarried:
49.5% (94)
Women who did not give birth in the past 12 months Now married:
39.7% (1,563)Unmarried:
60.3% (2,371)
Marital status - Black or African American population 15 years and over
Males 90.7% Never married8.3% Now married0.0% Separated0.0% Widowed1.0% DivorcedFemales 100.0% Never married0.0% Now married0.0% Separated0.0% Widowed0.0% DivorcedWomen who did not give birth in the past 12 months Now married:
0.0% (0)Unmarried:
100.0% (5)
Marital status - American Indian / Alaska Native population 15 years and over
Males 100.0% Never married0.0% Now married0.0% Separated0.0% Widowed0.0% DivorcedFemales 8.3% Never married0.0% Now married0.0% Separated91.7% Widowed0.0% DivorcedWomen who did not give birth in the past 12 months Now married:
0.0% (0)Unmarried:
100.0% (6)
Marital status - Asian population 15 years and over
Males 59.5% Never married40.5% Now married0.0% Separated0.0% Widowed0.0% DivorcedFemales 16.3% Never married51.9% Now married0.0% Separated0.0% Widowed31.9% DivorcedWomen who did not give birth in the past 12 months Now married:
47.7% (52)Unmarried:
52.3% (57)
Marital status - Other race population 15 years and over
Males 80.4% Never married0.0% Now married0.0% Separated0.0% Widowed19.6% DivorcedFemales 33.3% Never married0.0% Now married66.7% Separated0.0% Widowed0.0% DivorcedWomen who did not give birth in the past 12 months Now married:
0.0% (0)Unmarried:
100.0% (3)
Marital status - Two or more races population 15 years and over
Males 66.7% Never married24.1% Now married0.0% Separated0.0% Widowed9.2% DivorcedFemales 47.1% Never married14.5% Now married5.0% Separated0.0% Widowed33.5% DivorcedWomen who gave birth in the past 12 months Now married:
0.0% (0)Unmarried:
100.0% (60)
Women who did not give birth in the past 12 months Now married:
42.2% (57)Unmarried:
57.8% (79)
Marital status - White alone, not Hispanic / Latino population 15 years and over
Males 34.4% Never married49.5% Now married2.2% Separated2.6% Widowed11.3% DivorcedFemales 29.6% Never married44.2% Now married1.3% Separated12.1% Widowed12.7% DivorcedWomen who gave birth in the past 12 months Now married:
50.5% (97)Unmarried:
49.5% (95)
Women who did not give birth in the past 12 months Now married:
40.5% (1,579)Unmarried:
59.5% (2,324)
Marital status - Hispanic or Latino population 15 years and over
Males 55.7% Never married44.3% Now married0.0% Separated0.0% Widowed0.0% DivorcedFemales 57.7% Never married13.9% Now married1.9% Separated26.4% Widowed0.0% DivorcedWomen who gave birth in the past 12 months Now married:
0.0% (0)Unmarried:
100.0% (48)
Women who did not give birth in the past 12 months Now married:
27.9% (31)Unmarried:
72.1% (80)
Ancestries in Ashland
2,181 32.8% German948 14.2% English682 10.2% American502 7.5% Irish272 4.1% European160 2.4% Italian110 1.7% Scotch-Irish98 1.5% Polish96 1.4% French73 1.1% Scottish62 0.9% Hungarian46 0.7% Welsh36 0.5% Swiss31 0.5% Czech29 0.4% Norwegian28 0.4% Pennsylvania German24 0.4% Northern European16 0.2% Russian13 0.2% Dutch12 0.2% Greek11 0.2% British9 0.1% Iranian9 0.1% Swedish7 0.1% Jordanian5 0.08% Austrian5 0.08% Czechoslovakian
Geographical mobility in Ashland Same house 1 year ago 14,483 84.0% White (Caucasian)256 80.7% Black or African American79 92.5% American Indian / Alaska Native159 89.0% Asian94 98.6% Other race961 90.3% Two or more races14,490 84.0% White alone, not Hispanic / Latino336 74.4% Hispanic or LatinoMoved within same county 1,227 7.1% White / Caucasian17 5.3% Black or African American1 0.8% American Indian / Alaska Native12 6.6% Asian29 2.7% Two or more races1,254 7.3% White alone, not Hispanic / Latino1 0.2% Hispanic or LatinoMoved within same state 1,256 7.3% White / Caucasian48 15.1% Black or African American6 3.2% Asian32 3.0% Two or more races1,246 7.2% White alone, not Hispanic / Latino45 10.0% Hispanic or LatinoMoved from different state 229 1.3% White / Caucasian2 0.7% Black or African American12 13.8% American Indian / Alaska Native53 4.9% Two or more races197 1.1% White alone, not Hispanic / Latino76 17.0% Hispanic or LatinoMoved from abroad 16 0.1% White5 3.0% Asian18 0.1% White alone, not Hispanic / Latino
Children Nativity (place of birth) in Ashland
Children under 6 years - Living with two parents Both parents native 746 100.0% NativeOne native, one foreign-born parent 10 100.0% NativeChildren under 6 years - Living with one parent Native parent 341 100.0% NativeChildren 6 to 17 years - Living with two parents Both parents native 1,647 100.0% NativeBoth parents foreign-born 15 70.2% Native6 29.8% Foreign-bornOne native, one foreign-born parent 48 100.0% NativeChildren 6 to 17 years - Living with one parent Native parent 669 100.0% NativeForeign-born parent 37 50.4% Native36 49.6% Foreign-born
Grandparents responsible for own grandchildren in Ashland
Grandparents (30 to 59 years) White / Caucasian 10 17.5% Responsible for grandchildren49 82.5% Not responsible for grandchildrenWhite alone, not Hispanic / Latino 10 17.1% Responsible for grandchildren50 82.9% Not responsible for grandchildrenGrandparents (60 years and over) White / Caucasian 87 40.4% Responsible for grandchildren128 59.6% Not responsible for grandchildrenWhite alone, not Hispanic / Latino 87 40.2% Responsible for grandchildren129 59.8% Not responsible for grandchildren