Races in Albuquerque, New Mexico (NM) Detailed Stats
Data:
Races - White alone (%)
Races - White alone (% change since 2000)
Races - Black alone (%)
Races - Black alone (% change since 2000)
Races - American Indian alone (%)
Races - American Indian alone (% change since 2000)
Races - Asian alone (%)
Races - Asian alone (% change since 2000)
Races - Hispanic (%)
Races - Hispanic (% change since 2000)
Races - Native Hawaiian and Other Pacific Islander alone (%)
Races - Native Hawaiian and Other Pacific Islander alone (% change since 2000)
Races - Two or more races(%)
Races - Two or more races(% change since 2000)
Races - Other race alone (%)
Races - Other race alone (% change since 2000)
Racial diversity
Place of birth - Born in state of residence (%)
Place of birth - Born in state of residence (%) - White
Place of birth - Born in state of residence (%) - Black or African American
Place of birth - Born in state of residence (%) - Asian
Place of birth - Born in state of residence (%) - Hispanic or Latino
Place of birth - Born in state of residence (%) - American Indian and Alaska Native
Place of birth - Born in state of residence (%) - Multirace
Place of birth - Born in state of residence (%) - Other Race
Place of birth - Born in other state (%)
Place of birth - Born in other state (%) - White
Place of birth - Born in other state (%) - Black or African American
Place of birth - Born in other state (%) - Asian
Place of birth - Born in other state (%) - Hispanic or Latino
Place of birth - Born in other state (%) - American Indian and Alaska Native
Place of birth - Born in other state (%) - Multirace
Place of birth - Born in other state (%) - Other Race
Place of birth - Native, outside of US (%)
Place of birth - Native, outside of US (%) - White
Place of birth - Native, outside of US (%) - Black or African American
Place of birth - Native, outside of US (%) - Asian
Place of birth - Native, outside of US (%) - Hispanic or Latino
Place of birth - Native, outside of US (%) - American Indian and Alaska Native
Place of birth - Native, outside of US (%) - Multirace
Place of birth - Native, outside of US (%) - Other Race
Place of birth - Foreign born (%)
Place of birth - Foreign born (%) - White
Place of birth - Foreign born (%) - Black or African American
Place of birth - Foreign born (%) - Asian
Place of birth - Foreign born (%) - Hispanic or Latino
Place of birth - Foreign born (%) - American Indian and Alaska Native
Place of birth - Foreign born (%) - Multirace
Place of birth - Foreign born (%) - Other Race
Residents speaking English at home (%)
Residents speaking English at home - Born in the United States (%)
Residents speaking English at home - Native, born elsewhere (%)
Residents speaking English at home - Foreign born (%)
Residents speaking Spanish at home (%)
Residents speaking Spanish at home - Born in the United States (%)
Residents speaking Spanish at home - Native, born elsewhere (%)
Residents speaking Spanish at home - Foreign born (%)
Residents speaking other language at home (%)
Residents speaking other language at home - Born in the United States (%)
Residents speaking other language at home - Native, born elsewhere (%)
Residents speaking other language at home - Foreign born (%)
Marital status - Never married (%)
Marital status - Now married (%)
Marital status - Separated (%)
Marital status - Widowed (%)
Marital status - Divorced (%)
Ancestries Reported - Arab (%)
Ancestries Reported - Czech (%)
Ancestries Reported - Danish (%)
Ancestries Reported - Dutch (%)
Ancestries Reported - English (%)
Ancestries Reported - French (%)
Ancestries Reported - French Canadian (%)
Ancestries Reported - German (%)
Ancestries Reported - Greek (%)
Ancestries Reported - Hungarian (%)
Ancestries Reported - Irish (%)
Ancestries Reported - Italian (%)
Ancestries Reported - Lithuanian (%)
Ancestries Reported - Norwegian (%)
Ancestries Reported - Polish (%)
Ancestries Reported - Portuguese (%)
Ancestries Reported - Russian (%)
Ancestries Reported - Scotch-Irish (%)
Ancestries Reported - Scottish (%)
Ancestries Reported - Slovak (%)
Ancestries Reported - Subsaharan African (%)
Ancestries Reported - Swedish (%)
Ancestries Reported - Swiss (%)
Ancestries Reported - Ukrainian (%)
Ancestries Reported - United States (%)
Ancestries Reported - Welsh (%)
Ancestries Reported - West Indian (%)
Ancestries Reported - Other (%)
Geographical mobility - Same house 1 year ago (%)
Geographical mobility - Same house 1 year ago (%) - White
Geographical mobility - Same house 1 year ago (%) - Black or African American
Geographical mobility - Same house 1 year ago (%) - Asian
Geographical mobility - Same house 1 year ago (%) - Hispanic or Latino
Geographical mobility - Same house 1 year ago (%) - American Indian and Alaska Native
Geographical mobility - Same house 1 year ago (%) - Multirace
Geographical mobility - Same house 1 year ago (%) - Other Race
Geographical mobility - Moved within same county (%)
Geographical mobility - Moved within same county (%) - White
Geographical mobility - Moved within same county (%) - Black or African American
Geographical mobility - Moved within same county (%) - Asian
Geographical mobility - Moved within same county (%) - Hispanic or Latino
Geographical mobility - Moved within same county (%) - American Indian and Alaska Native
Geographical mobility - Moved within same county (%) - Multirace
Geographical mobility - Moved within same county (%) - Other Race
Geographical mobility - Moved from different county within same state (%)
Geographical mobility - Moved from different county within same state (%) - White
Geographical mobility - Moved from different county within same state (%) - Black or African American
Geographical mobility - Moved from different county within same state (%) - Asian
Geographical mobility - Moved from different county within same state (%) - Hispanic or Latino
Geographical mobility - Moved from different county within same state (%) - American Indian and Alaska Native
Geographical mobility - Moved from different county within same state (%) - Multirace
Geographical mobility - Moved from different county within same state (%) - Other Race
Geographical mobility - Moved from different state (%)
Geographical mobility - Moved from different state (%) - White
Geographical mobility - Moved from different state (%) - Black or African American
Geographical mobility - Moved from different state (%) - Asian
Geographical mobility - Moved from different state (%) - Hispanic or Latino
Geographical mobility - Moved from different state (%) - American Indian and Alaska Native
Geographical mobility - Moved from different state (%) - Multirace
Geographical mobility - Moved from different state (%) - Other Race
Geographical mobility - Moved from abroad (%)
Geographical mobility - Moved from abroad (%) - White
Geographical mobility - Moved from abroad (%) - Black or African American
Geographical mobility - Moved from abroad (%) - Asian
Geographical mobility - Moved from abroad (%) - Hispanic or Latino
Geographical mobility - Moved from abroad (%) - American Indian and Alaska Native
Geographical mobility - Moved from abroad (%) - Multirace
Geographical mobility - Moved from abroad (%) - Other Race
Place of birth for the foreign-born population - Ireland (%)
Place of birth for the foreign-born population - Denmark (%)
Place of birth for the foreign-born population - Norway (%)
Place of birth for the foreign-born population - Sweden (%)
Place of birth for the foreign-born population - United Kingdom (%)
Place of birth for the foreign-born population - England (%)
Place of birth for the foreign-born population - Scotland (%)
Place of birth for the foreign-born population - Other Northern Europe (%)
Place of birth for the foreign-born population - Austria (%)
Place of birth for the foreign-born population - Belgium (%)
Place of birth for the foreign-born population - France (%)
Place of birth for the foreign-born population - Germany (%)
Place of birth for the foreign-born population - Netherlands (%)
Place of birth for the foreign-born population - Switzerland (%)
Place of birth for the foreign-born population - Other Western Europe (%)
Place of birth for the foreign-born population - Greece (%)
Place of birth for the foreign-born population - Italy (%)
Place of birth for the foreign-born population - Portugal (%)
Place of birth for the foreign-born population - Spain (%)
Place of birth for the foreign-born population - Other Southern Europe (%)
Place of birth for the foreign-born population - Albania (%)
Place of birth for the foreign-born population - Belarus (%)
Place of birth for the foreign-born population - Bosnia and Herzegovina (%)
Place of birth for the foreign-born population - Bulgaria (%)
Place of birth for the foreign-born population - Croatia (%)
Place of birth for the foreign-born population - Czechoslovakia (%)
Place of birth for the foreign-born population - Hungary (%)
Place of birth for the foreign-born population - Latvia (%)
Place of birth for the foreign-born population - Lithuania (%)
Place of birth for the foreign-born population - North Macedonia (Macedonia) (%)
Place of birth for the foreign-born population - Moldova (%)
Place of birth for the foreign-born population - Poland (%)
Place of birth for the foreign-born population - Romania (%)
Place of birth for the foreign-born population - Russia (%)
Place of birth for the foreign-born population - Serbia (%)
Place of birth for the foreign-born population - Ukraine (%)
Place of birth for the foreign-born population - Other Eastern Europe (%)
Place of birth for the foreign-born population - China (%)
Place of birth for the foreign-born population - Hong Kong (%)
Place of birth for the foreign-born population - Taiwan (%)
Place of birth for the foreign-born population - Japan (%)
Place of birth for the foreign-born population - Korea (%)
Place of birth for the foreign-born population - Other Eastern Asia (%)
Place of birth for the foreign-born population - Afghanistan (%)
Place of birth for the foreign-born population - Bangladesh (%)
Place of birth for the foreign-born population - India (%)
Place of birth for the foreign-born population - Iran (%)
Place of birth for the foreign-born population - Kazakhstan (%)
Place of birth for the foreign-born population - Nepal (%)
Place of birth for the foreign-born population - Pakistan (%)
Place of birth for the foreign-born population - Sri Lanka (%)
Place of birth for the foreign-born population - Uzbekistan (%)
Place of birth for the foreign-born population - Other South Central Asia (%)
Place of birth for the foreign-born population - Burma (%)
Place of birth for the foreign-born population - Cambodia (%)
Place of birth for the foreign-born population - Indonesia (%)
Place of birth for the foreign-born population - Laos (%)
Place of birth for the foreign-born population - Malaysia (%)
Place of birth for the foreign-born population - Philippines (%)
Place of birth for the foreign-born population - Singapore (%)
Place of birth for the foreign-born population - Thailand (%)
Place of birth for the foreign-born population - Vietnam (%)
Place of birth for the foreign-born population - Other South Eastern Asia (%)
Place of birth for the foreign-born population - Armenia (%)
Place of birth for the foreign-born population - Iraq (%)
Place of birth for the foreign-born population - Israel (%)
Place of birth for the foreign-born population - Jordan (%)
Place of birth for the foreign-born population - Kuwait (%)
Place of birth for the foreign-born population - Lebanon (%)
Place of birth for the foreign-born population - Saudi Arabia (%)
Place of birth for the foreign-born population - Syria (%)
Place of birth for the foreign-born population - Turkey (%)
Place of birth for the foreign-born population - Yemen (%)
Place of birth for the foreign-born population - Other Western Asia (%)
Place of birth for the foreign-born population - Eritrea (%)
Place of birth for the foreign-born population - Ethiopia (%)
Place of birth for the foreign-born population - Kenya (%)
Place of birth for the foreign-born population - Somalia (%)
Place of birth for the foreign-born population - Uganda (%)
Place of birth for the foreign-born population - Zimbabwe (%)
Place of birth for the foreign-born population - Other Eastern Africa (%)
Place of birth for the foreign-born population - Cameroon (%)
Place of birth for the foreign-born population - Congo (%)
Place of birth for the foreign-born population - Democratic Republic of Congo (Zaire) (%)
Place of birth for the foreign-born population - Other Middle Africa (%)
Place of birth for the foreign-born population - Egypt (%)
Place of birth for the foreign-born population - Morocco (%)
Place of birth for the foreign-born population - Sudan (%)
Place of birth for the foreign-born population - Other Northern Africa (%)
Place of birth for the foreign-born population - South Africa (%)
Place of birth for the foreign-born population - Other Southern Africa (%)
Place of birth for the foreign-born population - Cabo Verde (%)
Place of birth for the foreign-born population - Ghana (%)
Place of birth for the foreign-born population - Liberia (%)
Place of birth for the foreign-born population - Nigeria (%)
Place of birth for the foreign-born population - Senegal (%)
Place of birth for the foreign-born population - Sierra Leone (%)
Place of birth for the foreign-born population - Other Western Africa (%)
Place of birth for the foreign-born population - Australia (%)
Place of birth for the foreign-born population - New Zealand (%)
Place of birth for the foreign-born population - Fiji (%)
Place of birth for the foreign-born population - Micronesia (%)
Place of birth for the foreign-born population - Bahamas (%)
Place of birth for the foreign-born population - Barbados (%)
Place of birth for the foreign-born population - Cuba (%)
Place of birth for the foreign-born population - Dominica (%)
Place of birth for the foreign-born population - Dominican Republic (%)
Place of birth for the foreign-born population - Grenada (%)
Place of birth for the foreign-born population - Haiti (%)
Place of birth for the foreign-born population - Jamaica (%)
Place of birth for the foreign-born population - St. Vincent and the Grenadines (%)
Place of birth for the foreign-born population - Trinidad and Tobago (%)
Place of birth for the foreign-born population - West Indies (%)
Place of birth for the foreign-born population - Other Caribbean (%)
Place of birth for the foreign-born population - Belize (%)
Place of birth for the foreign-born population - Costa Rica (%)
Place of birth for the foreign-born population - El Salvador (%)
Place of birth for the foreign-born population - Guatemala (%)
Place of birth for the foreign-born population - Honduras (%)
Place of birth for the foreign-born population - Mexico (%)
Place of birth for the foreign-born population - Nicaragua (%)
Place of birth for the foreign-born population - Panama (%)
Place of birth for the foreign-born population - Other Central America (%)
Place of birth for the foreign-born population - Argentina (%)
Place of birth for the foreign-born population - Bolivia (%)
Place of birth for the foreign-born population - Brazil (%)
Place of birth for the foreign-born population - Chile (%)
Place of birth for the foreign-born population - Colombia (%)
Place of birth for the foreign-born population - Ecuador (%)
Place of birth for the foreign-born population - Guyana (%)
Place of birth for the foreign-born population - Peru (%)
Place of birth for the foreign-born population - Uruguay (%)
Place of birth for the foreign-born population - Venezuela (%)
Place of birth for the foreign-born population - Other South America (%)
Place of birth for the foreign-born population - Canada (%)
Place of birth for the foreign-born population - Other Northern America (%)
Place of birth for the foreign-born population - Other (%)
Latest news about races in Albuquerque, NM collected exclusively by city-data.com from local newspapers, TV, and radio stations
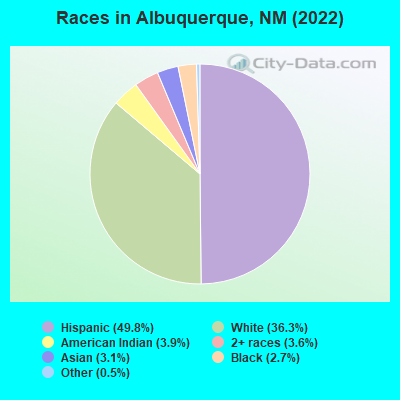
According to 2022 data, the most numerous races in Albuquerque, NM are Hispanic (279,243 residents), White alone (203,518 residents), and American Indian alone (22,010 residents). 74.8% of Albuquerque residents speak English at home. 10.5% of Albuquerque, NM residents are foreign-born (6.2% born in Latin America, 2.5% born in Asia), which is 13.9% greater than the foreign-born rate of 9.0% across the entire state of New Mexico.
Race distribution in Albuquerque
2000 2022
223,895 49.9% White alone 179,075 39.9% Hispanic 14,813 3.3% American Indian alone 12,376 2.8% Black alone 9,689 2.2% Asian alone 7,738 1.7% Two or more races 682 0.2% Other race alone 339 0.08% Native Hawaiian and Other
279,243 49.8% Hispanic 203,518 36.3% White alone 22,010 3.9% American Indian alone 20,099 3.6% Two or more races 17,473 3.1% Asian alone 15,328 2.7% Black alone 2,936 0.5% Other race alone 399 0.07% Native Hawaiian and Other
2000 2022
813,495 44.7% White alone 765,386 42.1% Hispanic 161,460 8.9% American Indian alone 30,654 1.7% Black alone 25,793 1.4% Two or more races 18,257 1.0% Asian alone 3,009 0.2% Other race alone 992 0.05% Native Hawaiian and Other
1,059,867 50.2% Hispanic 735,478 34.8% White alone 171,808 8.1% American Indian alone 65,084 3.1% Two or more races 36,870 1.7% Black alone 35,870 1.7% Asian alone 7,582 0.4% Other race alone 785 0.04% Native Hawaiian and Other
Income and house value in Albuquerque Median household income in 2022 $74,977 White non-Hispanic householders$56,036 Black householders$52,283 American Indian and Alaska Native householders$76,534 Asian householders$55,044 Native Hawaiian and other Pacific Islander householders$60,494 Some other race householders$58,770 Two or more races householders$58,685 Hispanic or Latino race householdersMedian 2022 house value $320,674 White Non-Hispanic householders$282,398 Black or African American householders$254,625 American Indian or Alaska Native householders $324,641 Asian householders$315,539 Native Hawaiian and other Pacific Islander householders$247,390 Some other race householders$276,330 Two or more races householders$255,325 Hispanic or Latino householders
Median age by race in Albuquerque
42.8 Median age for White residents41.1 44.5 30.7 Median age for Black or African American residents30.7 30.8 32.9 Median age for American Indian / Alaska Native residents30.2 34.5 39.3 Median age for Asian residents37.6 41.7 44.2 Median age for Native Hawaiian / Pacific Islander residents23.0 38.5 38.1 Median age for Other race residents34.7 40.7 33.8 Median age for Two or more races residents32.9 34.3 49.7 Median age for White alone residents47.4 51.6 32.9 Median age for Hispanic or Latino residents31.6 34.6
Owner/renter occupied households by race in Albuquerque
House owners and renters - White residents 89,515 65.0% Owner occupied48,259 35.0% Renter occupiedHouse owners and renters - Black or African American residents 3,921 54.6% Owner occupied3,259 45.4% Renter occupiedHouse owners and renters - American Indian / Alaska Native residents 4,254 44.5% Owner occupied5,295 55.5% Renter occupiedHouse owners and renters - Asian residents 3,910 67.6% Owner occupied1,870 32.4% Renter occupiedHouse owners and renters - Native Hawaiian / Pacific Islander residents 88 30.8% Owner occupied198 69.2% Renter occupiedHouse owners and renters - Other race residents 19,775 68.2% Owner occupied9,201 31.8% Renter occupiedHouse owners and renters - Two or more races residents 33,517 61.9% Owner occupied20,630 38.1% Renter occupiedHouse owners and renters - White alone residents 71,215 65.1% Owner occupied38,245 34.9% Renter occupiedHouse owners and renters - Hispanic or Latino residents 67,094 64.9% Owner occupied36,303 35.1% Renter occupied
Language usage in Albuquerque
English speakers - Total 74.8% of residents of Albuquerque speak English at home.
20.3% of residents speak Spanish at home 78,962 73.1% Speak English very well29,122 26.9% Speak English less than very well4.9% of residents speak other language at home 21,262 80.6% Speak English very well5,123 19.4% Speak English less than very well
English speakers - Born in the United States 86.8% of residents of Albuquerque speak English at home.
11.2% of residents speak Spanish at home 19,243 87.2% Speak English very well2,832 12.8% Speak English less than very well2.0% of residents speak other language at home 3,771 96.8% Speak English very well123 3.2% Speak English less than very well
English speakers - Native, born elsewhere 78.3% of residents of Albuquerque speak English at home.
17.5% of residents speak Spanish at home 1,480 100.0% Speak English very well4.2% of residents speak other language at home 353 100.0% Speak English very well
English speakers - Foreign-born 16.2% of residents of Albuquerque speak English at home.
54.8% of residents speak Spanish at home 11,672 39.3% Speak English very well18,051 60.7% Speak English less than very well29.0% of residents speak other language at home 11,026 70.0% Speak English very well4,733 30.0% Speak English less than very well
White (Caucasian) - Speak only English Native:
91.8% (234,954)Foreign-born:
38.4% (3,176)
White (Caucasian) - Speak another language Native:
8.2% (20,911)Foreign-born:
61.6% (5,100)
Black or African American - Speak only English Native:
94.9% (15,962)Foreign-born:
45.8% (773)
Black or African American - Speak another language Native:
5.1% (852)Foreign-born:
54.2% (916)
American Indian / Alaska Native - Speak only English Native:
73.2% (18,351)Foreign-born:
6.6% (51)
American Indian / Alaska Native - Speak another language Native:
26.8% (6,708)Foreign-born:
93.4% (725)
Asian - Speak only English Native:
73.4% (4,153)Foreign-born:
15.6% (1,892)
Asian - Speak another language Native:
26.6% (1,506)Foreign-born:
84.4% (10,217)
Native Hawaiian / Pacific Islander - Speak only English Native:
95.4% (406)Foreign-born:
48.7% (86)
Native Hawaiian / Pacific Islander - Speak another language Native:
4.1% (18)Foreign-born:
49.9% (88)
Other race - Speak only English Native:
56.4% (31,547)Foreign-born:
9.4% (1,654)
Other race - Speak another language Native:
43.6% (24,362)Foreign-born:
90.6% (15,861)
Two or more races - Speak only English Native:
71.1% (85,137)Foreign-born:
8.3% (1,138)
Two or more races - Speak another language Native:
28.9% (34,648)Foreign-born:
91.7% (12,560)
White alone - Speak only English Native:
97.1% (185,583)Foreign-born:
45.1% (2,839)
White alone - Speak another language Native:
2.9% (5,508)Foreign-born:
54.9% (3,462)
Hispanic or Latino - Speak only English Native:
67.5% (154,397)Foreign-born:
10.0% (3,289)
Hispanic or Latino - Speak another language Native:
32.5% (74,231)Foreign-born:
90.0% (29,572)
Foreign-born residents in Albuquerque 58,616 residents are foreign born (6.2% Latin America , 2.5% Asia ).
This city:
10.5%New Mexico:
9.2%
Marital status for residents in Albuquerque Marital status - White (Caucasian) population 15 years and over
Males 36.3% Never married44.7% Now married1.1% Separated2.8% Widowed15.0% DivorcedFemales 32.4% Never married38.8% Now married0.9% Separated9.4% Widowed18.3% DivorcedWomen who gave birth in the past 12 months Now married:
73.3% (2,373)Unmarried:
26.7% (863)
Women who did not give birth in the past 12 months Now married:
34.4% (20,378)Unmarried:
65.6% (38,887)
Marital status - Black or African American population 15 years and over
Males 44.0% Never married42.5% Now married2.1% Separated0.8% Widowed10.5% DivorcedFemales 49.0% Never married23.2% Now married0.0% Separated6.9% Widowed20.9% DivorcedWomen who gave birth in the past 12 months Now married:
58.1% (60)Unmarried:
41.9% (43)
Women who did not give birth in the past 12 months Now married:
23.2% (929)Unmarried:
76.8% (3,077)
Marital status - American Indian / Alaska Native population 15 years and over
Males 70.7% Never married15.4% Now married4.6% Separated0.6% Widowed8.6% DivorcedFemales 56.6% Never married21.7% Now married2.6% Separated2.0% Widowed17.3% DivorcedWomen who gave birth in the past 12 months Now married:
70.6% (344)Unmarried:
29.4% (143)
Women who did not give birth in the past 12 months Now married:
16.4% (1,304)Unmarried:
83.6% (6,653)
Marital status - Asian population 15 years and over
Males 31.8% Never married57.7% Now married1.7% Separated2.9% Widowed6.0% DivorcedFemales 26.0% Never married58.7% Now married0.8% Separated10.7% Widowed3.8% DivorcedWomen who gave birth in the past 12 months Now married:
100.0% (244)Unmarried:
0.0% (0)
Women who did not give birth in the past 12 months Now married:
64.7% (3,002)Unmarried:
35.3% (1,635)
Marital status - Native Hawaiian / Pacific Islander population 15 years and over
Males 34.8% Never married65.2% Now married0.0% Separated0.0% Widowed0.0% DivorcedFemales 62.5% Never married37.5% Now married0.0% Separated0.0% Widowed0.0% DivorcedWomen who did not give birth in the past 12 months Now married:
28.1% (65)Unmarried:
71.9% (167)
Marital status - Other race population 15 years and over
Males 43.0% Never married43.7% Now married1.3% Separated0.9% Widowed11.0% DivorcedFemales 36.6% Never married41.6% Now married1.9% Separated6.3% Widowed13.6% DivorcedWomen who gave birth in the past 12 months Now married:
58.2% (658)Unmarried:
41.8% (472)
Women who did not give birth in the past 12 months Now married:
37.2% (7,182)Unmarried:
62.8% (12,138)
Marital status - Two or more races population 15 years and over
Males 47.3% Never married37.2% Now married1.4% Separated1.9% Widowed12.2% DivorcedFemales 39.8% Never married35.5% Now married1.6% Separated7.6% Widowed15.6% DivorcedWomen who gave birth in the past 12 months Now married:
78.7% (1,390)Unmarried:
21.3% (376)
Women who did not give birth in the past 12 months Now married:
29.8% (10,480)Unmarried:
70.2% (24,685)
Marital status - White alone, not Hispanic / Latino population 15 years and over
Males 32.8% Never married46.9% Now married0.8% Separated3.2% Widowed16.3% DivorcedFemales 27.0% Never married40.3% Now married0.8% Separated10.8% Widowed21.0% DivorcedWomen who gave birth in the past 12 months Now married:
100.0% (2,127)Unmarried:
0.0% (0)
Women who did not give birth in the past 12 months Now married:
34.8% (13,197)Unmarried:
65.2% (24,713)
Marital status - Hispanic or Latino population 15 years and over
Males 46.5% Never married38.7% Now married2.0% Separated1.6% Widowed11.2% DivorcedFemales 42.1% Never married36.2% Now married2.0% Separated6.8% Widowed12.9% DivorcedWomen who gave birth in the past 12 months Now married:
52.9% (1,920)Unmarried:
47.1% (1,711)
Women who did not give birth in the past 12 months Now married:
32.8% (23,669)Unmarried:
67.2% (48,510)
Ancestries in Albuquerque
18,224 5.8% English13,379 4.2% American12,293 3.9% German11,145 3.5% Irish6,298 2.0% European5,456 1.7% Italian2,043 0.6% Scottish1,793 0.6% Polish1,564 0.5% French1,446 0.5% Scotch-Irish1,326 0.4% British1,154 0.4% Norwegian1,049 0.3% Dutch1,022 0.3% Northern European936 0.3% Scandinavian928 0.3% African844 0.3% Russian843 0.3% Swedish789 0.2% Greek576 0.2% Iranian555 0.2% Ukrainian552 0.2% Nigerian535 0.2% Eastern European512 0.2% Czech491 0.2% French Canadian485 0.2% Danish459 0.1% Welsh389 0.1% Canadian375 0.1% Portuguese370 0.1% Iraqi361 0.1% Hungarian344 0.1% Palestinian320 0.1% Lebanese283 0.09% Afghan265 0.08% Romanian244 0.08% Belgian236 0.07% Swiss216 0.07% Arab203 0.06% Turkish180 0.06% Finnish171 0.05% Lithuanian161 0.05% Slavic154 0.05% Czechoslovakian143 0.05% Brazilian139 0.04% Ethiopian122 0.04% Celtic118 0.04% Syrian118 0.04% Cajun111 0.04% Guyanese103 0.03% Pennsylvania German97 0.03% Liberian92 0.03% Egyptian85 0.03% Slovak83 0.03% Croatian81 0.03% Ghanaian75 0.02% Haitian66 0.02% Moroccan66 0.02% Austrian50 0.02% Jamaican49 0.02% Yugoslavian48 0.02% Slovene48 0.02% Bulgarian48 0.02% Australian47 0.01% Serbian43 0.01% Basque40 0.01% Israeli40 0.01% Kenyan39 0.01% Armenian35 0.01% Jordanian29 0.01% South African29 0.01% Sudanese24 0.01% New Zealander22 0.01% Ugandan22 0.01% Icelander21 0.01% German Russian21 0.01% Dutch West Indian17 0.01% U.S. Virgin Islander16 0.01% Trinidadian and Tobagonian
Geographical mobility in Albuquerque Same house 1 year ago 234,406 85.9% White (Caucasian)16,507 85.4% Black or African American22,175 83.5% American Indian / Alaska Native15,428 83.2% Asian330 55.0% Native Hawaiian / Pacific Islander68,895 91.4% Other race123,369 87.0% Two or more races173,582 85.8% White alone, not Hispanic / Latino243,391 88.5% Hispanic or LatinoMoved within same county 22,769 8.3% White / Caucasian2,023 10.5% Black or African American2,871 10.8% American Indian / Alaska Native463 2.5% Asian134 22.3% Native Hawaiian / Pacific Islander4,108 5.5% Other race11,272 7.9% Two or more races16,228 8.0% White alone, not Hispanic / Latino20,552 7.5% Hispanic or LatinoMoved within same state 2,830 1.0% White / Caucasian170 0.9% Black or African American844 3.2% American Indian / Alaska Native464 0.6% Other race2,011 1.4% Two or more races1,842 0.9% White alone, not Hispanic / Latino2,859 1.0% Hispanic or LatinoMoved from different state 12,394 4.5% White / Caucasian627 3.2% Black or African American494 1.9% American Indian / Alaska Native1,574 8.5% Asian131 21.8% Native Hawaiian / Pacific Islander1,322 1.8% Other race4,928 3.5% Two or more races10,187 5.0% White alone, not Hispanic / Latino7,633 2.8% Hispanic or LatinoMoved from abroad 460 0.2% White187 0.7% American Indian / Alaska Native1,073 5.8% Asian570 0.8% Other race231 0.2% Two or more races370 0.2% White alone, not Hispanic / Latino709 0.3% Hispanic or Latino
Children Nativity (place of birth) in Albuquerque
Children under 6 years - Living with two parents Both parents native 16,635 99.0% Native169 1.0% Foreign-bornBoth parents foreign-born 994 88.5% Native129 11.5% Foreign-bornOne native, one foreign-born parent 1,991 100.0% NativeChildren under 6 years - Living with one parent Native parent 11,747 100.0% NativeForeign-born parent 981 100.0% NativeChildren 6 to 17 years - Living with two parents Both parents native 27,604 98.4% Native439 1.6% Foreign-bornBoth parents foreign-born 6,337 84.9% Native1,128 15.1% Foreign-bornOne native, one foreign-born parent 4,038 100.0% NativeChildren 6 to 17 years - Living with one parent Native parent 30,334 100.0% NativeForeign-born parent 4,561 50.0% Native4,561 50.0% Foreign-born
Place of birth for residents in Albuquerque 36,051 Americas35,364 Latin America30,159 Central America14,504 Asia5,956 South Eastern Asia5,375 Europe3,828 South Central Asia2,894 Eastern Asia2,808 South America2,395 Caribbean2,328 Africa2,252 Western Europe1,941 China1,735 Western Asia1,221 Northern Europe1,048 Eastern Europe906 Eastern Africa852 Southern Europe727 Western Africa687 Northern America355 Oceania349 Middle Africa188 Northern Africa152 Australia and New Zealand Subregion147 Southern Africa29,215 Mexico3,267 Vietnam2,307 Philippines1,796 Cuba1,701 India1,576 Germany1,493 China862 Colombia687 Canada613 Iran581 United Kingdom546 Korea542 Iraq532 Nigeria527 Peru447 Tanzania427 England405 Japan399 Russia385 Pakistan377 Guatemala374 France362 Taiwan349 Ecuador325 Jordan306 Nepal304 Afghanistan295 Greece286 Spain280 El Salvador268 Venezuela251 Bangladesh247 Brazil242 Democratic Republic of Congo (Zaire)237 Italy225 Dominican Republic225 Romania213 Turkey203 Israel193 Lebanon191 Bolivia190 Argentina179 Ukraine156 Kenya149 Ethiopia147 Thailand147 South Africa143 Micronesia139 Australia124 Syria123 Uzbekistan116 Guyana112 Liberia106 Honduras101 West Indies94 Morocco86 Hong Kong84 Netherlands80 Scotland80 Belgium79 Ghana74 Nicaragua73 Austria72 Indonesia69 Laos68 Saudi Arabia64 Panama63 Switzerland61 Poland56 Haiti54 Malaysia52 Congo52 Bulgaria49 Jamaica48 Kazakhstan43 Trinidad and Tobago41 Sweden41 Costa Rica40 Dominica40 Ireland39 Sri Lanka38 Egypt35 Zimbabwe34 Cameroon33 Cambodia32 Portugal31 Chile29 Sudan28 Norway23 Uganda23 United Arab Emirates22 Kuwait22 Moldova20 Czechoslovakia18 Armenia15 Eritrea14 Fiji13 New Zealand13 Serbia11 Bosnia and Herzegovina10 Algeria9 St. Vincent and the Grenadines8 Hungary8 Uruguay4 Singapore2 Belarus
Grandparents responsible for own grandchildren in Albuquerque
Grandparents (30 to 59 years) White / Caucasian 903 46.9% Responsible for grandchildren1,024 53.1% Not responsible for grandchildrenBlack or African American 53 53.1% Responsible for grandchildren46 46.9% Not responsible for grandchildrenAmerican Indian / Alaska Native 140 50.7% Responsible for grandchildren137 49.3% Not responsible for grandchildrenAsian 20 16.9% Responsible for grandchildren96 83.1% Not responsible for grandchildrenOther race 376 59.2% Responsible for grandchildren259 40.8% Not responsible for grandchildrenTwo or more races 741 74.5% Responsible for grandchildren253 25.5% Not responsible for grandchildrenWhite alone, not Hispanic / Latino 325 37.9% Responsible for grandchildren532 62.1% Not responsible for grandchildrenHispanic or Latino 1,641 62.8% Responsible for grandchildren973 37.2% Not responsible for grandchildrenGrandparents (60 years and over) White / Caucasian 1,076 40.8% Responsible for grandchildren1,562 59.2% Not responsible for grandchildrenBlack or African American 22 23.2% Responsible for grandchildren73 76.8% Not responsible for grandchildrenAmerican Indian / Alaska Native 138 49.9% Responsible for grandchildren139 50.1% Not responsible for grandchildrenAsian 264 100.0% Not responsible for grandchildrenOther race 148 20.6% Responsible for grandchildren568 79.4% Not responsible for grandchildrenTwo or more races 446 21.8% Responsible for grandchildren1,599 78.2% Not responsible for grandchildrenWhite alone, not Hispanic / Latino 303 17.1% Responsible for grandchildren1,473 82.9% Not responsible for grandchildrenHispanic or Latino 1,456 39.8% Responsible for grandchildren2,203 60.2% Not responsible for grandchildren
Zip codes: 87048 , 87102 , 87104 , 87105 , 87106 , 87107 , 87108 , 87109 , 87110 , 87111 , 87112 , 87113 , 87114 , 87116 , 87117 , 87120 , 87121 , 87122 , 87123 .