Races in Agawam, Massachusetts (MA) Detailed Stats
Ancestries, Foreign-born residents, place of birth

Recent posts about races in Agawam, Massachusetts on our local forum with over 2,400,000 registered users:
 | Big MA Ancestry Data Thread by Town (31 replies) |
| Nice areas of Agawam MA (4 replies) |
| New Job in Springfield MA (Baystate) Housing Options (33 replies) |
| Nice Neighborhoods Near Springfield (108 replies) |
| Springfield to Boston rail (229 replies) |
| Southerner wanting to move up north. Advice please (155 replies) |
Latest news about races in Agawam, MA collected exclusively by city-data.com from local newspapers, TV, and radio stations
5.3% of Agawam, MA residents are foreign-born (3.1% born in Europe, 1.1% born in Asia, 0.8% born in North America), which is 237.3% less than the foreign-born rate of 18.0% across the entire state of Massachusetts.
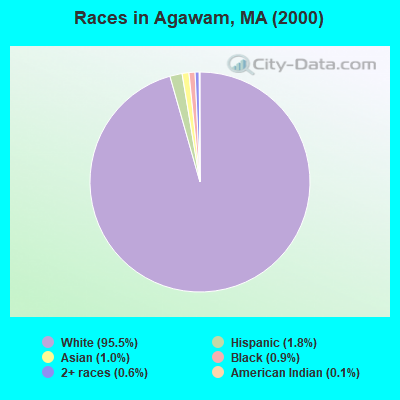
Race distribution in Agawam

- 26,87195.5%White alone
- 5141.8%Hispanic
- 2721.0%Asian alone
- 2490.9%Black alone
- 1820.6%Two or more races
- 400.1%American Indian alone
- 140.05%Other race alone
- 20.01%Native Hawaiian and Other
Pacific Islander alone
2000
2022
-
- 5,198,35981.9%White alone
- 428,7296.8%Hispanic
- 318,3295.0%Black alone
- 236,7863.7%Asian alone
- 110,3381.7%Two or more races
- 43,5860.7%Other race alone
- 11,2640.2%American Indian alone
- 1,7060.03%Native Hawaiian and Other
Pacific Islander alone

-
- 4,676,62767.0%White alone
- 911,03813.0%Hispanic
- 501,4637.2%Asian alone
- 459,7406.6%Black alone
- 341,8894.9%Two or more races
- 84,4031.2%Other race alone
- 5,8380.08%American Indian alone
- 9760.01%Native Hawaiian and Other
Pacific Islander alone

Income and house value in Agawam
- Median household income in 2022
- $86,908White non-Hispanic householders
- $91,488Black householders
- $68,185American Indian and Alaska Native householders
- $58,330Asian householders
- $139,895Some other race householders
- $37,621Two or more races householders
- $124,896Hispanic or Latino race householders
- Median 2022 house value
- $327,255White Non-Hispanic householders
- $361,743Black or African American householders
- $279,122American Indian or Alaska Native householders
- $539,885Asian householders
- $136,459Some other race householders
- $279,122Two or more races householders
- $297,730Hispanic or Latino householders
Household income for White non-Hispanic householders

Household income for Black householders

Household income for American Indian and Alaska Native householders

Household income for Asian householders

Household income for Two or more races householders

Household income for Hispanic or Latino race householders

Foreign-born residents in Agawam
1,502 residents are foreign born (3.1% Europe, 1.1% Asia, 0.8% North America).
| This city: | 5.3% |
| Massachusetts: | 12.2% |
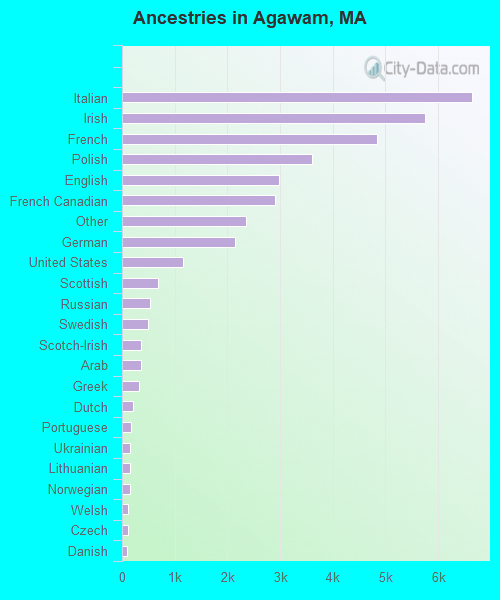
Ancestries in Agawam

- 6,63318.2%Italian
- 5,75215.8%Irish
- 4,83913.3%French
- 3,6149.9%Polish
- 2,9848.2%English
- 2,9098.0%French Canadian
- 2,3466.4%Other
- 2,1435.9%German
- 1,1613.2%United States
- 6801.9%Scottish
- 5231.4%Russian
- 4951.4%Swedish
- 3691.0%Scotch-Irish
- 3561.0%Arab
- 3230.9%Greek
- 2000.5%Dutch
- 1800.5%Portuguese
- 1520.4%Ukrainian
- 1490.4%Lithuanian
- 1470.4%Norwegian
- 1210.3%Welsh
- 1060.3%Czech
- 880.2%Danish
- 600.2%West Indian
- 510.1%Swiss
- 480.1%Slovak
- 410.1%Hungarian
- 230.06%Subsaharan African
Zip codes: 01030.