Races in Absecon, New Jersey (NJ) Detailed Stats
Data:
Races - White alone (%)
Races - White alone (% change since 2000)
Races - Black alone (%)
Races - Black alone (% change since 2000)
Races - American Indian alone (%)
Races - American Indian alone (% change since 2000)
Races - Asian alone (%)
Races - Asian alone (% change since 2000)
Races - Hispanic (%)
Races - Hispanic (% change since 2000)
Races - Native Hawaiian and Other Pacific Islander alone (%)
Races - Native Hawaiian and Other Pacific Islander alone (% change since 2000)
Races - Two or more races(%)
Races - Two or more races(% change since 2000)
Races - Other race alone (%)
Races - Other race alone (% change since 2000)
Racial diversity
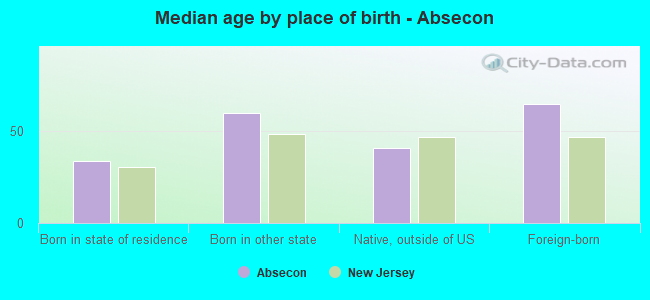
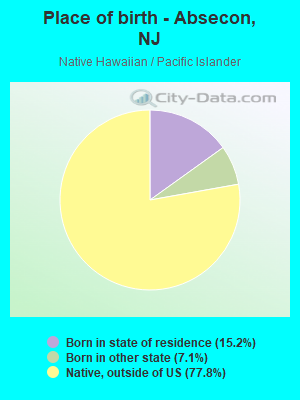
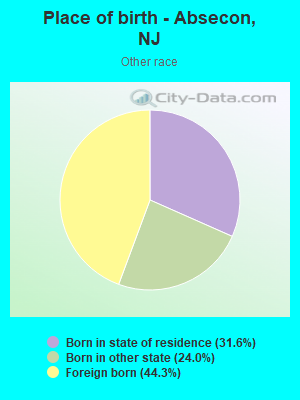
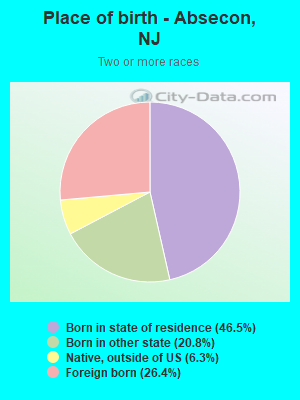
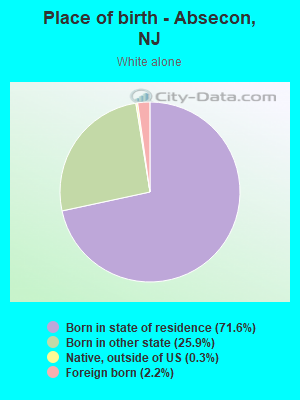
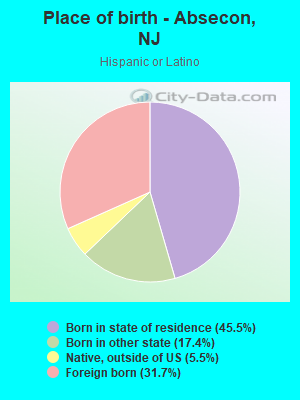
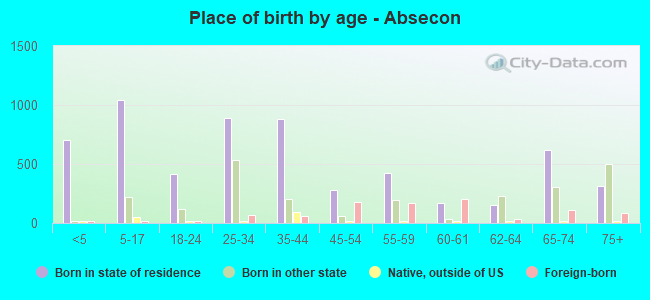
Place of birth - Born in state of residence (%)
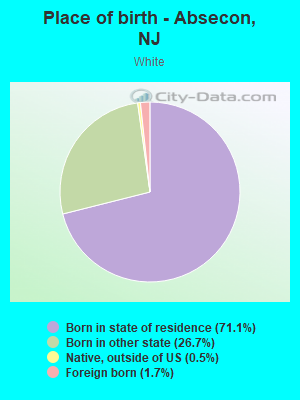
Place of birth - Born in state of residence (%) - White
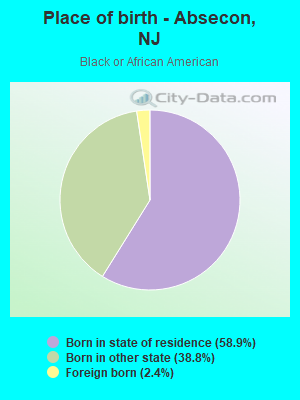
Place of birth - Born in state of residence (%) - Black or African American
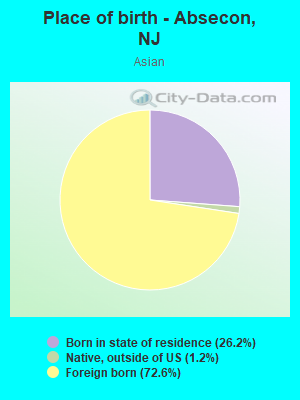
Place of birth - Born in state of residence (%) - Asian
Place of birth - Born in state of residence (%) - Hispanic or Latino
Place of birth - Born in state of residence (%) - American Indian and Alaska Native
Place of birth - Born in state of residence (%) - Multirace
Place of birth - Born in state of residence (%) - Other Race
Place of birth - Born in other state (%)
Place of birth - Born in other state (%) - White
Place of birth - Born in other state (%) - Black or African American
Place of birth - Born in other state (%) - Asian
Place of birth - Born in other state (%) - Hispanic or Latino
Place of birth - Born in other state (%) - American Indian and Alaska Native
Place of birth - Born in other state (%) - Multirace
Place of birth - Born in other state (%) - Other Race
Place of birth - Native, outside of US (%)
Place of birth - Native, outside of US (%) - White
Place of birth - Native, outside of US (%) - Black or African American
Place of birth - Native, outside of US (%) - Asian
Place of birth - Native, outside of US (%) - Hispanic or Latino
Place of birth - Native, outside of US (%) - American Indian and Alaska Native
Place of birth - Native, outside of US (%) - Multirace
Place of birth - Native, outside of US (%) - Other Race
Place of birth - Foreign born (%)
Place of birth - Foreign born (%) - White
Place of birth - Foreign born (%) - Black or African American
Place of birth - Foreign born (%) - Asian
Place of birth - Foreign born (%) - Hispanic or Latino
Place of birth - Foreign born (%) - American Indian and Alaska Native
Place of birth - Foreign born (%) - Multirace
Place of birth - Foreign born (%) - Other Race
Residents speaking English at home (%)
Residents speaking English at home - Born in the United States (%)
Residents speaking English at home - Native, born elsewhere (%)
Residents speaking English at home - Foreign born (%)
Residents speaking Spanish at home (%)
Residents speaking Spanish at home - Born in the United States (%)
Residents speaking Spanish at home - Native, born elsewhere (%)
Residents speaking Spanish at home - Foreign born (%)
Residents speaking other language at home (%)
Residents speaking other language at home - Born in the United States (%)
Residents speaking other language at home - Native, born elsewhere (%)
Residents speaking other language at home - Foreign born (%)
Marital status - Never married (%)
Marital status - Now married (%)
Marital status - Separated (%)
Marital status - Widowed (%)
Marital status - Divorced (%)
Ancestries Reported - Arab (%)
Ancestries Reported - Czech (%)
Ancestries Reported - Danish (%)
Ancestries Reported - Dutch (%)
Ancestries Reported - English (%)
Ancestries Reported - French (%)
Ancestries Reported - French Canadian (%)
Ancestries Reported - German (%)
Ancestries Reported - Greek (%)
Ancestries Reported - Hungarian (%)
Ancestries Reported - Irish (%)
Ancestries Reported - Italian (%)
Ancestries Reported - Lithuanian (%)
Ancestries Reported - Norwegian (%)
Ancestries Reported - Polish (%)
Ancestries Reported - Portuguese (%)
Ancestries Reported - Russian (%)
Ancestries Reported - Scotch-Irish (%)
Ancestries Reported - Scottish (%)
Ancestries Reported - Slovak (%)
Ancestries Reported - Subsaharan African (%)
Ancestries Reported - Swedish (%)
Ancestries Reported - Swiss (%)
Ancestries Reported - Ukrainian (%)
Ancestries Reported - United States (%)
Ancestries Reported - Welsh (%)
Ancestries Reported - West Indian (%)
Ancestries Reported - Other (%)
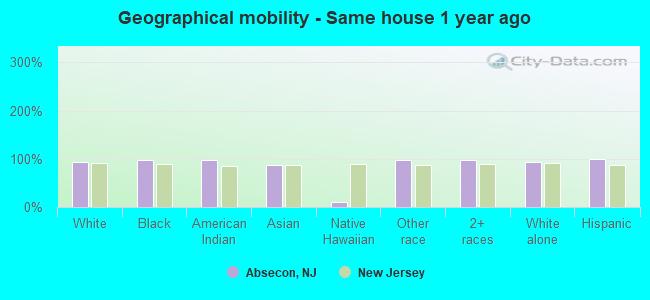
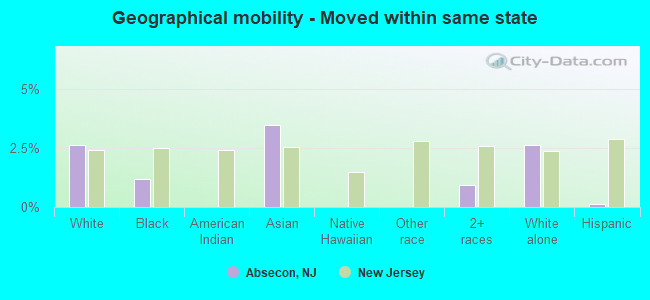
Geographical mobility - Same house 1 year ago (%)
Geographical mobility - Same house 1 year ago (%) - White
Geographical mobility - Same house 1 year ago (%) - Black or African American
Geographical mobility - Same house 1 year ago (%) - Asian
Geographical mobility - Same house 1 year ago (%) - Hispanic or Latino
Geographical mobility - Same house 1 year ago (%) - American Indian and Alaska Native
Geographical mobility - Same house 1 year ago (%) - Multirace
Geographical mobility - Same house 1 year ago (%) - Other Race
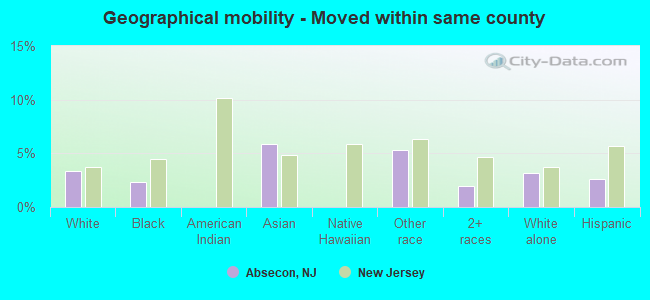
Geographical mobility - Moved within same county (%)
Geographical mobility - Moved within same county (%) - White
Geographical mobility - Moved within same county (%) - Black or African American
Geographical mobility - Moved within same county (%) - Asian
Geographical mobility - Moved within same county (%) - Hispanic or Latino
Geographical mobility - Moved within same county (%) - American Indian and Alaska Native
Geographical mobility - Moved within same county (%) - Multirace
Geographical mobility - Moved within same county (%) - Other Race
Geographical mobility - Moved from different county within same state (%)
Geographical mobility - Moved from different county within same state (%) - White
Geographical mobility - Moved from different county within same state (%) - Black or African American
Geographical mobility - Moved from different county within same state (%) - Asian
Geographical mobility - Moved from different county within same state (%) - Hispanic or Latino
Geographical mobility - Moved from different county within same state (%) - American Indian and Alaska Native
Geographical mobility - Moved from different county within same state (%) - Multirace
Geographical mobility - Moved from different county within same state (%) - Other Race
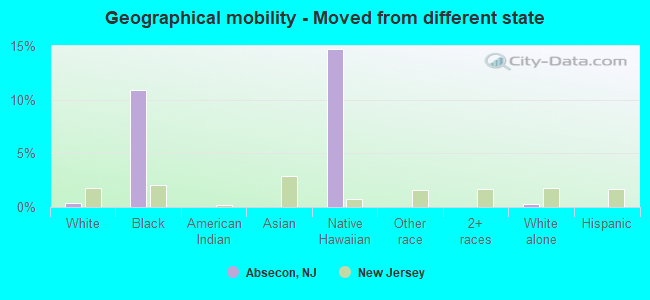
Geographical mobility - Moved from different state (%)
Geographical mobility - Moved from different state (%) - White
Geographical mobility - Moved from different state (%) - Black or African American
Geographical mobility - Moved from different state (%) - Asian
Geographical mobility - Moved from different state (%) - Hispanic or Latino
Geographical mobility - Moved from different state (%) - American Indian and Alaska Native
Geographical mobility - Moved from different state (%) - Multirace
Geographical mobility - Moved from different state (%) - Other Race
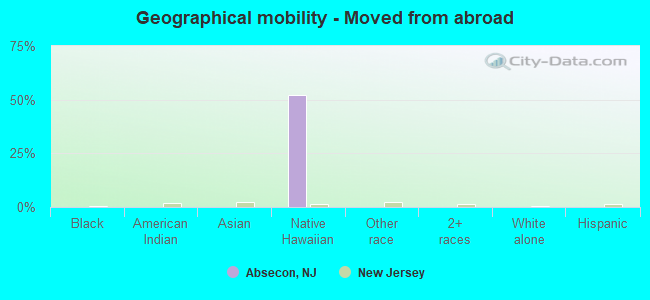
Geographical mobility - Moved from abroad (%)
Geographical mobility - Moved from abroad (%) - White
Geographical mobility - Moved from abroad (%) - Black or African American
Geographical mobility - Moved from abroad (%) - Asian
Geographical mobility - Moved from abroad (%) - Hispanic or Latino
Geographical mobility - Moved from abroad (%) - American Indian and Alaska Native
Geographical mobility - Moved from abroad (%) - Multirace
Geographical mobility - Moved from abroad (%) - Other Race
Place of birth for the foreign-born population - Ireland (%)
Place of birth for the foreign-born population - Denmark (%)
Place of birth for the foreign-born population - Norway (%)
Place of birth for the foreign-born population - Sweden (%)
Place of birth for the foreign-born population - United Kingdom (%)
Place of birth for the foreign-born population - England (%)
Place of birth for the foreign-born population - Scotland (%)
Place of birth for the foreign-born population - Other Northern Europe (%)
Place of birth for the foreign-born population - Austria (%)
Place of birth for the foreign-born population - Belgium (%)
Place of birth for the foreign-born population - France (%)
Place of birth for the foreign-born population - Germany (%)
Place of birth for the foreign-born population - Netherlands (%)
Place of birth for the foreign-born population - Switzerland (%)
Place of birth for the foreign-born population - Other Western Europe (%)
Place of birth for the foreign-born population - Greece (%)
Place of birth for the foreign-born population - Italy (%)
Place of birth for the foreign-born population - Portugal (%)
Place of birth for the foreign-born population - Spain (%)
Place of birth for the foreign-born population - Other Southern Europe (%)
Place of birth for the foreign-born population - Albania (%)
Place of birth for the foreign-born population - Belarus (%)
Place of birth for the foreign-born population - Bosnia and Herzegovina (%)
Place of birth for the foreign-born population - Bulgaria (%)
Place of birth for the foreign-born population - Croatia (%)
Place of birth for the foreign-born population - Czechoslovakia (%)
Place of birth for the foreign-born population - Hungary (%)
Place of birth for the foreign-born population - Latvia (%)
Place of birth for the foreign-born population - Lithuania (%)
Place of birth for the foreign-born population - North Macedonia (Macedonia) (%)
Place of birth for the foreign-born population - Moldova (%)
Place of birth for the foreign-born population - Poland (%)
Place of birth for the foreign-born population - Romania (%)
Place of birth for the foreign-born population - Russia (%)
Place of birth for the foreign-born population - Serbia (%)
Place of birth for the foreign-born population - Ukraine (%)
Place of birth for the foreign-born population - Other Eastern Europe (%)
Place of birth for the foreign-born population - China (%)
Place of birth for the foreign-born population - Hong Kong (%)
Place of birth for the foreign-born population - Taiwan (%)
Place of birth for the foreign-born population - Japan (%)
Place of birth for the foreign-born population - Korea (%)
Place of birth for the foreign-born population - Other Eastern Asia (%)
Place of birth for the foreign-born population - Afghanistan (%)
Place of birth for the foreign-born population - Bangladesh (%)
Place of birth for the foreign-born population - India (%)
Place of birth for the foreign-born population - Iran (%)
Place of birth for the foreign-born population - Kazakhstan (%)
Place of birth for the foreign-born population - Nepal (%)
Place of birth for the foreign-born population - Pakistan (%)
Place of birth for the foreign-born population - Sri Lanka (%)
Place of birth for the foreign-born population - Uzbekistan (%)
Place of birth for the foreign-born population - Other South Central Asia (%)
Place of birth for the foreign-born population - Burma (%)
Place of birth for the foreign-born population - Cambodia (%)
Place of birth for the foreign-born population - Indonesia (%)
Place of birth for the foreign-born population - Laos (%)
Place of birth for the foreign-born population - Malaysia (%)
Place of birth for the foreign-born population - Philippines (%)
Place of birth for the foreign-born population - Singapore (%)
Place of birth for the foreign-born population - Thailand (%)
Place of birth for the foreign-born population - Vietnam (%)
Place of birth for the foreign-born population - Other South Eastern Asia (%)
Place of birth for the foreign-born population - Armenia (%)
Place of birth for the foreign-born population - Iraq (%)
Place of birth for the foreign-born population - Israel (%)
Place of birth for the foreign-born population - Jordan (%)
Place of birth for the foreign-born population - Kuwait (%)
Place of birth for the foreign-born population - Lebanon (%)
Place of birth for the foreign-born population - Saudi Arabia (%)
Place of birth for the foreign-born population - Syria (%)
Place of birth for the foreign-born population - Turkey (%)
Place of birth for the foreign-born population - Yemen (%)
Place of birth for the foreign-born population - Other Western Asia (%)
Place of birth for the foreign-born population - Eritrea (%)
Place of birth for the foreign-born population - Ethiopia (%)
Place of birth for the foreign-born population - Kenya (%)
Place of birth for the foreign-born population - Somalia (%)
Place of birth for the foreign-born population - Uganda (%)
Place of birth for the foreign-born population - Zimbabwe (%)
Place of birth for the foreign-born population - Other Eastern Africa (%)
Place of birth for the foreign-born population - Cameroon (%)
Place of birth for the foreign-born population - Congo (%)
Place of birth for the foreign-born population - Democratic Republic of Congo (Zaire) (%)
Place of birth for the foreign-born population - Other Middle Africa (%)
Place of birth for the foreign-born population - Egypt (%)
Place of birth for the foreign-born population - Morocco (%)
Place of birth for the foreign-born population - Sudan (%)
Place of birth for the foreign-born population - Other Northern Africa (%)
Place of birth for the foreign-born population - South Africa (%)
Place of birth for the foreign-born population - Other Southern Africa (%)
Place of birth for the foreign-born population - Cabo Verde (%)
Place of birth for the foreign-born population - Ghana (%)
Place of birth for the foreign-born population - Liberia (%)
Place of birth for the foreign-born population - Nigeria (%)
Place of birth for the foreign-born population - Senegal (%)
Place of birth for the foreign-born population - Sierra Leone (%)
Place of birth for the foreign-born population - Other Western Africa (%)
Place of birth for the foreign-born population - Australia (%)
Place of birth for the foreign-born population - New Zealand (%)
Place of birth for the foreign-born population - Fiji (%)
Place of birth for the foreign-born population - Micronesia (%)
Place of birth for the foreign-born population - Bahamas (%)
Place of birth for the foreign-born population - Barbados (%)
Place of birth for the foreign-born population - Cuba (%)
Place of birth for the foreign-born population - Dominica (%)
Place of birth for the foreign-born population - Dominican Republic (%)
Place of birth for the foreign-born population - Grenada (%)
Place of birth for the foreign-born population - Haiti (%)
Place of birth for the foreign-born population - Jamaica (%)
Place of birth for the foreign-born population - St. Vincent and the Grenadines (%)
Place of birth for the foreign-born population - Trinidad and Tobago (%)
Place of birth for the foreign-born population - West Indies (%)
Place of birth for the foreign-born population - Other Caribbean (%)
Place of birth for the foreign-born population - Belize (%)
Place of birth for the foreign-born population - Costa Rica (%)
Place of birth for the foreign-born population - El Salvador (%)
Place of birth for the foreign-born population - Guatemala (%)
Place of birth for the foreign-born population - Honduras (%)
Place of birth for the foreign-born population - Mexico (%)
Place of birth for the foreign-born population - Nicaragua (%)
Place of birth for the foreign-born population - Panama (%)
Place of birth for the foreign-born population - Other Central America (%)
Place of birth for the foreign-born population - Argentina (%)
Place of birth for the foreign-born population - Bolivia (%)
Place of birth for the foreign-born population - Brazil (%)
Place of birth for the foreign-born population - Chile (%)
Place of birth for the foreign-born population - Colombia (%)
Place of birth for the foreign-born population - Ecuador (%)
Place of birth for the foreign-born population - Guyana (%)
Place of birth for the foreign-born population - Peru (%)
Place of birth for the foreign-born population - Uruguay (%)
Place of birth for the foreign-born population - Venezuela (%)
Place of birth for the foreign-born population - Other South America (%)
Place of birth for the foreign-born population - Canada (%)
Place of birth for the foreign-born population - Other Northern America (%)
Place of birth for the foreign-born population - Other (%)
Latest news about races in Absecon, NJ collected exclusively by city-data.com from local newspapers, TV, and radio stations
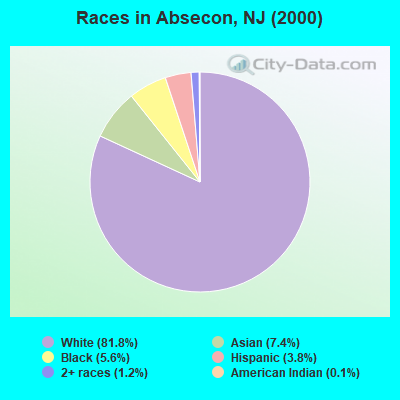
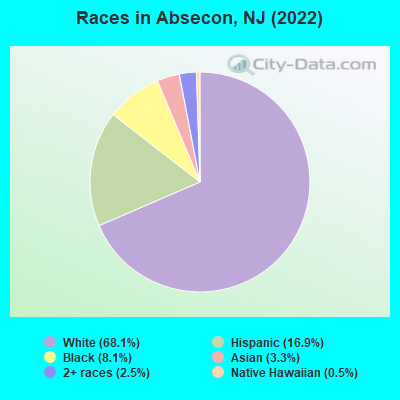
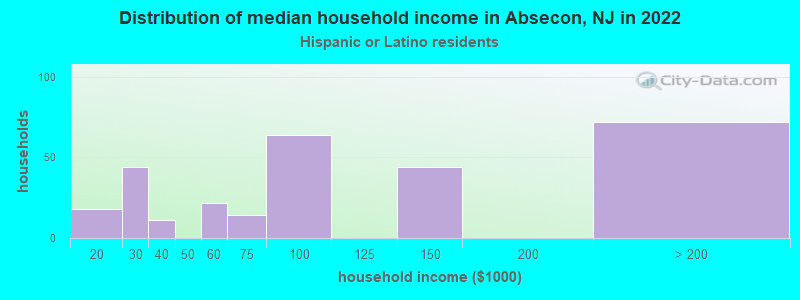
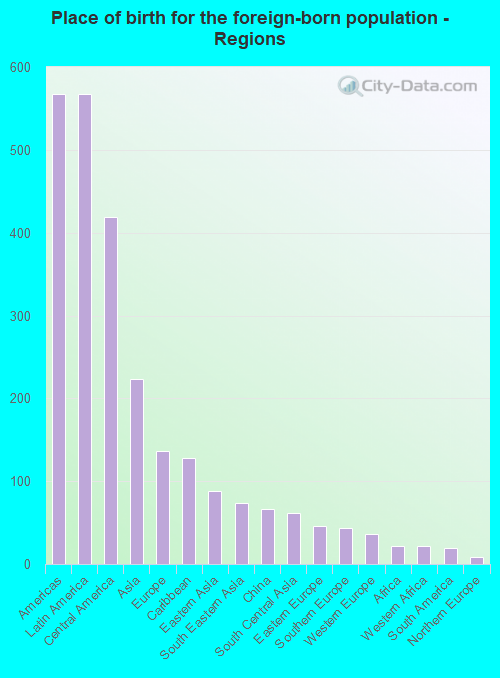
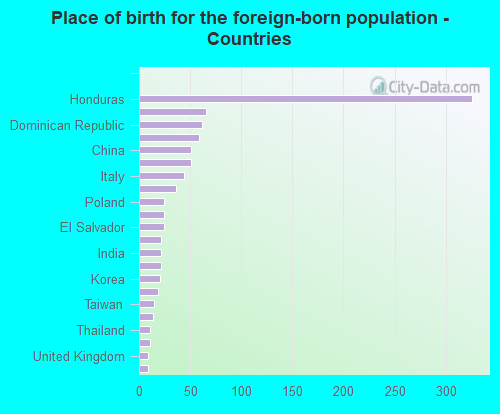
According to 2022 data, the most numerous races in Absecon, NJ are White alone (6,216 residents), Hispanic (1,546 residents), and Black alone (743 residents). 85.2% of Absecon residents speak English at home. 10.4% of Absecon, NJ residents are foreign-born (6.1% born in Latin America, 2.4% born in Asia, 1.5% born in Europe), which is 126.3% less than the foreign-born rate of 23.5% across the entire state of New Jersey.
Race distribution in Absecon
2000 2022
5,557,209 66.0% White alone 1,117,191 13.3% Hispanic 1,096,171 13.0% Black alone 477,012 5.7% Asian alone 133,689 1.6% Two or more races 19,565 0.2% Other race alone 11,338 0.1% American Indian alone 2,175 0.03% Native Hawaiian and Other
4,766,476 51.5% White alone 2,028,470 21.9% Hispanic 1,111,632 12.0% Black alone 923,546 10.0% Asian alone 332,237 3.6% Two or more races 89,847 1.0% Other race alone 8,557 0.09% American Indian alone 934 0.01% Native Hawaiian and Other
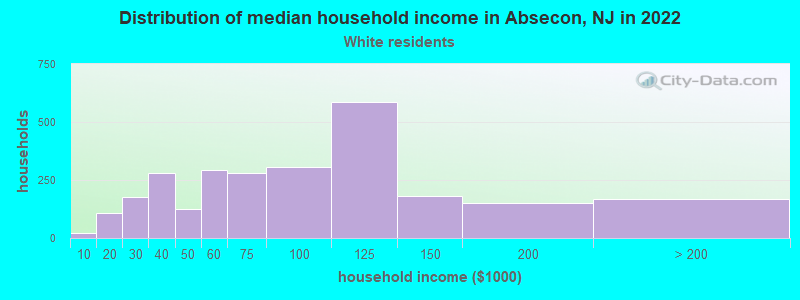
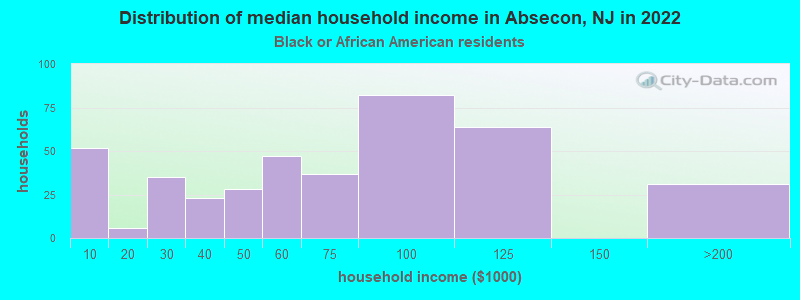
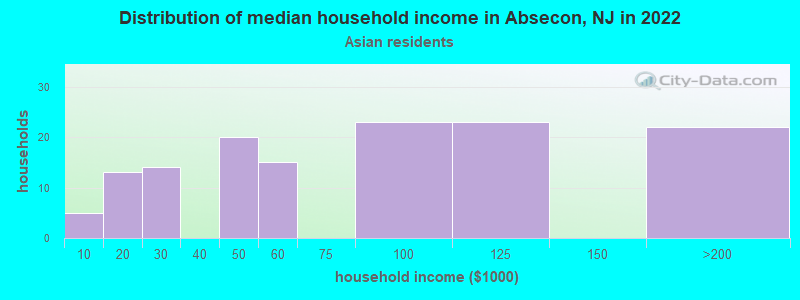
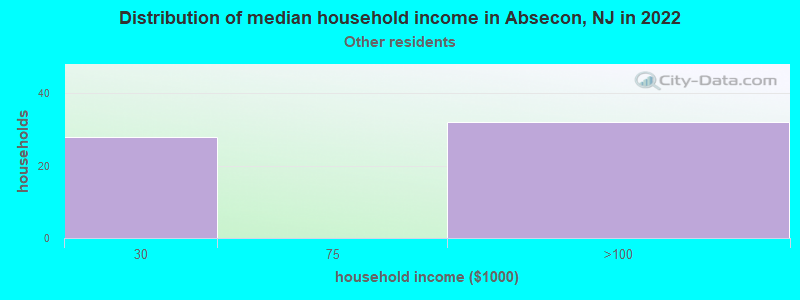
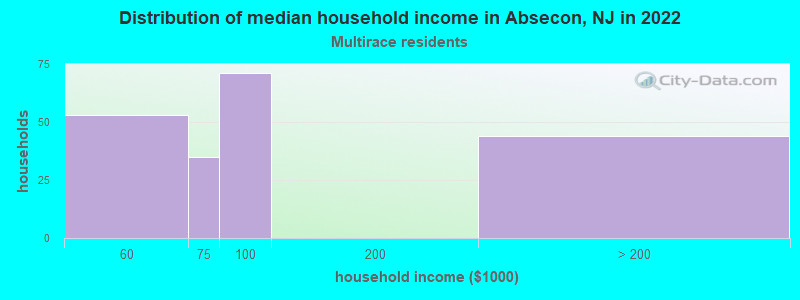
Income and house value in Absecon Median household income in 2022 $75,410 White non-Hispanic householders$67,660 Black householders$79,401 Asian householdersMedian 2022 house value $258,982 White Non-Hispanic householders$214,323 Black or African American householders $272,130 Asian householders$242,705 Some other race householders$186,359 Two or more races householders$243,539 Hispanic or Latino householders
Median age by race in Absecon
39.6 Median age for White residents38.6 40.2 42.3 Median age for Black or African American residents54.2 38.2 20.5 Median age for American Indian / Alaska Native residents-590,299,277.0 -877,192,981.6 50.7 Median age for Asian residents51.8 47.6 51.1 Median age for Native Hawaiian / Pacific Islander residents-860,335,194.7 45.1 24.7 Median age for Other race residents23.6 55.1 32.5 Median age for Two or more races residents29.2 33.7 39.1 Median age for White alone residents38.6 39.3 28.2 Median age for Hispanic or Latino residents26.4 38.4
Owner/renter occupied households by race in Absecon
House owners and renters - White residents 2,149 80.6% Owner occupied516 19.4% Renter occupiedHouse owners and renters - Black or African American residents 150 37.8% Owner occupied247 62.2% Renter occupiedHouse owners and renters - American Indian / Alaska Native residents 18 100.0% Owner occupiedHouse owners and renters - Asian residents 112 93.7% Owner occupied8 6.3% Renter occupiedHouse owners and renters - Native Hawaiian / Pacific Islander residents 13 100.0% Renter occupiedHouse owners and renters - Other race residents 17 24.4% Owner occupied54 75.6% Renter occupiedHouse owners and renters - Two or more races residents 273 100.0% Owner occupiedHouse owners and renters - White alone residents 2,170 81.2% Owner occupied504 18.8% Renter occupiedHouse owners and renters - Hispanic or Latino residents 192 67.0% Owner occupied95 33.0% Renter occupied
Language usage in Absecon
English speakers - Total 85.2% of residents of Absecon speak English at home.
8.3% of residents speak Spanish at home 503 71.7% Speak English very well199 28.3% Speak English less than very well6.6% of residents speak other language at home 374 67.4% Speak English very well181 32.6% Speak English less than very well
English speakers - Born in the United States 96.0% of residents of Absecon speak English at home.
2.2% of residents speak Spanish at home 51 100.0% Speak English very well2.2% of residents speak other language at home 50 100.0% Speak English very well
English speakers - Native, born elsewhere 78.8% of residents of Absecon speak English at home.
13.7% of residents speak Spanish at home 20 100.0% Speak English very well
English speakers - Foreign-born 10.5% of residents of Absecon speak English at home.
47.3% of residents speak Spanish at home 228 55.9% Speak English very well180 44.1% Speak English less than very well33.1% of residents speak other language at home 118 41.3% Speak English very well168 58.7% Speak English less than very well
White (Caucasian) - Speak only English Native:
99.7% (5,495)Foreign-born:
24.4% (26)
White (Caucasian) - Speak another language Native:
1.9% (104)Foreign-born:
76.2% (81)
Black or African American - Speak another language Native:
6.2% (48)Foreign-born:
100.0% (19)
Asian - Speak only English Native:
4.7% (4)Foreign-born:
24.3% (54)
Asian - Speak another language Native:
100.0% (88)Foreign-born:
77.1% (172)
Other race - Speak only English Native:
30.9% (61)Foreign-born:
13.0% (15)
Other race - Speak another language Native:
69.5% (137)Foreign-born:
88.8% (100)
Two or more races - Speak another language Native:
6.0% (53)Foreign-born:
94.7% (322)
White alone - Speak only English Native:
97.6% (5,382)Foreign-born:
19.8% (27)
White alone - Speak another language Native:
2.4% (132)Foreign-born:
81.0% (111)
Hispanic or Latino - Speak only English Native:
88.1% (833)Foreign-born:
3.0% (14)
Hispanic or Latino - Speak another language Native:
24.0% (227)Foreign-born:
96.3% (464)
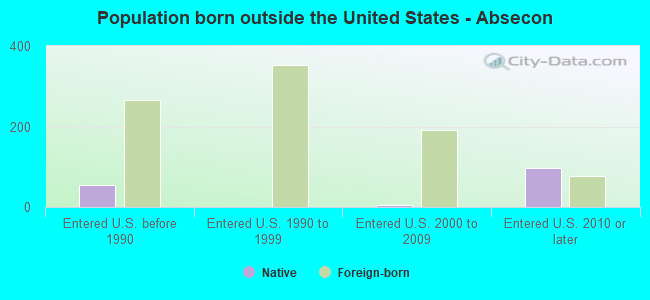
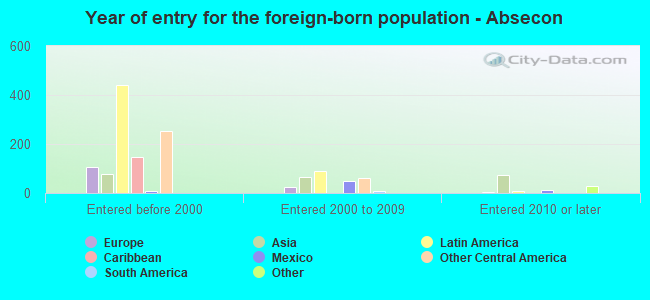
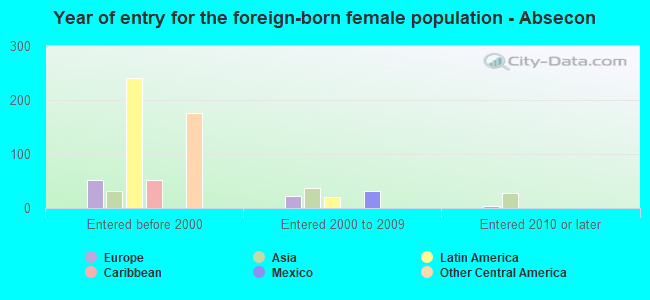
Foreign-born residents in Absecon 950 residents are foreign born (6.1% Latin America , 2.4% Asia , 1.5% Europe ).
This city:
10.4%New Jersey:
23.2%
Marital status for residents in Absecon Marital status - White (Caucasian) population 15 years and over
Males 28.9% Never married56.6% Now married0.9% Separated3.8% Widowed9.8% DivorcedFemales 25.2% Never married53.4% Now married1.1% Separated6.4% Widowed13.9% DivorcedWomen who gave birth in the past 12 months Now married:
94.6% (126)Unmarried:
5.4% (7)
Women who did not give birth in the past 12 months Now married:
49.0% (473)Unmarried:
51.0% (491)
Marital status - Black or African American population 15 years and over
Males 37.2% Never married31.8% Now married18.2% Separated0.0% Widowed12.8% DivorcedFemales 44.7% Never married21.0% Now married0.0% Separated5.1% Widowed29.1% DivorcedWomen who did not give birth in the past 12 months Now married:
31.0% (60)Unmarried:
69.0% (134)
Marital status - American Indian / Alaska Native population 15 years and over
Males 51.9% Never married48.1% Now married0.0% Separated0.0% Widowed0.0% DivorcedFemales 50.0% Never married50.0% Now married0.0% Separated0.0% Widowed0.0% DivorcedWomen who did not give birth in the past 12 months Now married:
50.0% (17)Unmarried:
50.0% (17)
Marital status - Asian population 15 years and over
Males 14.7% Never married72.5% Now married0.0% Separated0.0% Widowed12.8% DivorcedFemales 25.2% Never married74.8% Now married0.0% Separated0.0% Widowed0.0% DivorcedWomen who did not give birth in the past 12 months Now married:
63.5% (50)Unmarried:
36.5% (29)
Marital status - Native Hawaiian / Pacific Islander population 15 years and over
Males 35.3% Never married64.7% Now married0.0% Separated0.0% Widowed0.0% DivorcedFemales 0.0% Never married61.9% Now married0.0% Separated0.0% Widowed38.1% DivorcedWomen who did not give birth in the past 12 months Now married:
100.0% (14)Unmarried:
0.0% (0)
Marital status - Other race population 15 years and over
Males 80.5% Never married19.5% Now married0.0% Separated0.0% Widowed0.0% DivorcedFemales 0.0% Never married30.9% Now married0.0% Separated0.0% Widowed69.1% DivorcedWomen who did not give birth in the past 12 months Now married:
100.0% (11)Unmarried:
0.0% (0)
Marital status - Two or more races population 15 years and over
Males 59.6% Never married35.4% Now married0.0% Separated4.0% Widowed0.9% DivorcedFemales 37.0% Never married60.7% Now married0.0% Separated2.3% Widowed0.0% DivorcedWomen who gave birth in the past 12 months Now married:
0.0% (0)Unmarried:
100.0% (47)
Women who did not give birth in the past 12 months Now married:
0.0% (0)Unmarried:
100.0% (80)
Marital status - White alone, not Hispanic / Latino population 15 years and over
Males 29.2% Never married57.1% Now married0.2% Separated3.9% Widowed9.6% DivorcedFemales 26.1% Never married52.1% Now married1.1% Separated6.0% Widowed14.6% DivorcedWomen who gave birth in the past 12 months Now married:
100.0% (136)Unmarried:
0.0% (0)
Women who did not give birth in the past 12 months Now married:
43.6% (411)Unmarried:
56.4% (531)
Marital status - Hispanic or Latino population 15 years and over
Males 62.5% Never married30.7% Now married2.3% Separated3.1% Widowed1.5% DivorcedFemales 22.9% Never married62.8% Now married0.0% Separated4.3% Widowed10.0% DivorcedWomen who gave birth in the past 12 months Now married:
0.0% (0)Unmarried:
100.0% (8)
Women who did not give birth in the past 12 months Now married:
55.4% (126)Unmarried:
44.6% (102)
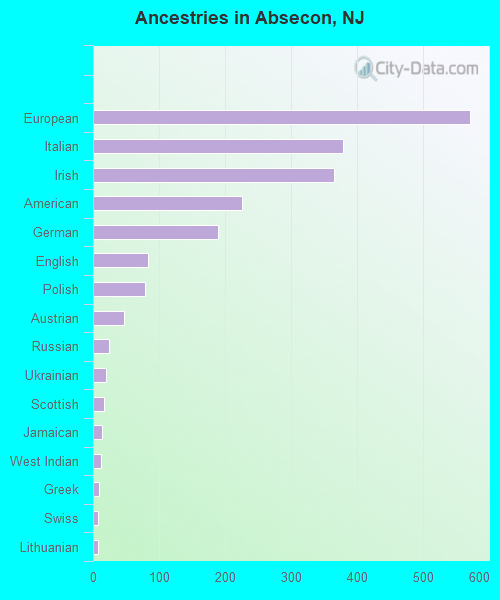
Ancestries in Absecon
572 15.0% European379 9.9% Italian365 9.6% Irish226 5.9% American190 5.0% German83 2.2% English79 2.1% Polish47 1.2% Austrian25 0.7% Russian20 0.5% Ukrainian17 0.4% Scottish14 0.4% Jamaican12 0.3% West Indian9 0.2% Greek8 0.2% Swiss7 0.2% Lithuanian
Children Nativity (place of birth) in Absecon
Children under 6 years - Living with two parents Both parents native 742 100.0% NativeChildren under 6 years - Living with one parent Native parent 81 100.0% NativeChildren 6 to 17 years - Living with two parents Both parents native 633 100.0% NativeBoth parents foreign-born 27 100.0% NativeOne native, one foreign-born parent 34 100.0% NativeChildren 6 to 17 years - Living with one parent Native parent 297 100.0% NativeForeign-born parent 196 50.7% Native191 49.3% Foreign-born
Grandparents responsible for own grandchildren in Absecon
Grandparents (30 to 59 years) White / Caucasian 10 100.0% Not responsible for grandchildrenTwo or more races 54 100.0% Responsible for grandchildrenWhite alone, not Hispanic / Latino 13 100.0% Not responsible for grandchildrenGrandparents (60 years and over) White / Caucasian 107 95.7% Responsible for grandchildren5 4.3% Not responsible for grandchildrenWhite alone, not Hispanic / Latino 122 95.8% Responsible for grandchildren5 4.2% Not responsible for grandchildren