University of La Verne neighborhood in La Verne, California (CA), 91750 detailed profile
Settings
X


Business Search - 14 Million verified businesses
Area: 0.151 square miles
Population: 582
Population density:
| University of La Verne: | 3,858 people per square mile |
| La Verne: | 3,758 people per square mile |

- 29249.7%Hispanic or Latino
- 18832.0%White
- 6811.6%Asian
- 213.6%Black
- 152.6%Two or more races
- 30.5%Some other race
- 10.2%Native Hawaiian and Other
Pacific Islander

Median household income in 2022:
| University of La Verne: | $90,436 |
| La Verne: | $103,816 |
Distribution of median household income
![Distribution of median household income]()
- 4Less than $10,000
- 11$10,000 to $19,999
- 20$20,000 to $29,999
- 22$30,000 to $39,999
- 24$40,000 to $49,999
- 6$50,000 to $59,999
- 15$60,000 to $74,999
- 32$75,000 to $99,999
- 19$100,000 to $124,999
- 19$125,000 to $149,999
- 24$150,000 to $199,999
- 26$200,000 or more

Distribution of owner-occupied house/condo value
![Distribution of owner-occupied house/condo value]()
- 46Less than $50,000
- 30$50,000 to $99,999
- 20$100,000 to $149,999
- 3$150,000 to $199,999
- 4$250,000 to $299,999
- 3$300,000 to $399,999
- 11$400,000 to $499,999
- 62$500,000 to $749,999
- 15$750,000 to $999,999
- 3$1,000,000 or more

Distribution of rent paid by renters
![Distribution of rent paid by renters]()
- 3$200 to $299
- 6$300 to $399
- 2$400 to $499
- 9$600 to $699
- 8$900 to $999
- 4$1,000 to $1,249
- 12$1,250 to $1,499
- 22$1,500 to $1,999
- 26$2,000 or more

Median rent in 2022:
| University of La Verne: | $1,893 |
| La Verne: | $1,872 |
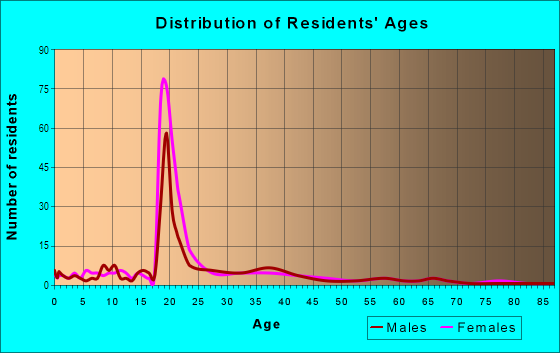
| Males: | 283 |
| Females: | 298 |
Males:
| This neighborhood: | 33.5 years |
| Whole city: | 43.7 years |
| This neighborhood: | 35.9 years |
| Whole city: | 47.7 years |
Average household size:
| University of La Verne: | 3.0 people |
| La Verne: | 2.6 people |
Percentage of family households:
| University of La Verne: | 50.6% |
| La Verne: | 45.1% |
| Here: | 50.1% |
| La Verne: | 53.3% |
Percentage of married-couple families with children (among all households):
| University of La Verne: | 20.1% |
| La Verne: | 26.8% |
Percentage of single-mother households (among all households):
| University of La Verne: | 8.3% |
| La Verne: | 6.8% |
Percentage of never married males 15 years old and over:
Percentage of never married females 15 years old and over:
| University of La Verne: | 17.3% |
| La Verne: | 17.0% |
Percentage of never married females 15 years old and over:
| University of La Verne: | 22.6% |
| city: | 15.4% |
Percentage of people that speak English not well or not at all:
| University of La Verne: | 2.6% |
| La Verne: | 3.8% |
Percentage of people born in this state:
Percentage of people born in another U.S. state:
Percentage of native residents but born outside the U.S.:
Percentage of foreign born residents:
| Here: | 70.3% |
| La Verne: | 66.2% |
Percentage of people born in another U.S. state:
| University of La Verne: | 13.9% |
| La Verne: | 15.8% |
Percentage of native residents but born outside the U.S.:
| Here: | 0.4% |
| city: | 0.9% |
Percentage of foreign born residents:
| Here: | 15.4% |
| La Verne: | 17.0% |

Owner-occupied
Renter-occupied


- Rooms in owner-occupied houses and condos in University of La Verne
- 01 room
- 42 rooms
- 63 rooms
- 124 rooms
- 265 rooms
- 196 rooms
- 237 rooms
- 98 rooms
- 69+ rooms

- Rooms in renter-occupied apartments in University of La Verne
- 131 room
- 112 rooms
- 113 rooms
- 244 rooms
- 105 rooms
- 136 rooms
- 87 rooms
- 08 rooms
- 59+ rooms
Owner-occupied
Renter-occupied

- Bedrooms in owner-occupied houses and condos in University of La Verne
- 0no bedroom
- 121 bedroom
- 212 bedrooms
- 643 bedrooms
- 154 bedrooms
- 195+ bedrooms

- Bedrooms in renter-occupied apartments in University of La Verne
- 13no bedroom
- 81 bedroom
- 322 bedrooms
- 253 bedrooms
- 54 bedrooms
- 05+ bedrooms
Average number of cars or other vehicles available in houses/condos:
Average number of cars or other vehicles available in apartments:
| This neighborhood: | 2.2 |
| La Verne: | 2.2 |
Average number of cars or other vehicles available in apartments:
| Here: | 1.7 |
| city: | 1.6 |
Percentage of units with a mortgage:
| University of La Verne: | 68.8% |
| La Verne: | 64.0% |
Average estimated value of detached houses in 2022 (79.2% of all units):
| University of La Verne: | $694,811 |
| California: | $988,808 |

- Year house built in University of La Verne
- 152020 or later
- 42010 to 2019
- 202000 to 2009
- 161990 to 1999
- 451980 to 1989
- 131970 to 1979
- 121960 to 1969
- 461950 to 1959
- 71940 to 1949
- 351939 or earlier

City-data.com crime index for city in 2020 (higher means more crime):
| City: | 142.5 |
| U.S. average: | 219.5 |
Travel time to work (commute)
![Travel time to work (commute)]()
- 4Less than 5 minutes
- 295 to 9 minutes
- 3410 to 14 minutes
- 2415 to 19 minutes
- 2720 to 24 minutes
- 1225 to 29 minutes
- 2730 to 34 minutes
- 635 to 39 minutes
- 740 to 44 minutes
- 1145 to 59 minutes
- 1560 to 89 minutes
- 590 or more minutes

Means of transportation to work
![Means of transportation to work]()
- 69.2%169Drove a car alone
- 8.6%21Carpooled
- 1.2%3Bus
- 1.2%3Long-distance train or commuter rail
- 2.9%7Taxi
- 1.6%4Motorcycle
- 3.7%9Bicycle
- 5.7%14Walked
- 3.3%8Other means
- 13.9%34Worked at home

Time leaving home to go to work
![Time leaving home to go to work]()
- 1812:00 a.m. to 4:59 a.m.
- 175:00 a.m. to 5:29 a.m.
- 35:30 a.m. to 5:59 a.m.
- 136:00 a.m. to 6:29 a.m.
- 206:30 a.m. to 6:59 a.m.
- 197:00 a.m. to 7:29 a.m.
- 247:30 a.m. to 7:59 a.m.
- 188:00 a.m. to 8:29 a.m.
- 188:30 a.m. to 8:59 a.m.
- 119:00 a.m. to 9:59 a.m.
- 710:00 a.m. to 10:59 a.m.
- 211:00 a.m. to 11:59 a.m.
- 2312:00 p.m. to 3:59 p.m.
- 134:00 p.m. to 11:59 p.m.

Occupations of males:
- Percentage of males in management occupations (except farmers):
Here: 7.3% city: 16.8%
- Percentage of males in business and financial operations occupations:
Here: 6.5% city: 7.1%
- Percentage of males in computer and mathematical occupations:
Here: 3.4% city: 3.4%
- Percentage of males in architecture and engineering occupations:
Here: 4.8% city: 3.5%
- Percentage of males in community and social services occupations:
Here: 3.9% city: 1.2%
- Percentage of males in education, training, and library occupations:
Here: 3.1% city: 3.4%
- Percentage of males in arts, design, entertainment, sports, and media occupations:
Here: 6.1% city: 4.6%
- Percentage of males in healthcare practitioners and technical occupations:
Here: 2.7% city: 2.0%
- Percentage of males in service occupations:
Here: 23.8% city: 14.5%
- Percentage of males in sales and office occupations:
Here: 11.3% city: 18.8%
- Percentage of males in construction, extraction, and maintenance occupations:
Here: 2.8% city: 4.1%
- Percentage of males in production occupations:
Here: 9.9% city: 5.1%
- Percentage of males in transportation occupations:
Here: 2.2% city: 2.9%
- Percentage of males in material moving occupations:
Here: 6.0% city: 4.7%
Occupations of females:
- Percentage of females in management occupations (except farmers):
Here: 12.0% city: 7.8%
- Percentage of females in business and financial operations occupations:
Here: 3.0% city: 10.6%
- Percentage of females in computer and mathematical occupations:
Here: 3.9% city: 3.4%
- Percentage of females in community and social services occupations:
Here: 4.9% city: 2.8%
- Percentage of females in education, training, and library occupations:
Here: 11.0% city: 14.6%
- Percentage of females in healthcare practitioners and technical occupations:
Here: 6.7% city: 8.2%
- Percentage of females in service occupations:
Here: 24.9% city: 15.4%
- Percentage of females in sales and office occupations:
Here: 23.9% city: 28.5%
- Percentage of females in material moving occupations:
Here: 8.5% city: 4.0%
Education in this neighborhood (subdivision or community):
- Percentage of people 3 years and older in K-12 schools:
University of La Verne: 16.7% La Verne: 15.7%
- Percentage of people 3 years and older in undergraduate colleges:
University of La Verne: 15.6% La Verne: 6.9%
- Percentage of people 3 years and older in grad. or professional schools:
University of La Verne: 2.5% La Verne: 2.3%
- Percentage of students K-12 enrolled in private schools:
University of La Verne: 66.0% La Verne: 13.5%
Percentage of population below poverty level:
| University of La Verne: | 12.5% |
| La Verne: | 8.5% |
Median year owner moved in (as recorded in 2022):
Median year renter moved in (as recorded in 2022):
| University of La Verne: | 2005 |
| La Verne: | 2005 |
Median year renter moved in (as recorded in 2022):
| University of La Verne: | 2015 |
| La Verne: | 2015 |
Percentage of married-couple families with both working:
| University of La Verne: | 81.2% |
| La Verne: | 74.5% |

- 83.8%Utility gas
- 11.4%Electricity
- 1.9%Solar energy
- 1.9%No fuel used
- 1.1%Bottled, tank, or LP gas
Roads and streets:
1st St
Length: 0.40 miles
Directions: E-W, N-S, SE-NW
Address range: 1900 to 2152
Directions: E-W, N-S, SE-NW
Address range: 1900 to 2152
D St
Length: 0.38 miles
Directions: N-S, SW-NE
Address range: 1900 to 2451
Directions: N-S, SW-NE
Address range: 1900 to 2451
B St
Length: 0.32 miles
Direction: N-S
Address range: 1900 to 2451
Direction: N-S
Address range: 1900 to 2451
3rd St
Length: 0.29 miles
Direction: E-W
Address range: 1900 to 2099
Direction: E-W
Address range: 1900 to 2099
Arrow Hwy
Length: 0.29 miles
Direction: E-W
Address range: 1900 to 2099
Direction: E-W
Address range: 1900 to 2099
Bonita Ave
Length: 0.29 miles
Direction: E-W
Address range: 1900 to 2099
Direction: E-W
Address range: 1900 to 2099
Walnut St
Length: 0.29 miles
Direction: E-W
Address range: 1900 to 2099
Direction: E-W
Address range: 1900 to 2099
C St
Length: 0.25 miles
Directions: E-W, N-S
Address range: 1900 to 2447
Directions: E-W, N-S
Address range: 1900 to 2447
2nd St
Length: 0.13 miles
Direction: E-W
Address range: 2000 to 2099
Direction: E-W
Address range: 2000 to 2099
Railroad features:
at and Sf Rlwy
Length: 0.29 miles
Direction: E-W
Direction: E-W
Other features:
Live Oak Wash
Length: 0.38 miles
Directions: N-S, SW-NE
Directions: N-S, SW-NE