Suburban Farms neighborhood in Urbandale, Iowa (IA), 50311, 50322 detailed profile
Settings
X


Business Search - 14 Million verified businesses
Area: 0.232 square miles
Population: 1,633
Population density:
| Suburban Farms: | 7,025 people per square mile |
| Urbandale: | 2,203 people per square mile |

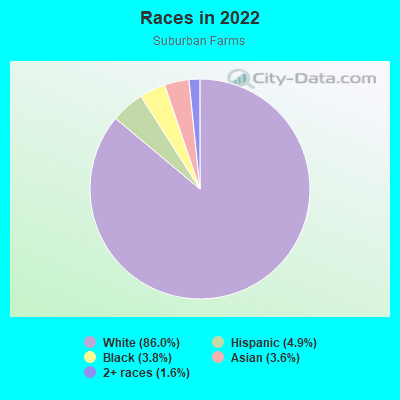
- 1,45686.0%White
- 834.9%Hispanic or Latino
- 653.8%Black
- 613.6%Asian
- 271.6%Two or more races
- 10.06%American Indian
Median household income in 2022:
| Suburban Farms: | $73,685 |
| Urbandale: | $111,888 |
Distribution of median household income
![Distribution of median household income]()
- 12Less than $10,000
- 78$10,000 to $19,999
- 96$20,000 to $29,999
- 138$30,000 to $39,999
- 53$40,000 to $49,999
- 34$50,000 to $59,999
- 14$60,000 to $74,999
- 117$75,000 to $99,999
- 125$100,000 to $124,999
- 106$125,000 to $149,999
- 39$150,000 to $199,999
- 9$200,000 or more

Distribution of owner-occupied house/condo value
![Distribution of owner-occupied house/condo value]()
- 31Less than $50,000
- 40$50,000 to $99,999
- 57$100,000 to $149,999
- 134$150,000 to $199,999
- 44$200,000 to $249,999
- 122$250,000 to $299,999
- 97$300,000 to $399,999
- 10$400,000 to $499,999
- 4$500,000 to $749,999

Distribution of rent paid by renters
![Distribution of rent paid by renters]()
- 31$500 to $599
- 66$600 to $699
- 129$700 to $799
- 87$800 to $899
- 12$900 to $999
- 62$1,000 to $1,249
- 67$1,250 to $1,499
- 61$1,500 to $1,999
- 2$2,000 or more

Median rent in 2022:
| Suburban Farms: | $891 |
| Urbandale: | $971 |
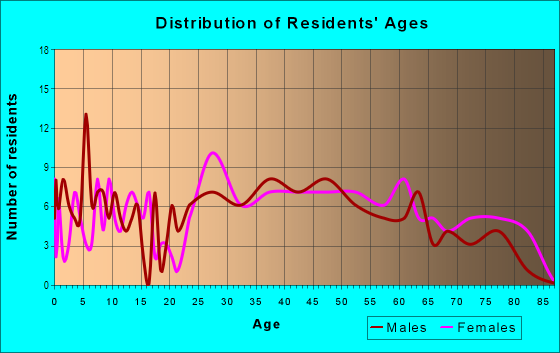
| Males: | 897 |
| Females: | 735 |
Males:
| This neighborhood: | 33.2 years |
| Whole city: | 38.2 years |
| This neighborhood: | 35.7 years |
| Whole city: | 39.6 years |
Average household size:
| Suburban Farms: | 2.6 people |
| Urbandale: | 2.6 people |
Percentage of family households:
| Suburban Farms: | 49.5% |
| Urbandale: | 57.0% |
| Here: | 50.0% |
| Urbandale: | 60.5% |
Percentage of married-couple families with children (among all households):
| Suburban Farms: | 19.4% |
| Urbandale: | 31.4% |
Percentage of single-mother households (among all households):
| Suburban Farms: | 0.7% |
| Urbandale: | 4.6% |
Percentage of never married males 15 years old and over:
Percentage of never married females 15 years old and over:
| Suburban Farms: | 19.6% |
| Urbandale: | 14.6% |
Percentage of never married females 15 years old and over:
| Suburban Farms: | 11.8% |
| city: | 12.0% |
Percentage of people that speak English not well or not at all:
| Suburban Farms: | 1.1% |
| Urbandale: | 1.8% |
Percentage of people born in this state:
Percentage of people born in another U.S. state:
Percentage of native residents but born outside the U.S.:
Percentage of foreign born residents:
| Here: | 71.5% |
| Urbandale: | 66.9% |
Percentage of people born in another U.S. state:
| Suburban Farms: | 15.2% |
| Urbandale: | 23.1% |
Percentage of native residents but born outside the U.S.:
| Here: | 1.3% |
| city: | 0.7% |
Percentage of foreign born residents:
| Here: | 12.1% |
| Urbandale: | 9.3% |
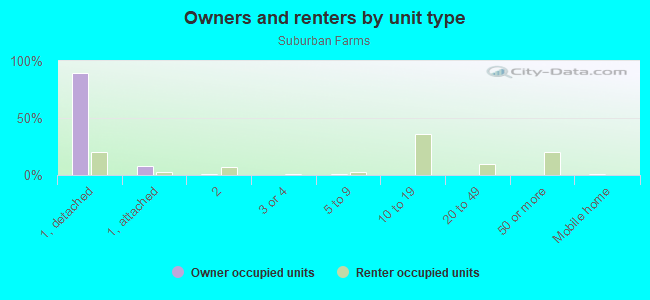
Owner-occupied
Renter-occupied

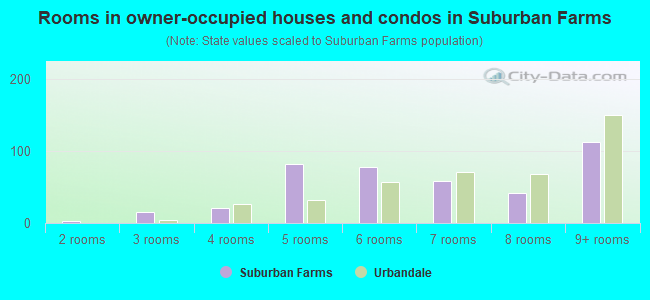
- Rooms in owner-occupied houses and condos in Suburban Farms
- 01 room
- 32 rooms
- 153 rooms
- 214 rooms
- 825 rooms
- 786 rooms
- 587 rooms
- 418 rooms
- 1129+ rooms
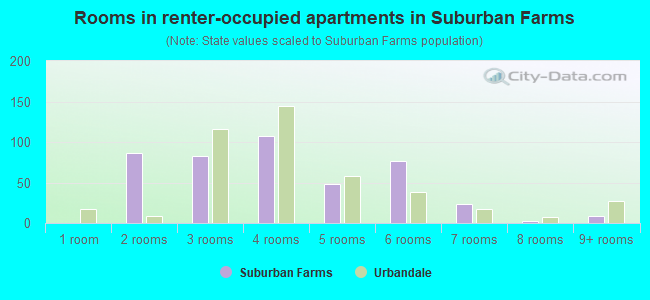
- Rooms in renter-occupied apartments in Suburban Farms
- 01 room
- 862 rooms
- 833 rooms
- 1074 rooms
- 485 rooms
- 766 rooms
- 237 rooms
- 28 rooms
- 99+ rooms
Owner-occupied
Renter-occupied
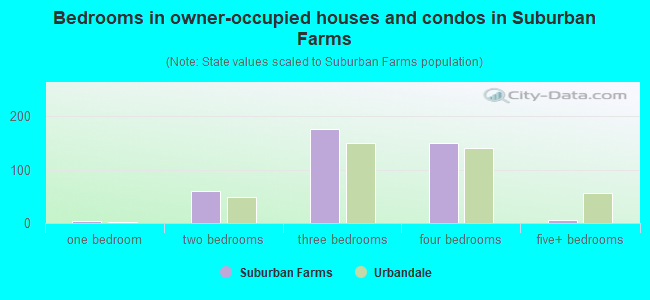
- Bedrooms in owner-occupied houses and condos in Suburban Farms
- 0no bedroom
- 41 bedroom
- 602 bedrooms
- 1763 bedrooms
- 1504 bedrooms
- 65+ bedrooms
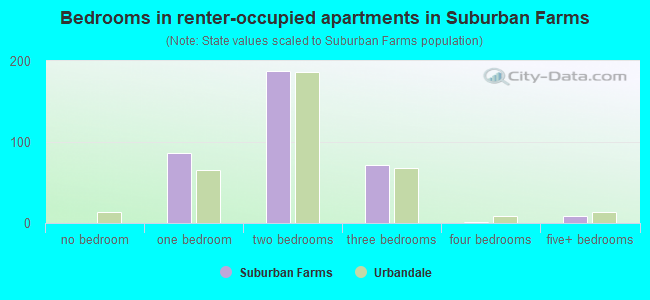
- Bedrooms in renter-occupied apartments in Suburban Farms
- 0no bedroom
- 861 bedroom
- 1882 bedrooms
- 713 bedrooms
- 14 bedrooms
- 95+ bedrooms
Average number of cars or other vehicles available in houses/condos:
Average number of cars or other vehicles available in apartments:
| This neighborhood: | 2.0 |
| Urbandale: | 2.2 |
Average number of cars or other vehicles available in apartments:
| Here: | 1.7 |
| city: | 1.6 |
Percentage of units with a mortgage:
| Suburban Farms: | 66.5% |
| Urbandale: | 68.3% |
Average estimated value of detached houses in 2022 (82.2% of all units):
| Suburban Farms: | $209,867 |
| Urbandale: | $370,534 |
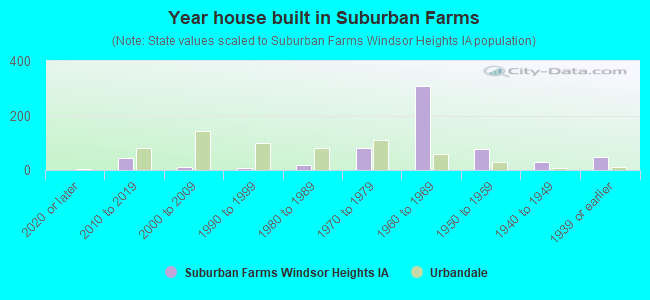
- Year house built in Suburban Farms
- 02020 or later
- 432010 to 2019
- 122000 to 2009
- 91990 to 1999
- 171980 to 1989
- 791970 to 1979
- 3091960 to 1969
- 781950 to 1959
- 301940 to 1949
- 471939 or earlier
City-data.com crime index for city in 2020 (higher means more crime):
| City: | 86.9 |
| U.S. average: | 219.5 |
Travel time to work (commute)
![Travel time to work (commute)]()
- 14Less than 5 minutes
- 575 to 9 minutes
- 10410 to 14 minutes
- 18315 to 19 minutes
- 5820 to 24 minutes
- 1825 to 29 minutes
- 2430 to 34 minutes
- 835 to 39 minutes
- 540 to 44 minutes
- 1645 to 59 minutes
- 1660 to 89 minutes
- 1190 or more minutes

Means of transportation to work
![Means of transportation to work]()
- 65.7%520Drove a car alone
- 11.4%90Carpooled
- 1.1%9Walked
- 6.1%48Other means
- 16.7%132Worked at home

Time leaving home to go to work
![Time leaving home to go to work]()
- 1912:00 a.m. to 4:59 a.m.
- 45:00 a.m. to 5:29 a.m.
- 315:30 a.m. to 5:59 a.m.
- 416:00 a.m. to 6:29 a.m.
- 706:30 a.m. to 6:59 a.m.
- 587:00 a.m. to 7:29 a.m.
- 717:30 a.m. to 7:59 a.m.
- 838:00 a.m. to 8:29 a.m.
- 408:30 a.m. to 8:59 a.m.
- 149:00 a.m. to 9:59 a.m.
- 510:00 a.m. to 10:59 a.m.
- 1111:00 a.m. to 11:59 a.m.
- 3512:00 p.m. to 3:59 p.m.
- 84:00 p.m. to 11:59 p.m.

Occupations of males:
- Percentage of males in management occupations (except farmers):
Here: 13.2% city: 15.7%
- Percentage of males in business and financial operations occupations:
Here: 3.4% city: 11.2%
- Percentage of males in computer and mathematical occupations:
Here: 6.8% city: 8.8%
- Percentage of males in architecture and engineering occupations:
Here: 7.4% city: 2.6%
- Percentage of males in life, physical, and social science occupations:
Here: 1.0% city: 2.1%
- Percentage of males in legal occupations:
Here: 2.4% city: 2.3%
- Percentage of males in education, training, and library occupations:
Here: 9.6% city: 3.1%
- Percentage of males in arts, design, entertainment, sports, and media occupations:
Here: 11.0% city: 1.1%
- Percentage of males in healthcare practitioners and technical occupations:
Here: 3.0% city: 2.7%
- Percentage of males in sales and office occupations:
Here: 11.4% city: 18.5%
- Percentage of males in production occupations:
Here: 9.2% city: 4.3%
- Percentage of males in material moving occupations:
Here: 5.6% city: 4.1%
Occupations of females:
- Percentage of females in management occupations (except farmers):
Here: 3.7% city: 11.9%
- Percentage of females in business and financial operations occupations:
Here: 25.1% city: 11.8%
- Percentage of females in computer and mathematical occupations:
Here: 5.0% city: 2.3%
- Percentage of females in education, training, and library occupations:
Here: 2.6% city: 9.7%
- Percentage of females in healthcare practitioners and technical occupations:
Here: 4.3% city: 10.0%
- Percentage of females in service occupations:
Here: 37.3% city: 15.1%
- Percentage of females in sales and office occupations:
Here: 18.8% city: 26.7%
- Percentage of females in production occupations:
Here: 8.3% city: 1.0%
- Percentage of females in transportation occupations:
Here: 1.5% city: 1.5%
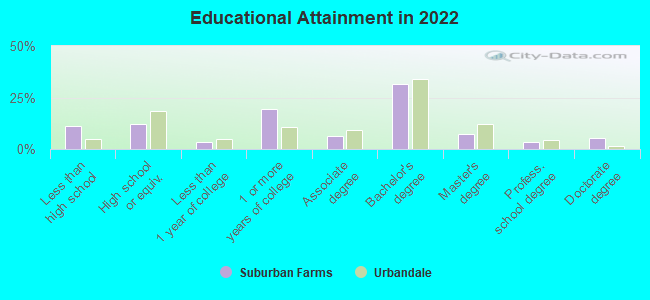
Education in this neighborhood (subdivision or community):
- Percentage of people 3 years and older in K-12 schools:
Suburban Farms: 22.8% Urbandale: 20.1%
- Percentage of people 3 years and older in undergraduate colleges:
Suburban Farms: 2.8% Urbandale: 3.1%
- Percentage of people 3 years and older in grad. or professional schools:
Suburban Farms: 0.8% Urbandale: 1.2%
- Percentage of students K-12 enrolled in private schools:
Suburban Farms: 42.7% Urbandale: 11.6%
Percentage of population below poverty level:
| Suburban Farms: | 7.6% |
| Urbandale: | 5.5% |
Median year owner moved in (as recorded in 2022):
Median year renter moved in (as recorded in 2022):
| Suburban Farms: | 2007 |
| Urbandale: | 2010 |
Median year renter moved in (as recorded in 2022):
| Suburban Farms: | 2018 |
| Urbandale: | 2018 |
Percentage of married-couple families with both working:
| Suburban Farms: | 103.5% |
| Urbandale: | 83.2% |
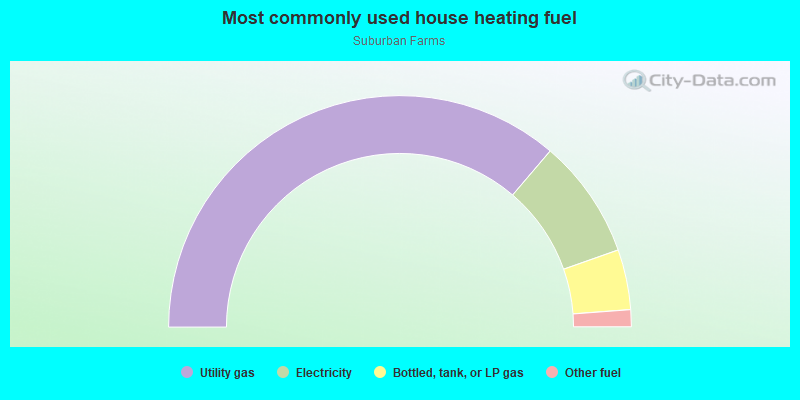
- 72.5%Utility gas
- 16.7%Electricity
- 8.4%Bottled, tank, or LP gas
- 2.4%Other fuel
Highways in this neighborhood:
63rd St (State Hwy 28)
Length: 0.47 miles
Direction: N-S
Address range: 1600 to 2267
Direction: N-S
Address range: 1600 to 2267
US Hwy 6 (Hickman Rd)
Length: 0.11 miles
Direction: E-W
Address range: 6800 to 6898
Direction: E-W
Address range: 6800 to 6898
Roads and streets:
Washington Ave
Length: 0.55 miles
Direction: E-W
Address range: 6300 to 6899
Direction: E-W
Address range: 6300 to 6899
Northwest Dr
Length: 0.48 miles
Directions: E-W, N-S, SW-NE
Address range: 6400 to 6899
Directions: E-W, N-S, SW-NE
Address range: 6400 to 6899
69th St
Length: 0.38 miles
Directions: N-S, SW-NE
Address range: 1700 to 2299
Directions: N-S, SW-NE
Address range: 1700 to 2299
Franklin Ave
Length: 0.37 miles
Direction: E-W
Address range: 6201 to 6599
Direction: E-W
Address range: 6201 to 6599
Lincoln Ave
Length: 0.33 miles
Direction: E-W
Address range: 6400 to 6799
Direction: E-W
Address range: 6400 to 6799
68th St
Length: 0.25 miles
Directions: E-W, N-S
Address range: 1801 to 2299
Directions: E-W, N-S
Address range: 1801 to 2299
Allison Ave
Length: 0.24 miles
Direction: E-W
Address range: 6400 to 6599
Direction: E-W
Address range: 6400 to 6599
64th St
Length: 0.23 miles
Directions: N-S, SW-NE
Address range: 1800 to 2199
Directions: N-S, SW-NE
Address range: 1800 to 2199
62nd St
Length: 0.14 miles
Direction: N-S
Address range: 1900 to 2103
Direction: N-S
Address range: 1900 to 2103
Timmons Dr
Length: 0.13 miles
Direction: E-W
Address range: 6800 to 6899
Direction: E-W
Address range: 6800 to 6899
66th St
Length: 0.12 miles
Direction: N-S
Address range: 1900 to 2099
Direction: N-S
Address range: 1900 to 2099
Rocklyn Dr
Length: 0.01 miles
Direction: N-S
Direction: N-S