Southeast Rohnert Park (Southeast) neighborhood in Rohnert Park, California (CA), 94951, 94928 detailed profile
Settings
X


Business Search - 14 Million verified businesses
Area: 0.781 square miles
Population: 1,716
Population density:
| Southeast Rohnert Park (Southeast): | 2,198 people per square mile |
| Rohnert Park: | 6,910 people per square mile |

- 94246.4%White
- 31515.5%Hispanic or Latino
- 28213.9%Asian
- 1628.0%Some other race
- 1356.7%Two or more races
- 1256.2%Native Hawaiian and Other
Pacific Islander - 653.2%Black
- 40.2%American Indian

Median household income in 2022:
| Southeast Rohnert Park (Southeast): | $106,335 |
| Rohnert Park: | $93,322 |
Distribution of median household income
![Distribution of median household income]()
- 23Less than $10,000
- 67$10,000 to $19,999
- 17$20,000 to $29,999
- 16$30,000 to $39,999
- 79$40,000 to $49,999
- 111$50,000 to $59,999
- 72$60,000 to $74,999
- 154$75,000 to $99,999
- 19$100,000 to $124,999
- 82$125,000 to $149,999
- 107$150,000 to $199,999
- 52$200,000 or more

Distribution of owner-occupied house/condo value
![Distribution of owner-occupied house/condo value]()
- 2Less than $50,000
- 24$50,000 to $99,999
- 11$150,000 to $199,999
- 28$250,000 to $299,999
- 17$300,000 to $399,999
- 42$400,000 to $499,999
- 202$500,000 to $749,999
- 35$750,000 to $999,999
- 42$1,000,000 or more

Distribution of rent paid by renters
![Distribution of rent paid by renters]()
- 2Less than $100
- 40$200 to $299
- 59$600 to $699
- 1$900 to $999
- 1$1,000 to $1,249
- 137$1,250 to $1,499
- 61$1,500 to $1,999
- 248$2,000 or more

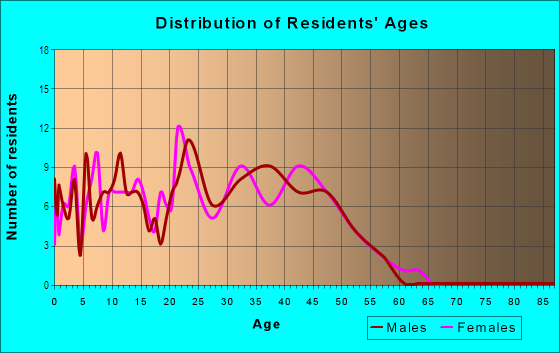
| Males: | 869 |
| Females: | 846 |
Males:
| This neighborhood: | 44.5 years |
| Whole city: | 35.9 years |
| This neighborhood: | 34.7 years |
| Whole city: | 34.5 years |
Average household size:
| Southeast Rohnert Park (Southeast): | 2.6 people |
| Rohnert Park: | 2.6 people |
Percentage of family households:
| Southeast Rohnert Park (Southeast): | 47.3% |
| Rohnert Park: | 43.9% |
| Here: | 34.1% |
| Rohnert Park: | 43.1% |
Percentage of married-couple families with children (among all households):
| Southeast Rohnert Park (Southeast): | 12.4% |
| Rohnert Park: | 24.7% |
Percentage of single-mother households (among all households):
| Southeast Rohnert Park (Southeast): | 17.9% |
| Rohnert Park: | 10.3% |
Percentage of never married males 15 years old and over:
Percentage of never married females 15 years old and over:
| Southeast Rohnert Park (Southeast): | 29.1% |
| Rohnert Park: | 20.3% |
Percentage of never married females 15 years old and over:
| Southeast Rohnert Park (Southeast): | 27.0% |
| city: | 21.1% |
Percentage of people that speak English not well or not at all:
| Southeast Rohnert Park (Southeast): | 0.3% |
| Rohnert Park: | 3.7% |
Percentage of people born in this state:
Percentage of people born in another U.S. state:
Percentage of native residents but born outside the U.S.:
Percentage of foreign born residents:
| Here: | 71.9% |
| Rohnert Park: | 65.7% |
Percentage of people born in another U.S. state:
| Southeast Rohnert Park (Southeast): | 16.9% |
| Rohnert Park: | 18.6% |
Percentage of native residents but born outside the U.S.:
| Here: | 0.9% |
| city: | 1.1% |
Percentage of foreign born residents:
| Here: | 10.3% |
| Rohnert Park: | 14.5% |

Owner-occupied
Renter-occupied


- Rooms in owner-occupied houses and condos in Southeast Rohnert Park <
> - 01 room
- 02 rooms
- 133 rooms
- 524 rooms
- 1095 rooms
- 616 rooms
- 357 rooms
- 88 rooms
- 389+ rooms

- Rooms in renter-occupied apartments in Southeast Rohnert Park <
> - 321 room
- 692 rooms
- 1723 rooms
- 264 rooms
- 1035 rooms
- 406 rooms
- 387 rooms
- 558 rooms
- 719+ rooms
Owner-occupied
Renter-occupied

- Bedrooms in owner-occupied houses and condos in Southeast Rohnert Park <
> - 10no bedroom
- 121 bedroom
- 242 bedrooms
- 2163 bedrooms
- 494 bedrooms
- 75+ bedrooms

- Bedrooms in renter-occupied apartments in Southeast Rohnert Park <
> - 32no bedroom
- 2111 bedroom
- 382 bedrooms
- 1163 bedrooms
- 234 bedrooms
- 555+ bedrooms
Average number of cars or other vehicles available in houses/condos:
Average number of cars or other vehicles available in apartments:
| This neighborhood: | 2.3 |
| Rohnert Park: | 2.3 |
Average number of cars or other vehicles available in apartments:
| Here: | 2.9 |
| city: | 1.9 |
Percentage of units with a mortgage:
| Southeast Rohnert Park (Southeast): | 80.2% |
| Rohnert Park: | 69.0% |
Average estimated value of detached houses in 2022 (74.1% of all units):
| Southeast Rohnert Park (Southeast): | $707,214 |
| Rohnert Park: | $718,881 |

- Year house built in Southeast Rohnert Park <
> - 22020 or later
- 142010 to 2019
- 312000 to 2009
- 1521990 to 1999
- 2491980 to 1989
- 1601970 to 1979
- 201960 to 1969
- 171950 to 1959
- 41940 to 1949
- 181939 or earlier

City-data.com crime index for city in 2020 (higher means more crime):
| City: | 266.5 |
| U.S. average: | 219.5 |
Travel time to work (commute)
![Travel time to work (commute)]()
- 48Less than 5 minutes
- 285 to 9 minutes
- 14010 to 14 minutes
- 8515 to 19 minutes
- 10020 to 24 minutes
- 8125 to 29 minutes
- 7730 to 34 minutes
- 2935 to 39 minutes
- 2240 to 44 minutes
- 3945 to 59 minutes
- 3760 to 89 minutes
- 4190 or more minutes

Means of transportation to work
![Means of transportation to work]()
- 68.8%666Drove a car alone
- 9.3%90Carpooled
- 2.1%20Bus
- 4.0%39Subway or elevated rail
- 0.3%3Long-distance train or commuter rail
- 2.2%21Motorcycle
- 24.2%234Bicycle
- 9.4%91Walked
- 6.8%66Other means
- 5.3%51Worked at home

Time leaving home to go to work
![Time leaving home to go to work]()
- 3412:00 a.m. to 4:59 a.m.
- 65:00 a.m. to 5:29 a.m.
- 305:30 a.m. to 5:59 a.m.
- 716:00 a.m. to 6:29 a.m.
- 336:30 a.m. to 6:59 a.m.
- 767:00 a.m. to 7:29 a.m.
- 557:30 a.m. to 7:59 a.m.
- 1098:00 a.m. to 8:29 a.m.
- 268:30 a.m. to 8:59 a.m.
- 499:00 a.m. to 9:59 a.m.
- 3410:00 a.m. to 10:59 a.m.
- 4011:00 a.m. to 11:59 a.m.
- 8812:00 p.m. to 3:59 p.m.
- 674:00 p.m. to 11:59 p.m.

Occupations of males:
- Percentage of males in management occupations (except farmers):
Here: 8.2% city: 10.9%
- Percentage of males in computer and mathematical occupations:
Here: 3.5% city: 4.9%
- Percentage of males in architecture and engineering occupations:
Here: 4.8% city: 2.7%
- Percentage of males in arts, design, entertainment, sports, and media occupations:
Here: 2.3% city: 1.7%
- Percentage of males in service occupations:
Here: 49.4% city: 20.6%
- Percentage of males in sales and office occupations:
Here: 12.2% city: 16.7%
- Percentage of males in construction, extraction, and maintenance occupations:
Here: 12.7% city: 15.5%
- Percentage of males in transportation occupations:
Here: 3.8% city: 4.0%
Occupations of females:
- Percentage of females in management occupations (except farmers):
Here: 1.8% city: 7.5%
- Percentage of females in business and financial operations occupations:
Here: 5.9% city: 5.5%
- Percentage of females in community and social services occupations:
Here: 5.0% city: 3.6%
- Percentage of females in education, training, and library occupations:
Here: 8.7% city: 9.5%
- Percentage of females in healthcare practitioners and technical occupations:
Here: 22.5% city: 8.1%
- Percentage of females in service occupations:
Here: 14.8% city: 24.0%
- Percentage of females in sales and office occupations:
Here: 36.3% city: 30.9%
- Percentage of females in production occupations:
Here: 2.8% city: 2.3%
Education in this neighborhood (subdivision or community):
- Percentage of people 3 years and older in K-12 schools:
Southeast Rohnert Park (Southeast): 19.6% Rohnert Park: 15.1%
- Percentage of people 3 years and older in undergraduate colleges:
Southeast Rohnert Park (Southeast): 25.7% Rohnert Park: 10.5%
- Percentage of people 3 years and older in grad. or professional schools:
Southeast Rohnert Park (Southeast): 1.3% Rohnert Park: 0.9%
- Percentage of students K-12 enrolled in private schools:
Southeast Rohnert Park (Southeast): 21.4% Rohnert Park: 4.1%
Percentage of population below poverty level:
| Southeast Rohnert Park (Southeast): | 7.1% |
| Rohnert Park: | 9.7% |
Median year owner moved in (as recorded in 2022):
Median year renter moved in (as recorded in 2022):
| Southeast Rohnert Park (Southeast): | 2004 |
| Rohnert Park: | 2008 |
Median year renter moved in (as recorded in 2022):
| Southeast Rohnert Park (Southeast): | 2016 |
| Rohnert Park: | 2017 |
Percentage of married-couple families with both working:
| Southeast Rohnert Park (Southeast): | 68.3% |
| Rohnert Park: | 74.9% |

- 54.1%Utility gas
- 20.4%Electricity
- 8.0%Wood
- 6.0%Bottled, tank, or LP gas
- 5.9%Other fuel
- 2.9%Solar energy
- 1.5%Fuel oil, kerosene, etc.
- 1.1%No fuel used
Roads and streets:
Valley House Dr
Length: 2.62 miles
Directions: E-W, N-S, SE-NW, SW-NE
Address range: 1200 to 1298
Directions: E-W, N-S, SE-NW, SW-NE
Address range: 1200 to 1298
E Railroad Ave
Length: 1.00 miles
Direction: E-W
Address range: 600 to 1298
Direction: E-W
Address range: 600 to 1298
Cam Colegio
Length: 0.97 miles
Direction: E-W
Direction: E-W
Bodway Pkwy
Length: 0.55 miles
Direction: N-S
Direction: N-S
Petaluma Hill Rd
Length: 0.50 miles
Direction: N-S
Address range: 7531 to 7999
Direction: N-S
Address range: 7531 to 7999
Manchester Ave
Length: 0.11 miles
Direction: N-S
Direction: N-S
Railroad features:
Northwestern Pacific RR
Length: 0.83 miles
Direction: SE-NW
Direction: SE-NW