South Gardens neighborhood in Chattanooga, Tennessee (TN), 37408 detailed profile
Settings
X


Business Search - 14 Million verified businesses
Area: 0.252 square miles
Population: 670
Population density:
| South Gardens: | 2,662 people per square mile |
| Chattanooga: | 1,361 people per square mile |

- 40059.9%White
- 22533.7%Black
- 213.1%Hispanic or Latino
- 182.7%Asian
- 40.6%Two or more races

Median household income in 2022:
| South Gardens: | $91,667 |
| Chattanooga: | $64,340 |
Distribution of median household income
![Distribution of median household income]()
- 3Less than $10,000
- 18$10,000 to $19,999
- 31$20,000 to $29,999
- 21$30,000 to $39,999
- 19$40,000 to $49,999
- 13$50,000 to $59,999
- 18$60,000 to $74,999
- 25$75,000 to $99,999
- 14$100,000 to $124,999
- 33$125,000 to $149,999
- 31$150,000 to $199,999
- 53$200,000 or more

Distribution of owner-occupied house/condo value
![Distribution of owner-occupied house/condo value]()
- 1$50,000 to $99,999
- 3$100,000 to $149,999
- 20$150,000 to $199,999
- 6$200,000 to $249,999
- 21$250,000 to $299,999
- 16$300,000 to $399,999
- 41$400,000 to $499,999
- 21$500,000 to $749,999
- 11$1,000,000 or more

Distribution of rent paid by renters
![Distribution of rent paid by renters]()
- 2$100 to $199
- 24$200 to $299
- 5$300 to $399
- 6$400 to $499
- 5$500 to $599
- 1$600 to $699
- 10$700 to $799
- 3$800 to $899
- 15$900 to $999
- 11$1,000 to $1,249
- 28$1,250 to $1,499
- 31$1,500 to $1,999
- 29$2,000 or more

Median rent in 2022:
| South Gardens: | $1,418 |
| Chattanooga: | $1,009 |
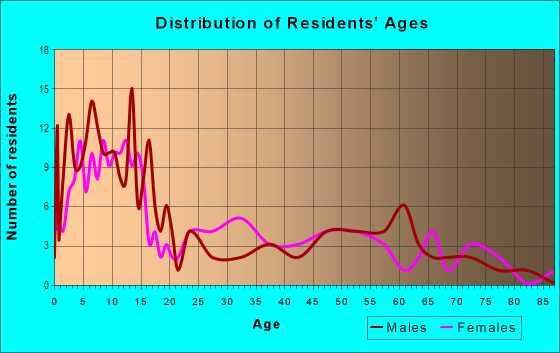
| Males: | 297 |
| Females: | 373 |
Males:
| This neighborhood: | 33.5 years |
| Whole city: | 35.0 years |
| This neighborhood: | 28.4 years |
| Whole city: | 37.5 years |
Average household size:
| South Gardens: | 2.5 people |
| Chattanooga: | 2.3 people |
Percentage of family households:
| South Gardens: | 38.7% |
| Chattanooga: | 38.2% |
| Here: | 35.9% |
| Chattanooga: | 38.8% |
Percentage of married-couple families with children (among all households):
| South Gardens: | 32.8% |
| Chattanooga: | 26.7% |
Percentage of single-mother households (among all households):
| South Gardens: | 5.9% |
| Chattanooga: | 13.0% |
Percentage of never married males 15 years old and over:
Percentage of never married females 15 years old and over:
| South Gardens: | 16.4% |
| Chattanooga: | 19.0% |
Percentage of never married females 15 years old and over:
| South Gardens: | 25.8% |
| city: | 17.6% |
Percentage of people that speak English not well or not at all:
| South Gardens: | 2.7% |
| Chattanooga: | 2.8% |
Percentage of people born in this state:
Percentage of people born in another U.S. state:
Percentage of native residents but born outside the U.S.:
Percentage of foreign born residents:
| Here: | 50.7% |
| Chattanooga: | 54.4% |
Percentage of people born in another U.S. state:
| South Gardens: | 40.7% |
| Chattanooga: | 37.8% |
Percentage of native residents but born outside the U.S.:
| Here: | 3.0% |
| city: | 0.8% |
Percentage of foreign born residents:
| Here: | 5.7% |
| Chattanooga: | 6.9% |

Owner-occupied
Renter-occupied


- Rooms in owner-occupied houses and condos in South Gardens
- 01 room
- 12 rooms
- 123 rooms
- 404 rooms
- 375 rooms
- 216 rooms
- 87 rooms
- 48 rooms
- 69+ rooms

- Rooms in renter-occupied apartments in South Gardens
- 41 room
- 192 rooms
- 493 rooms
- 344 rooms
- 125 rooms
- 166 rooms
- 17 rooms
- 08 rooms
- 09+ rooms
Owner-occupied
Renter-occupied

- Bedrooms in owner-occupied houses and condos in South Gardens
- 0no bedroom
- 141 bedroom
- 362 bedrooms
- 613 bedrooms
- 184 bedrooms
- 25+ bedrooms

- Bedrooms in renter-occupied apartments in South Gardens
- 4no bedroom
- 381 bedroom
- 642 bedrooms
- 243 bedrooms
- 64 bedrooms
- 05+ bedrooms
Average number of cars or other vehicles available in houses/condos:
Average number of cars or other vehicles available in apartments:
| This neighborhood: | 1.8 |
| Chattanooga: | 2.1 |
Average number of cars or other vehicles available in apartments:
| Here: | 1.4 |
| city: | 1.3 |
Percentage of units with a mortgage:
| South Gardens: | 65.0% |
| Chattanooga: | 57.5% |

- Year house built in South Gardens
- 02020 or later
- 1512010 to 2019
- 1232000 to 2009
- 361990 to 1999
- 21980 to 1989
- 101970 to 1979
- 51960 to 1969
- 51950 to 1959
- 21940 to 1949
- 251939 or earlier

City-data.com crime index for city in 2020 (higher means more crime):
| City: | 696.9 |
| U.S. average: | 219.5 |
Travel time to work (commute)
![Travel time to work (commute)]()
- 12Less than 5 minutes
- 335 to 9 minutes
- 4010 to 14 minutes
- 3015 to 19 minutes
- 2520 to 24 minutes
- 1125 to 29 minutes
- 1830 to 34 minutes
- 140 to 44 minutes
- 845 to 59 minutes
- 160 to 89 minutes
- 190 or more minutes

Means of transportation to work
![Means of transportation to work]()
- 72.6%257Drove a car alone
- 2.5%9Carpooled
- 1.1%4Bus
- 0.6%2Bicycle
- 4.8%17Walked
- 18.1%64Worked at home

Time leaving home to go to work
![Time leaving home to go to work]()
- 812:00 a.m. to 4:59 a.m.
- 15:30 a.m. to 5:59 a.m.
- 116:00 a.m. to 6:29 a.m.
- 316:30 a.m. to 6:59 a.m.
- 197:00 a.m. to 7:29 a.m.
- 227:30 a.m. to 7:59 a.m.
- 298:00 a.m. to 8:29 a.m.
- 178:30 a.m. to 8:59 a.m.
- 149:00 a.m. to 9:59 a.m.
- 510:00 a.m. to 10:59 a.m.
- 211:00 a.m. to 11:59 a.m.
- 112:00 p.m. to 3:59 p.m.
- 134:00 p.m. to 11:59 p.m.

Occupations of males:
- Percentage of males in management occupations (except farmers):
Here: 23.9% city: 10.9%
- Percentage of males in business and financial operations occupations:
Here: 11.5% city: 5.8%
- Percentage of males in computer and mathematical occupations:
Here: 2.9% city: 3.6%
- Percentage of males in architecture and engineering occupations:
Here: 5.7% city: 3.4%
- Percentage of males in community and social services occupations:
Here: 1.8% city: 1.6%
- Percentage of males in legal occupations:
Here: 4.9% city: 1.4%
- Percentage of males in education, training, and library occupations:
Here: 1.6% city: 3.2%
- Percentage of males in healthcare practitioners and technical occupations:
Here: 2.3% city: 3.8%
- Percentage of males in service occupations:
Here: 19.2% city: 15.6%
- Percentage of males in sales and office occupations:
Here: 14.5% city: 15.6%
- Percentage of males in production occupations:
Here: 3.9% city: 9.6%
- Percentage of males in transportation occupations:
Here: 5.9% city: 5.4%
Occupations of females:
- Percentage of females in management occupations (except farmers):
Here: 18.6% city: 8.1%
- Percentage of females in business and financial operations occupations:
Here: 4.3% city: 6.7%
- Percentage of females in computer and mathematical occupations:
Here: 4.9% city: 1.0%
- Percentage of females in architecture and engineering occupations:
Here: 3.1% city: 0.7%
- Percentage of females in community and social services occupations:
Here: 4.1% city: 4.0%
- Percentage of females in legal occupations:
Here: 3.1% city: 0.7%
- Percentage of females in education, training, and library occupations:
Here: 1.4% city: 7.6%
- Percentage of females in arts, design, entertainment, sports, and media occupations:
Here: 4.7% city: 2.6%
- Percentage of females in healthcare practitioners and technical occupations:
Here: 23.6% city: 11.4%
- Percentage of females in service occupations:
Here: 19.3% city: 21.6%
- Percentage of females in sales and office occupations:
Here: 11.5% city: 25.1%
Education in this neighborhood (subdivision or community):
- Percentage of people 3 years and older in K-12 schools:
South Gardens: 16.9% Chattanooga: 14.8%
- Percentage of people 3 years and older in undergraduate colleges:
South Gardens: 2.8% Chattanooga: 6.2%
- Percentage of people 3 years and older in grad. or professional schools:
South Gardens: 7.0% Chattanooga: 0.9%
- Percentage of students K-12 enrolled in private schools:
South Gardens: 25.7% Chattanooga: 15.8%
Percentage of population below poverty level:
| South Gardens: | 12.9% |
| Chattanooga: | 15.3% |
Median year owner moved in (as recorded in 2022):
Median year renter moved in (as recorded in 2022):
| South Gardens: | 2014 |
| Chattanooga: | 2012 |
Median year renter moved in (as recorded in 2022):
| South Gardens: | 2020 |
| Chattanooga: | 2021 |
Percentage of married-couple families with both working:
| South Gardens: | 63.3% |
| Chattanooga: | 77.2% |

- 89.7%Electricity
- 8.7%Utility gas
- 1.6%Bottled, tank, or LP gas
Highways in this neighborhood:
State Hwy 58 (S Market St)
Length: 0.45 miles
Directions: N-S, SW-NE
Address range: 2400 to 2699
Directions: N-S, SW-NE
Address range: 2400 to 2699
State Hwy 2 (US Hwy 41/72, State Hwy 17, US Hwy 11/64, Broad St)
Length: 0.38 miles
Directions: N-S, SW-NE
Address range: 2401 to 2699
Directions: N-S, SW-NE
Address range: 2401 to 2699
Roads and streets:
W 26th St
Length: 0.41 miles
Directions: E-W, N-S, SE-NW, SW-NE
Address range: 1 to 399
Directions: E-W, N-S, SE-NW, SW-NE
Address range: 1 to 399
W 25th St
Length: 0.38 miles
Direction: E-W
Address range: 1 to 399
Direction: E-W
Address range: 1 to 399
Cowart St
Length: 0.35 miles
Direction: SW-NE
Address range: 2400 to 2799
Direction: SW-NE
Address range: 2400 to 2799
E 25th Street Pl
Length: 0.30 miles
Direction: E-W
Address range: 1 to 299
Direction: E-W
Address range: 1 to 299
W 27th St
Length: 0.29 miles
Direction: E-W
Address range: 1 to 399
Direction: E-W
Address range: 1 to 399
Long St
Length: 0.29 miles
Direction: SW-NE
Address range: 2420 to 2699
Direction: SW-NE
Address range: 2420 to 2699
Carr St
Length: 0.27 miles
Direction: SW-NE
Address range: 2400 to 2699
Direction: SW-NE
Address range: 2400 to 2699
Williams St
Length: 0.25 miles
Direction: SW-NE
Address range: 2400 to 2699
Direction: SW-NE
Address range: 2400 to 2699
Poss Dr
Length: 0.24 miles
Directions: E-W, N-S, SE-NW
Address range: 100 to 299
Directions: E-W, N-S, SE-NW
Address range: 100 to 299
Read Ave
Length: 0.07 miles
Direction: SW-NE
Address range: 2400 to 2499
Direction: SW-NE
Address range: 2400 to 2499
Baldwin St
Length: 0.06 miles
Direction: SW-NE
Address range: 2400 to 2499
Direction: SW-NE
Address range: 2400 to 2499
Washington St
Length: 0.06 miles
Direction: SW-NE
Address range: 2400 to 2499
Direction: SW-NE
Address range: 2400 to 2499