Silvercrest neighborhood in Winter Haven, Florida (FL), 33881 detailed profile
Settings
X


Business Search - 14 Million verified businesses
Area: 0.113 square miles
Population: 325
Population density:
| Silvercrest: | 2,871 people per square mile |
| Winter Haven: | 2,872 people per square mile |

- 20460.4%White
- 6418.9%Hispanic or Latino
- 4814.2%Black
- 92.7%Two or more races
- 82.4%Asian
- 51.5%Some other race

Median household income in 2022:
| Silvercrest: | $64,604 |
| Winter Haven: | $56,425 |
Distribution of median household income
![Distribution of median household income]()
- 3Less than $10,000
- 43$10,000 to $19,999
- 13$20,000 to $29,999
- 10$30,000 to $39,999
- 15$40,000 to $49,999
- 5$50,000 to $59,999
- 19$60,000 to $74,999
- 20$75,000 to $99,999
- 11$100,000 to $124,999
- 4$125,000 to $149,999
- 13$150,000 to $199,999
- 3$200,000 or more

Distribution of owner-occupied house/condo value
![Distribution of owner-occupied house/condo value]()
- 11Less than $50,000
- 8$50,000 to $99,999
- 14$100,000 to $149,999
- 18$150,000 to $199,999
- 29$200,000 to $249,999
- 4$250,000 to $299,999
- 25$300,000 to $399,999
- 3$400,000 to $499,999
- 1$500,000 to $749,999

Distribution of rent paid by renters
![Distribution of rent paid by renters]()
- 5$200 to $299
- 18$300 to $399
- 31$400 to $499
- 5$500 to $599
- 5$600 to $699
- 36$700 to $799
- 21$800 to $899
- 2$900 to $999
- 12$1,000 to $1,249
- 4$1,250 to $1,499
- 5$1,500 to $1,999
- 6$2,000 or more

Median rent in 2022:
| Silvercrest: | $1,190 |
| Winter Haven: | $900 |
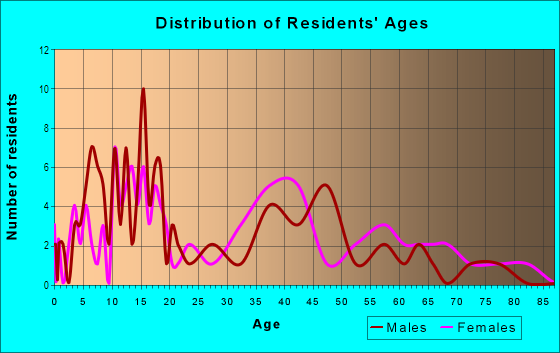
| Males: | 154 |
| Females: | 170 |
Males:
| This neighborhood: | 35.1 years |
| Whole city: | 37.9 years |
| This neighborhood: | 45.4 years |
| Whole city: | 43.2 years |
Average household size:
| Silvercrest: | 3.0 people |
| Winter Haven: | 2.7 people |
Percentage of family households:
| Silvercrest: | 56.2% |
| Winter Haven: | 42.5% |
| Here: | 49.3% |
| Winter Haven: | 44.1% |
Percentage of married-couple families with children (among all households):
| Silvercrest: | 22.5% |
| Winter Haven: | 23.1% |
Percentage of single-mother households (among all households):
| Silvercrest: | 3.7% |
| Winter Haven: | 11.3% |
Percentage of never married males 15 years old and over:
Percentage of never married females 15 years old and over:
| Silvercrest: | 15.4% |
| Winter Haven: | 16.7% |
Percentage of never married females 15 years old and over:
| Silvercrest: | 11.1% |
| city: | 14.6% |
Percentage of people that speak English not well or not at all:
| Silvercrest: | 0.7% |
| Winter Haven: | 4.6% |
Percentage of people born in this state:
Percentage of people born in another U.S. state:
Percentage of native residents but born outside the U.S.:
Percentage of foreign born residents:
| Here: | 45.6% |
| Winter Haven: | 42.3% |
Percentage of people born in another U.S. state:
| Silvercrest: | 41.2% |
| Winter Haven: | 40.4% |
Percentage of native residents but born outside the U.S.:
| Here: | 3.1% |
| city: | 8.3% |
Percentage of foreign born residents:
| Here: | 10.1% |
| Winter Haven: | 9.0% |

Owner-occupied
Renter-occupied


- Rooms in owner-occupied houses and condos in Silvercrest
- 01 room
- 12 rooms
- 03 rooms
- 34 rooms
- 125 rooms
- 386 rooms
- 217 rooms
- 198 rooms
- 39+ rooms

- Rooms in renter-occupied apartments in Silvercrest
- 11 room
- 52 rooms
- 63 rooms
- 124 rooms
- 35 rooms
- 76 rooms
- 127 rooms
- 38 rooms
- 49+ rooms
Owner-occupied
Renter-occupied

- Bedrooms in owner-occupied houses and condos in Silvercrest
- 0no bedroom
- 11 bedroom
- 152 bedrooms
- 193 bedrooms
- 474 bedrooms
- 15+ bedrooms

- Bedrooms in renter-occupied apartments in Silvercrest
- 1no bedroom
- 31 bedroom
- 122 bedrooms
- 43 bedrooms
- 44 bedrooms
- 35+ bedrooms
Average number of cars or other vehicles available in houses/condos:
Average number of cars or other vehicles available in apartments:
| This neighborhood: | 2.4 |
| Winter Haven: | 1.8 |
Average number of cars or other vehicles available in apartments:
| Here: | 1.3 |
| city: | 1.2 |
Percentage of units with a mortgage:
| Silvercrest: | 56.9% |
| Winter Haven: | 59.8% |
Average estimated value of detached houses in 2022 (66.4% of all units):
| Silvercrest: | $176,094 |
| Florida: | $500,941 |

- Year house built in Silvercrest
- 02020 or later
- 302010 to 2019
- 372000 to 2009
- 91990 to 1999
- 131980 to 1989
- 171970 to 1979
- 391960 to 1969
- 81950 to 1959
- 121940 to 1949
- 121939 or earlier

City-data.com crime index for city in 2020 (higher means more crime):
| City: | 210.5 |
| U.S. average: | 219.5 |
Travel time to work (commute)
![Travel time to work (commute)]()
- 2Less than 5 minutes
- 225 to 9 minutes
- 2310 to 14 minutes
- 1515 to 19 minutes
- 2020 to 24 minutes
- 325 to 29 minutes
- 730 to 34 minutes
- 935 to 39 minutes
- 140 to 44 minutes
- 1545 to 59 minutes
- 760 to 89 minutes
- 1590 or more minutes

Means of transportation to work
![Means of transportation to work]()
- 79.8%119Drove a car alone
- 11.4%17Carpooled
- 2.0%3Walked
- 5.4%8Other means
- 8.7%13Worked at home

Time leaving home to go to work
![Time leaving home to go to work]()
- 1112:00 a.m. to 4:59 a.m.
- 95:00 a.m. to 5:29 a.m.
- 25:30 a.m. to 5:59 a.m.
- 156:00 a.m. to 6:29 a.m.
- 56:30 a.m. to 6:59 a.m.
- 187:00 a.m. to 7:29 a.m.
- 277:30 a.m. to 7:59 a.m.
- 128:00 a.m. to 8:29 a.m.
- 48:30 a.m. to 8:59 a.m.
- 149:00 a.m. to 9:59 a.m.
- 410:00 a.m. to 10:59 a.m.
- 111:00 a.m. to 11:59 a.m.
- 2212:00 p.m. to 3:59 p.m.
- 104:00 p.m. to 11:59 p.m.

Occupations of males:
- Percentage of males in management occupations (except farmers):
Here: 9.2% city: 8.0%
- Percentage of males in business and financial operations occupations:
Here: 10.7% city: 3.3%
- Percentage of males in computer and mathematical occupations:
Here: 17.5% city: 3.0%
- Percentage of males in architecture and engineering occupations:
Here: 1.3% city: 0.5%
- Percentage of males in community and social services occupations:
Here: 2.6% city: 0.7%
- Percentage of males in education, training, and library occupations:
Here: 3.7% city: 2.3%
- Percentage of males in healthcare practitioners and technical occupations:
Here: 2.8% city: 2.8%
- Percentage of males in service occupations:
Here: 29.1% city: 19.3%
- Percentage of males in sales and office occupations:
Here: 11.0% city: 14.4%
- Percentage of males in construction, extraction, and maintenance occupations:
Here: 1.1% city: 8.6%
- Percentage of males in production occupations:
Here: 1.3% city: 7.0%
- Percentage of males in transportation occupations:
Here: 4.2% city: 8.1%
Occupations of females:
- Percentage of females in management occupations (except farmers):
Here: 18.2% city: 8.6%
- Percentage of females in business and financial operations occupations:
Here: 2.1% city: 5.1%
- Percentage of females in community and social services occupations:
Here: 8.5% city: 3.8%
- Percentage of females in education, training, and library occupations:
Here: 14.8% city: 10.3%
- Percentage of females in arts, design, entertainment, sports, and media occupations:
Here: 1.9% city: 0.9%
- Percentage of females in healthcare practitioners and technical occupations:
Here: 11.6% city: 8.9%
- Percentage of females in service occupations:
Here: 41.1% city: 21.2%
- Percentage of females in sales and office occupations:
Here: 4.5% city: 31.5%
- Percentage of females in production occupations:
Here: 1.9% city: 3.3%
- Percentage of females in transportation occupations:
Here: 9.8% city: 0.8%
Education in this neighborhood (subdivision or community):
- Percentage of people 3 years and older in K-12 schools:
Silvercrest: 21.5% Winter Haven: 15.3%
- Percentage of people 3 years and older in undergraduate colleges:
Silvercrest: 6.3% Winter Haven: 3.1%
- Percentage of people 3 years and older in grad. or professional schools:
Silvercrest: 1.7% Winter Haven: 0.9%
- Percentage of students K-12 enrolled in private schools:
Silvercrest: 40.0% Winter Haven: 14.3%
Percentage of population below poverty level:
| Silvercrest: | 18.3% |
| Winter Haven: | 15.9% |
Median year owner moved in (as recorded in 2022):
Median year renter moved in (as recorded in 2022):
| Silvercrest: | 2017 |
| Winter Haven: | 2012 |
Median year renter moved in (as recorded in 2022):
| Silvercrest: | 2018 |
| Winter Haven: | 2017 |
Percentage of married-couple families with both working:
| Silvercrest: | 71.0% |
| Winter Haven: | 67.7% |

- 87.5%Electricity
- 6.1%Utility gas
- 3.3%No fuel used
- 2.2%Fuel oil, kerosene, etc.
- 0.9%Bottled, tank, or LP gas
Roads and streets:
E Lake Martha Dr (Ave K NE)
Length: 0.40 miles
Direction: E-W
Address range: 100 to 598
Direction: E-W
Address range: 100 to 598
5th St NE
Length: 0.27 miles
Directions: N-S, SW-NE
Address range: 1100 to 1499
Directions: N-S, SW-NE
Address range: 1100 to 1499
W Lake Martha Dr NE
Length: 0.21 miles
Direction: SW-NE
Address range: 1000 to 1199
Direction: SW-NE
Address range: 1000 to 1199
Ave N NE
Length: 0.15 miles
Direction: E-W
Address range: 400 to 499
Direction: E-W
Address range: 400 to 499
Ave M NE
Length: 0.14 miles
Direction: E-W
Address range: 400 to 499
Direction: E-W
Address range: 400 to 499
Lake Silver Dr (State Hwy 549, E Lake Silver Dr NE)
Length: 0.12 miles
Directions: N-S, SW-NE
Address range: 1000 to 1198
Directions: N-S, SW-NE
Address range: 1000 to 1198
4th St NE
Length: 0.12 miles
Direction: N-S
Address range: 1300 to 1399
Direction: N-S
Address range: 1300 to 1399
Ave J NE
Length: 0.12 miles
Direction: E-W
Address range: 200 to 299
Direction: E-W
Address range: 200 to 299
Ave I NE
Length: 0.08 miles
Direction: E-W
Direction: E-W
Lake Martha Dr
Length: 0.05 miles
Direction: N-S
Direction: N-S
E Lake Martha Dr
Length: 0.02 miles
Direction: SE-NW
Direction: SE-NW
Fairfax St NE
Length: 0.02 miles
Direction: E-W
Address range: 1100 to 1121
Direction: E-W
Address range: 1100 to 1121