Saint Paul neighborhood in Baltimore, Maryland (MD), 21230 detailed profile
Settings
X


Business Search - 14 Million verified businesses
Area: 0.116 square miles
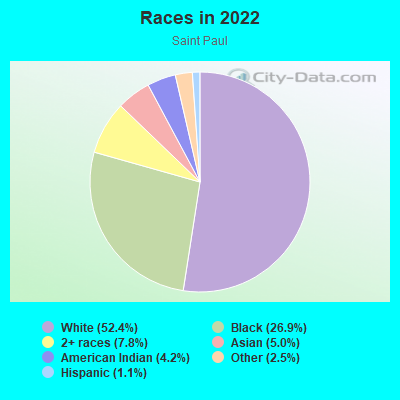
Population: 315
Population density:
| Saint Paul: | 2,715 people per square mile |
| Baltimore: | 7,053 people per square mile |

- 18752.4%White
- 9626.9%Black
- 287.8%Two or more races
- 185.0%Asian
- 154.2%American Indian
- 92.5%Some other race
- 41.1%Hispanic or Latino
Median household income in 2022:
| Saint Paul: | $43,497 |
| Baltimore: | $55,198 |
Distribution of median household income
![Distribution of median household income]()
- 26Less than $10,000
- 29$10,000 to $19,999
- 24$20,000 to $29,999
- 37$30,000 to $39,999
- 6$40,000 to $49,999
- 26$50,000 to $59,999
- 17$60,000 to $74,999
- 11$75,000 to $99,999
- 11$100,000 to $124,999
- 21$125,000 to $149,999
- 8$150,000 to $199,999
- 18$200,000 or more

Distribution of owner-occupied house/condo value
![Distribution of owner-occupied house/condo value]()
- 3Less than $50,000
- 55$50,000 to $99,999
- 9$100,000 to $149,999
- 20$150,000 to $199,999
- 5$200,000 to $249,999
- 10$250,000 to $299,999
- 18$300,000 to $399,999
- 3$400,000 to $499,999
- 2$500,000 to $749,999
- 1$1,000,000 or more

Distribution of rent paid by renters
![Distribution of rent paid by renters]()
- 24$100 to $199
- 2$200 to $299
- 4$300 to $399
- 25$400 to $499
- 9$500 to $599
- 6$600 to $699
- 2$700 to $799
- 12$800 to $899
- 4$900 to $999
- 23$1,000 to $1,249
- 14$1,250 to $1,499
- 4$1,500 to $1,999
- 4$2,000 or more

Median rent in 2022:
| Saint Paul: | $1,132 |
| Baltimore: | $1,043 |
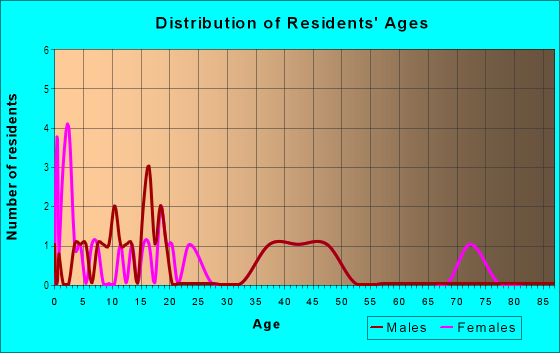
| Males: | 122 |
| Females: | 193 |
Males:
| This neighborhood: | 37.4 years |
| Whole city: | 35.0 years |
| This neighborhood: | 35.7 years |
| Whole city: | 38.2 years |
Average household size:
| Saint Paul: | 2.5 people |
| Baltimore: | 2.2 people |
Percentage of family households:
| Saint Paul: | 65.0% |
| Baltimore: | 34.2% |
| Here: | 46.3% |
| Baltimore: | 23.3% |
Percentage of married-couple families with children (among all households):
| Saint Paul: | 23.6% |
| Baltimore: | 22.4% |
Percentage of single-mother households (among all households):
| Saint Paul: | 10.9% |
| Baltimore: | 18.7% |
Percentage of never married males 15 years old and over:
Percentage of never married females 15 years old and over:
| Saint Paul: | 16.3% |
| Baltimore: | 25.1% |
Percentage of never married females 15 years old and over:
| Saint Paul: | 22.5% |
| city: | 27.5% |
Percentage of people that speak English not well or not at all:
| Saint Paul: | 0.4% |
| Baltimore: | 2.3% |
Percentage of people born in this state:
Percentage of people born in another U.S. state:
Percentage of native residents but born outside the U.S.:
Percentage of foreign born residents:
| Here: | 83.2% |
| Baltimore: | 64.4% |
Percentage of people born in another U.S. state:
| Saint Paul: | 11.2% |
| Baltimore: | 25.0% |
Percentage of native residents but born outside the U.S.:
| Here: | 2.3% |
| city: | 0.9% |
Percentage of foreign born residents:
| Here: | 3.4% |
| Baltimore: | 9.7% |
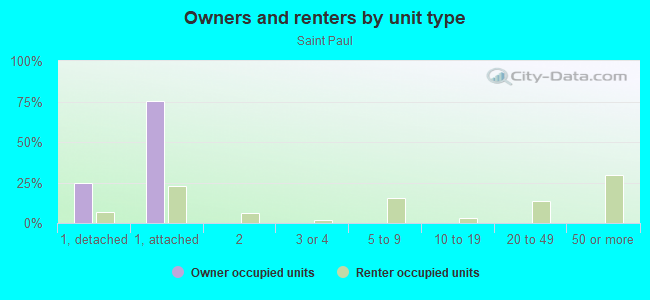
Owner-occupied
Renter-occupied

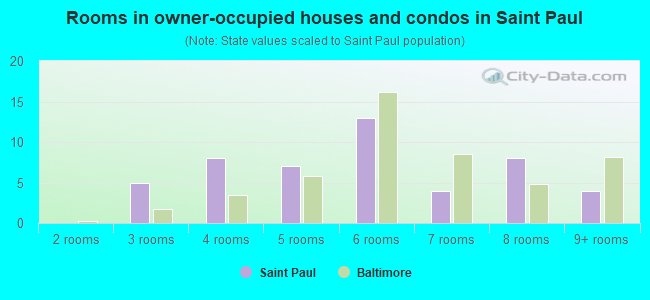
- Rooms in owner-occupied houses and condos in Saint Paul
- 01 room
- 02 rooms
- 53 rooms
- 84 rooms
- 75 rooms
- 136 rooms
- 47 rooms
- 88 rooms
- 49+ rooms
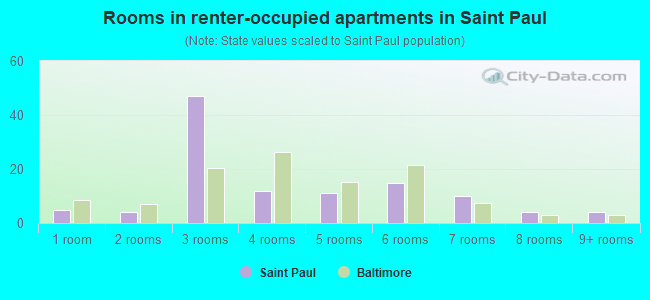
- Rooms in renter-occupied apartments in Saint Paul
- 51 room
- 42 rooms
- 473 rooms
- 124 rooms
- 115 rooms
- 156 rooms
- 107 rooms
- 48 rooms
- 49+ rooms
Owner-occupied
Renter-occupied
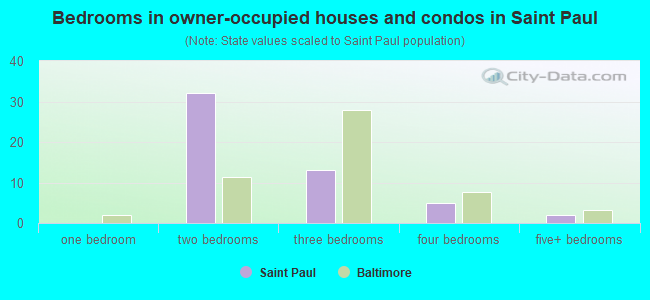
- Bedrooms in owner-occupied houses and condos in Saint Paul
- 0no bedroom
- 01 bedroom
- 322 bedrooms
- 133 bedrooms
- 54 bedrooms
- 25+ bedrooms
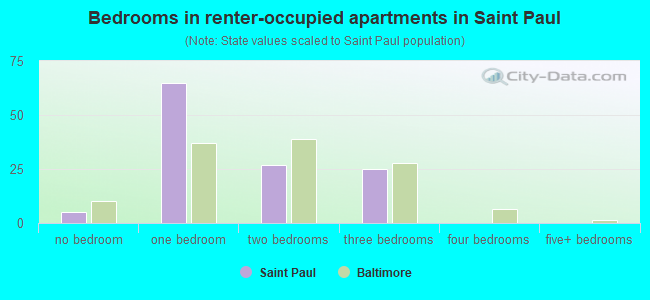
- Bedrooms in renter-occupied apartments in Saint Paul
- 5no bedroom
- 651 bedroom
- 272 bedrooms
- 253 bedrooms
- 04 bedrooms
- 05+ bedrooms
Average number of cars or other vehicles available in houses/condos:
Average number of cars or other vehicles available in apartments:
| This neighborhood: | 1.3 |
| Baltimore: | 1.5 |
Average number of cars or other vehicles available in apartments:
| Here: | 0.9 |
| city: | 0.8 |
Percentage of units with a mortgage:
| Saint Paul: | 77.4% |
| Baltimore: | 64.3% |
Average estimated value of townhouses or other attached units in 2022 (70.6% of all units):
| This neighborhood: | $91,872 |
| city: | $206,258 |
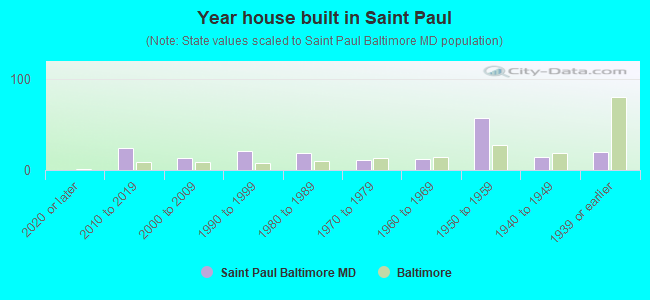
- Year house built in Saint Paul
- 02020 or later
- 242010 to 2019
- 132000 to 2009
- 211990 to 1999
- 191980 to 1989
- 111970 to 1979
- 121960 to 1969
- 571950 to 1959
- 141940 to 1949
- 201939 or earlier
Travel time to work (commute)
![Travel time to work (commute)]()
- 25 to 9 minutes
- 410 to 14 minutes
- 1515 to 19 minutes
- 2220 to 24 minutes
- 525 to 29 minutes
- 830 to 34 minutes
- 1035 to 39 minutes
- 340 to 44 minutes
- 1645 to 59 minutes
- 960 to 89 minutes
- 390 or more minutes

Means of transportation to work
![Means of transportation to work]()
- 62.4%70Drove a car alone
- 9.8%11Carpooled
- 20.5%23Bus
- 0.9%1Light rail, streetcar or trolley
- 0.9%1Bicycle
- 5.3%6Walked
- 0.9%1Other means
- 22.3%25Worked at home

Time leaving home to go to work
![Time leaving home to go to work]()
- 612:00 a.m. to 4:59 a.m.
- 65:00 a.m. to 5:29 a.m.
- 95:30 a.m. to 5:59 a.m.
- 166:00 a.m. to 6:29 a.m.
- 76:30 a.m. to 6:59 a.m.
- 87:00 a.m. to 7:29 a.m.
- 77:30 a.m. to 7:59 a.m.
- 78:00 a.m. to 8:29 a.m.
- 129:00 a.m. to 9:59 a.m.
- 210:00 a.m. to 10:59 a.m.
- 111:00 a.m. to 11:59 a.m.
- 712:00 p.m. to 3:59 p.m.
- 94:00 p.m. to 11:59 p.m.

Occupations of males:
- Percentage of males in management occupations (except farmers):
Here: 15.4% city: 10.7%
- Percentage of males in computer and mathematical occupations:
Here: 10.8% city: 6.1%
- Percentage of males in service occupations:
Here: 15.2% city: 14.7%
- Percentage of males in sales and office occupations:
Here: 1.3% city: 14.2%
- Percentage of males in construction, extraction, and maintenance occupations:
Here: 19.8% city: 5.6%
- Percentage of males in transportation occupations:
Here: 15.9% city: 6.8%
- Percentage of males in material moving occupations:
Here: 19.4% city: 7.0%
Occupations of females:
- Percentage of females in management occupations (except farmers):
Here: 9.4% city: 10.1%
- Percentage of females in education, training, and library occupations:
Here: 17.4% city: 10.7%
- Percentage of females in arts, design, entertainment, sports, and media occupations:
Here: 5.0% city: 2.4%
- Percentage of females in healthcare practitioners and technical occupations:
Here: 7.0% city: 9.8%
- Percentage of females in service occupations:
Here: 11.0% city: 20.4%
- Percentage of females in sales and office occupations:
Here: 34.9% city: 22.3%
- Percentage of females in production occupations:
Here: 7.0% city: 2.3%
- Percentage of females in material moving occupations:
Here: 7.4% city: 1.9%
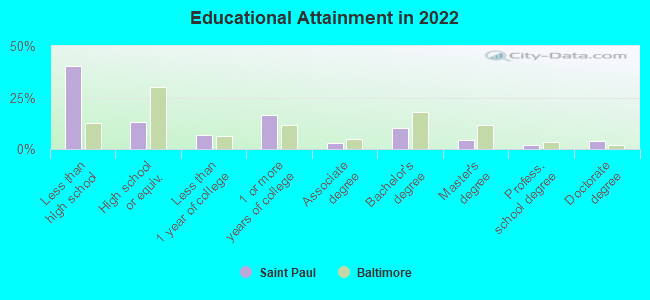
Education in this neighborhood (subdivision or community):
- Percentage of people 3 years and older in K-12 schools:
Saint Paul: 13.7% Baltimore: 14.7%
- Percentage of people 3 years and older in undergraduate colleges:
Saint Paul: 2.0% Baltimore: 6.0%
- Percentage of people 3 years and older in grad. or professional schools:
Saint Paul: 2.0% Baltimore: 2.8%
- Percentage of students K-12 enrolled in private schools:
Saint Paul: 0.0% Baltimore: 12.7%
Percentage of population below poverty level:
| Saint Paul: | 21.5% |
| Baltimore: | 18.5% |
Median year owner moved in (as recorded in 2022):
Median year renter moved in (as recorded in 2022):
| Saint Paul: | 2013 |
| Baltimore: | 2009 |
Median year renter moved in (as recorded in 2022):
| Saint Paul: | 2013 |
| Baltimore: | 2019 |
Percentage of married-couple families with both working:
| Saint Paul: | 73.9% |
| Baltimore: | 79.2% |
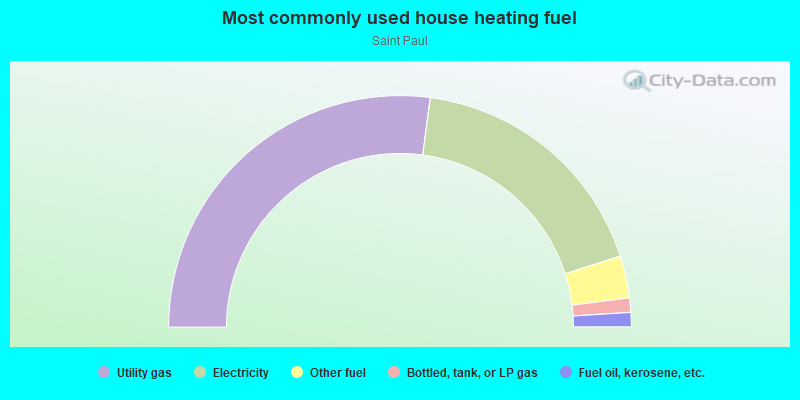
- 54.2%Utility gas
- 35.9%Electricity
- 5.9%Other fuel
- 2.0%Bottled, tank, or LP gas
- 2.0%Fuel oil, kerosene, etc.
Limited-access highways (interstate or state) in this neighborhood:
I- 95
Length: 0.41 miles
Direction: E-W
Direction: E-W
Roads and streets:
Maisel St
Length: 0.48 miles
Directions: N-S, SE-NW
Address range: 1900 to 2299
Directions: N-S, SE-NW
Address range: 1900 to 2299
Wicomico St
Length: 0.24 miles
Directions: E-W, SW-NE
Address range: 2100 to 2218
Directions: E-W, SW-NE
Address range: 2100 to 2218
W Hamburg St
Length: 0.19 miles
Directions: E-W, N-S, SW-NE
Address range: 2200 to 2299
Directions: E-W, N-S, SW-NE
Address range: 2200 to 2299
Severn St
Length: 0.18 miles
Directions: SE-NW, SW-NE
Address range: 2200 to 2315
Directions: SE-NW, SW-NE
Address range: 2200 to 2315
Erie St
Length: 0.14 miles
Directions: E-W, SE-NW
Address range: 2200 to 2299
Directions: E-W, SE-NW
Address range: 2200 to 2299
Langley St
Length: 0.13 miles
Directions: E-W, SW-NE
Address range: 2200 to 2299
Directions: E-W, SW-NE
Address range: 2200 to 2299
Laurey St
Length: 0.13 miles
Direction: SE-NW
Address range: 2100 to 2299
Direction: SE-NW
Address range: 2100 to 2299
Berlin St
Length: 0.13 miles
Direction: SW-NE
Address range: 2100 to 2252
Direction: SW-NE
Address range: 2100 to 2252
Ontario Ave
Length: 0.12 miles
Direction: E-W
Address range: 2000 to 2099
Direction: E-W
Address range: 2000 to 2099
Elmira St
Length: 0.10 miles
Direction: SE-NW
Address range: 2200 to 2299
Direction: SE-NW
Address range: 2200 to 2299
Bremen St
Length: 0.07 miles
Direction: SW-NE
Address range: 2200 to 2257
Direction: SW-NE
Address range: 2200 to 2257
Little Market St
Length: 0.06 miles
Direction: E-W
Address range: 2000 to 2099
Direction: E-W
Address range: 2000 to 2099
Western Ave
Length: 0.04 miles
Direction: N-S
Address range: 1300 to 1309
Direction: N-S
Address range: 1300 to 1309
Washington Blvd
Length: 0.04 miles
Direction: SW-NE
Address range: 2178 to 2209
Direction: SW-NE
Address range: 2178 to 2209
Railroad features:
Baltimore and Ohio RR
Length: 0.81 miles
Directions: E-W, SW-NE
Directions: E-W, SW-NE
Other features:
Gwynns Fls
Length: 0.04 miles
Direction: E-W
Direction: E-W