Riverpoint neighborhood in Norfolk, Virginia (VA), 23505 detailed profile
Settings
X


Business Search - 14 Million verified businesses
Area: 0.226 square miles
Population: 379
Population density:
| Riverpoint: | 1,675 people per square mile |
| Norfolk: | 4,337 people per square mile |

- 26970.8%White
- 5013.2%Two or more races
- 4411.6%Hispanic or Latino
- 82.1%Black
- 71.8%Asian
- 20.5%Some other race

Median household income in 2022:
| Riverpoint: | $120,250 |
| Norfolk: | $61,090 |
Distribution of median household income
![Distribution of median household income]()
- 5Less than $10,000
- 2$10,000 to $19,999
- 8$20,000 to $29,999
- 2$30,000 to $39,999
- 8$40,000 to $49,999
- 12$50,000 to $59,999
- 20$60,000 to $74,999
- 23$75,000 to $99,999
- 18$100,000 to $124,999
- 17$125,000 to $149,999
- 22$150,000 to $199,999
- 47$200,000 or more

Distribution of owner-occupied house/condo value
![Distribution of owner-occupied house/condo value]()
- 3Less than $50,000
- 6$100,000 to $149,999
- 8$150,000 to $199,999
- 3$200,000 to $249,999
- 6$250,000 to $299,999
- 31$300,000 to $399,999
- 36$400,000 to $499,999
- 35$500,000 to $749,999
- 18$750,000 to $999,999
- 5$1,000,000 or more

Distribution of rent paid by renters
![Distribution of rent paid by renters]()
- 3$100 to $199
- 7$800 to $899
- 3$1,000 to $1,249
- 16$1,250 to $1,499
- 4$1,500 to $1,999
- 4$2,000 or more

Median rent in 2022:
| Riverpoint: | $1,390 |
| Norfolk: | $1,035 |
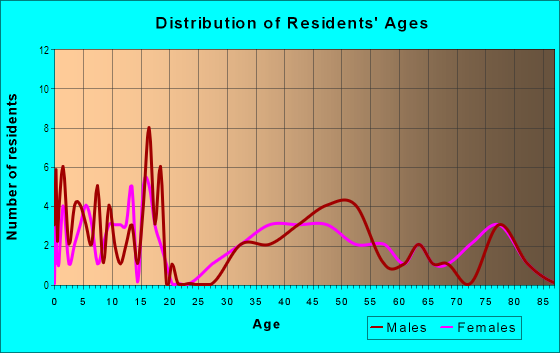
| Males: | 203 |
| Females: | 176 |
Males:
| This neighborhood: | 38.4 years |
| Whole city: | 31.3 years |
| This neighborhood: | 43.9 years |
| Whole city: | 34.4 years |
Average household size:
| Riverpoint: | 2.2 people |
| Norfolk: | 2.3 people |
Percentage of family households:
| Riverpoint: | 62.6% |
| Norfolk: | 41.3% |
| Here: | 71.0% |
| Norfolk: | 31.7% |
Percentage of married-couple families with children (among all households):
| Riverpoint: | 40.2% |
| Norfolk: | 20.2% |
Percentage of single-mother households (among all households):
| Riverpoint: | 0.5% |
| Norfolk: | 16.3% |
Percentage of never married males 15 years old and over:
Percentage of never married females 15 years old and over:
| Riverpoint: | 11.1% |
| Norfolk: | 25.4% |
Percentage of never married females 15 years old and over:
| Riverpoint: | 7.4% |
| city: | 20.5% |
Percentage of people that speak English not well or not at all:
| Riverpoint: | 0.0% |
| Norfolk: | 1.4% |
Percentage of people born in this state:
Percentage of people born in another U.S. state:
Percentage of native residents but born outside the U.S.:
Percentage of foreign born residents:
| Here: | 39.6% |
| Norfolk: | 51.1% |
Percentage of people born in another U.S. state:
| Riverpoint: | 48.6% |
| Norfolk: | 40.8% |
Percentage of native residents but born outside the U.S.:
| Here: | 5.8% |
| city: | 1.6% |
Percentage of foreign born residents:
| Here: | 6.0% |
| Norfolk: | 6.5% |

Owner-occupied
Renter-occupied


- Rooms in owner-occupied houses and condos in Riverpoint
- 01 room
- 02 rooms
- 03 rooms
- 34 rooms
- 105 rooms
- 276 rooms
- 77 rooms
- 368 rooms
- 549+ rooms

- Rooms in renter-occupied apartments in Riverpoint
- 01 room
- 02 rooms
- 03 rooms
- 84 rooms
- 95 rooms
- 66 rooms
- 17 rooms
- 08 rooms
- 39+ rooms
Owner-occupied
Renter-occupied

- Bedrooms in owner-occupied houses and condos in Riverpoint
- 0no bedroom
- 01 bedroom
- 92 bedrooms
- 563 bedrooms
- 524 bedrooms
- 215+ bedrooms

- Bedrooms in renter-occupied apartments in Riverpoint
- 0no bedroom
- 21 bedroom
- 172 bedrooms
- 53 bedrooms
- 14 bedrooms
- 15+ bedrooms
Average number of cars or other vehicles available in houses/condos:
Average number of cars or other vehicles available in apartments:
| This neighborhood: | 2.1 |
| Norfolk: | 2.0 |
Average number of cars or other vehicles available in apartments:
| Here: | 1.5 |
| city: | 1.3 |
Percentage of units with a mortgage:
| Riverpoint: | 80.7% |
| Norfolk: | 70.0% |

- Year house built in Riverpoint
- 02020 or later
- 62010 to 2019
- 12000 to 2009
- 91990 to 1999
- 41980 to 1989
- 101970 to 1979
- 61960 to 1969
- 451950 to 1959
- 461940 to 1949
- 471939 or earlier

City-data.com crime index for city in 2020 (higher means more crime):
| City: | 327.9 |
| U.S. average: | 219.5 |
Travel time to work (commute)
![Travel time to work (commute)]()
- 6Less than 5 minutes
- 105 to 9 minutes
- 3910 to 14 minutes
- 5515 to 19 minutes
- 3120 to 24 minutes
- 1125 to 29 minutes
- 2530 to 34 minutes
- 235 to 39 minutes
- 240 to 44 minutes
- 445 to 59 minutes
- 1060 to 89 minutes
- 190 or more minutes

Means of transportation to work
![Means of transportation to work]()
- 78.4%186Drove a car alone
- 6.3%15Carpooled
- 0.4%1Motorcycle
- 0.4%1Bicycle
- 0.4%1Other means
- 13.5%32Worked at home

Time leaving home to go to work
![Time leaving home to go to work]()
- 812:00 a.m. to 4:59 a.m.
- 45:00 a.m. to 5:29 a.m.
- 105:30 a.m. to 5:59 a.m.
- 146:00 a.m. to 6:29 a.m.
- 166:30 a.m. to 6:59 a.m.
- 227:00 a.m. to 7:29 a.m.
- 457:30 a.m. to 7:59 a.m.
- 318:00 a.m. to 8:29 a.m.
- 198:30 a.m. to 8:59 a.m.
- 139:00 a.m. to 9:59 a.m.
- 110:00 a.m. to 10:59 a.m.
- 611:00 a.m. to 11:59 a.m.
- 412:00 p.m. to 3:59 p.m.
- 44:00 p.m. to 11:59 p.m.

Occupations of males:
- Percentage of males in management occupations (except farmers):
Here: 22.5% city: 8.2%
- Percentage of males in business and financial operations occupations:
Here: 4.9% city: 4.4%
- Percentage of males in computer and mathematical occupations:
Here: 3.3% city: 4.2%
- Percentage of males in architecture and engineering occupations:
Here: 7.3% city: 3.7%
- Percentage of males in community and social services occupations:
Here: 2.1% city: 1.3%
- Percentage of males in legal occupations:
Here: 16.4% city: 1.0%
- Percentage of males in education, training, and library occupations:
Here: 3.0% city: 3.9%
- Percentage of males in arts, design, entertainment, sports, and media occupations:
Here: 1.5% city: 2.2%
- Percentage of males in healthcare practitioners and technical occupations:
Here: 12.2% city: 3.2%
- Percentage of males in service occupations:
Here: 6.4% city: 16.9%
- Percentage of males in sales and office occupations:
Here: 11.9% city: 15.6%
- Percentage of males in construction, extraction, and maintenance occupations:
Here: 4.3% city: 9.8%
- Percentage of males in production occupations:
Here: 3.4% city: 6.5%
- Percentage of males in transportation occupations:
Here: 2.1% city: 5.3%
Occupations of females:
- Percentage of females in management occupations (except farmers):
Here: 15.4% city: 7.7%
- Percentage of females in business and financial operations occupations:
Here: 2.0% city: 5.2%
- Percentage of females in computer and mathematical occupations:
Here: 1.1% city: 1.7%
- Percentage of females in architecture and engineering occupations:
Here: 2.4% city: 1.0%
- Percentage of females in life, physical, and social science occupations:
Here: 1.6% city: 0.9%
- Percentage of females in community and social services occupations:
Here: 2.0% city: 3.1%
- Percentage of females in legal occupations:
Here: 6.7% city: 1.6%
- Percentage of females in education, training, and library occupations:
Here: 25.2% city: 9.1%
- Percentage of females in arts, design, entertainment, sports, and media occupations:
Here: 4.3% city: 1.3%
- Percentage of females in healthcare practitioners and technical occupations:
Here: 11.0% city: 9.6%
- Percentage of females in service occupations:
Here: 6.7% city: 22.3%
- Percentage of females in sales and office occupations:
Here: 19.3% city: 28.7%
- Percentage of females in production occupations:
Here: 1.6% city: 2.7%
- Percentage of females in transportation occupations:
Here: 2.0% city: 1.6%
Percentage of people 16-64 in Armed Forces:
| Riverpoint: | 8.3% |
| Norfolk: | 15.8% |
Education in this neighborhood (subdivision or community):
- Percentage of people 3 years and older in K-12 schools:
Riverpoint: 15.1% Norfolk: 14.3%
- Percentage of people 3 years and older in undergraduate colleges:
Riverpoint: 1.9% Norfolk: 8.0%
- Percentage of people 3 years and older in grad. or professional schools:
Riverpoint: 2.9% Norfolk: 2.1%
- Percentage of students K-12 enrolled in private schools:
Riverpoint: 52.6% Norfolk: 16.2%
Percentage of population below poverty level:
| Riverpoint: | 8.7% |
| Norfolk: | 17.7% |
Median year owner moved in (as recorded in 2022):
Median year renter moved in (as recorded in 2022):
| Riverpoint: | 2012 |
| Norfolk: | 2013 |
Median year renter moved in (as recorded in 2022):
| Riverpoint: | 2020 |
| Norfolk: | 2020 |
Percentage of married-couple families with both working:
| Riverpoint: | 78.6% |
| Norfolk: | 65.5% |

- 56.6%Utility gas
- 33.8%Electricity
- 8.6%Fuel oil, kerosene, etc.
- 1.1%Bottled, tank, or LP gas
Highways in this neighborhood:
Roads and streets:
River Rd
Length: 0.42 miles
Directions: E-W, N-S, SW-NE
Address range: 6000 to 6099
Directions: E-W, N-S, SW-NE
Address range: 6000 to 6099
Newport Ave
Length: 0.35 miles
Directions: N-S, SW-NE
Address range: 6000 to 6199
Directions: N-S, SW-NE
Address range: 6000 to 6199
Newport Cres
Length: 0.33 miles
Directions: E-W, N-S, SE-NW, SW-NE
Address range: 6000 to 6099
Directions: E-W, N-S, SE-NW, SW-NE
Address range: 6000 to 6099
S River Rd
Length: 0.25 miles
Directions: E-W, N-S, SE-NW, SW-NE
Address range: 6001 to 6099
Directions: E-W, N-S, SE-NW, SW-NE
Address range: 6001 to 6099
Ridgeley Rd
Length: 0.19 miles
Directions: E-W, SE-NW
Directions: E-W, SE-NW
S Ridgeley Rd
Length: 0.19 miles
Directions: E-W, N-S, SE-NW
Address range: 100 to 166
Directions: E-W, N-S, SE-NW
Address range: 100 to 166
River Cres
Length: 0.14 miles
Directions: E-W, SW-NE
Address range: 6054 to 6099
Directions: E-W, SW-NE
Address range: 6054 to 6099
W River Rd
Length: 0.13 miles
Directions: E-W, N-S, SE-NW
Directions: E-W, N-S, SE-NW
Ridgeley Pt
Length: 0.07 miles
Directions: E-W, SW-NE
Address range: 113 to 139
Directions: E-W, SW-NE
Address range: 113 to 139
Newport Pt
Length: 0.06 miles
Directions: E-W, SW-NE
Address range: 6000 to 6099
Directions: E-W, SW-NE
Address range: 6000 to 6099
River Road Pt
Length: 0.05 miles
Direction: E-W
Address range: 6000 to 6099
Direction: E-W
Address range: 6000 to 6099