Professorville neighborhood in Palo Alto, California (CA), 94301 detailed profile
Settings
X


Business Search - 14 Million verified businesses
Area: 0.092 square miles
Population: 535
Population density:
| Professorville: | 5,831 people per square mile |
| Palo Alto: | 2,789 people per square mile |

- 26449.6%White
- 17432.7%Asian
- 499.2%Two or more races
- 356.6%Hispanic or Latino
- 101.9%Some other race

Median household income in 2022:
| Professorville: | $250,001 |
| Palo Alto: | $179,707 |
Distribution of median household income
![Distribution of median household income]()
- 2Less than $10,000
- 2$20,000 to $29,999
- 7$30,000 to $39,999
- 3$40,000 to $49,999
- 1$50,000 to $59,999
- 2$60,000 to $74,999
- 5$75,000 to $99,999
- 2$100,000 to $124,999
- 7$125,000 to $149,999
- 22$150,000 to $199,999
- 155$200,000 or more

Distribution of owner-occupied house/condo value
![Distribution of owner-occupied house/condo value]()
- 1Less than $50,000
- 1$50,000 to $99,999
- 1$500,000 to $749,999
- 158$1,000,000 or more

Distribution of rent paid by renters
![Distribution of rent paid by renters]()
- 11$800 to $899
- 31$2,000 or more

Median rent in 2022:
| Professorville: | $3,316 |
| Palo Alto: | $2,001 |
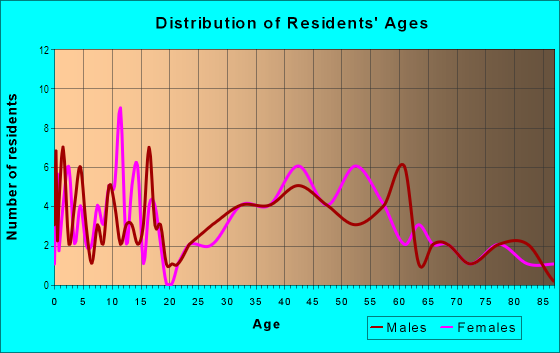
| Males: | 268 |
| Females: | 266 |
Males:
| This neighborhood: | 41.8 years |
| Whole city: | 47.1 years |
| This neighborhood: | 44.3 years |
| Whole city: | 48.1 years |
Average household size:
| Professorville: | 2.8 people |
| Palo Alto: | 2.3 people |
Percentage of family households:
| Professorville: | 42.0% |
| Palo Alto: | 42.2% |
| Here: | 67.7% |
| Palo Alto: | 52.1% |
Percentage of married-couple families with children (among all households):
| Professorville: | 36.2% |
| Palo Alto: | 37.5% |
Percentage of single-mother households (among all households):
| Professorville: | 1.2% |
| Palo Alto: | 3.5% |
Percentage of never married males 15 years old and over:
Percentage of never married females 15 years old and over:
| Professorville: | 4.1% |
| Palo Alto: | 17.4% |
Percentage of never married females 15 years old and over:
| Professorville: | 12.5% |
| city: | 11.8% |
Percentage of people that speak English not well or not at all:
| Professorville: | 0.0% |
| Palo Alto: | 3.7% |
Percentage of people born in this state:
Percentage of people born in another U.S. state:
Percentage of native residents but born outside the U.S.:
Percentage of foreign born residents:
| Here: | 34.5% |
| Palo Alto: | 36.4% |
Percentage of people born in another U.S. state:
| Professorville: | 26.8% |
| Palo Alto: | 28.3% |
Percentage of native residents but born outside the U.S.:
| Here: | 1.2% |
| city: | 3.7% |
Percentage of foreign born residents:
| Here: | 37.5% |
| Palo Alto: | 31.6% |

Owner-occupied
Renter-occupied


- Rooms in owner-occupied houses and condos in Professorville
- 01 room
- 02 rooms
- 453 rooms
- 104 rooms
- 35 rooms
- 126 rooms
- 67 rooms
- 478 rooms
- 349+ rooms

- Rooms in renter-occupied apartments in Professorville
- 01 room
- 82 rooms
- 53 rooms
- 114 rooms
- 65 rooms
- 126 rooms
- 47 rooms
- 08 rooms
- 29+ rooms
Owner-occupied
Renter-occupied

- Bedrooms in owner-occupied houses and condos in Professorville
- 0no bedroom
- 01 bedroom
- 562 bedrooms
- 83 bedrooms
- 494 bedrooms
- 435+ bedrooms

- Bedrooms in renter-occupied apartments in Professorville
- 0no bedroom
- 141 bedroom
- 122 bedrooms
- 63 bedrooms
- 44 bedrooms
- 05+ bedrooms
Average number of cars or other vehicles available in houses/condos:
Average number of cars or other vehicles available in apartments:
| This neighborhood: | 2.3 |
| Palo Alto: | 2.1 |
Average number of cars or other vehicles available in apartments:
| Here: | 2.1 |
| city: | 1.1 |
Percentage of units with a mortgage:
| Professorville: | 82.9% |
| Palo Alto: | 58.3% |

- Year house built in Professorville
- 02020 or later
- 62010 to 2019
- 32000 to 2009
- 61990 to 1999
- 211980 to 1989
- 431970 to 1979
- 121960 to 1969
- 111950 to 1959
- 191940 to 1949
- 861939 or earlier

City-data.com crime index for city in 2020 (higher means more crime):
| City: | 180.8 |
| U.S. average: | 219.5 |
Travel time to work (commute)
![Travel time to work (commute)]()
- 65 to 9 minutes
- 1210 to 14 minutes
- 1615 to 19 minutes
- 2020 to 24 minutes
- 525 to 29 minutes
- 1430 to 34 minutes
- 135 to 39 minutes
- 240 to 44 minutes
- 1345 to 59 minutes
- 160 to 89 minutes

Means of transportation to work
![Means of transportation to work]()
- 34.3%94Drove a car alone
- 3.6%10Carpooled
- 1.5%4Long-distance train or commuter rail
- 5.1%14Bicycle
- 0.4%1Walked
- 2.2%6Other means
- 52.1%143Worked at home

Time leaving home to go to work
![Time leaving home to go to work]()
- 36:00 a.m. to 6:29 a.m.
- 56:30 a.m. to 6:59 a.m.
- 107:00 a.m. to 7:29 a.m.
- 137:30 a.m. to 7:59 a.m.
- 138:00 a.m. to 8:29 a.m.
- 88:30 a.m. to 8:59 a.m.
- 189:00 a.m. to 9:59 a.m.
- 110:00 a.m. to 10:59 a.m.
- 512:00 p.m. to 3:59 p.m.
- 94:00 p.m. to 11:59 p.m.

Occupations of males:
- Percentage of males in management occupations (except farmers):
Here: 21.1% city: 19.1%
- Percentage of males in business and financial operations occupations:
Here: 4.6% city: 7.0%
- Percentage of males in computer and mathematical occupations:
Here: 3.4% city: 22.2%
- Percentage of males in architecture and engineering occupations:
Here: 29.1% city: 10.1%
- Percentage of males in life, physical, and social science occupations:
Here: 26.1% city: 6.4%
- Percentage of males in legal occupations:
Here: 6.5% city: 2.5%
- Percentage of males in education, training, and library occupations:
Here: 1.1% city: 7.2%
- Percentage of males in arts, design, entertainment, sports, and media occupations:
Here: 2.3% city: 3.2%
- Percentage of males in healthcare practitioners and technical occupations:
Here: 2.3% city: 4.6%
- Percentage of males in sales and office occupations:
Here: 3.3% city: 5.7%
Occupations of females:
- Percentage of females in management occupations (except farmers):
Here: 15.8% city: 19.0%
- Percentage of females in business and financial operations occupations:
Here: 9.2% city: 8.3%
- Percentage of females in computer and mathematical occupations:
Here: 3.0% city: 8.6%
- Percentage of females in architecture and engineering occupations:
Here: 35.5% city: 4.0%
- Percentage of females in life, physical, and social science occupations:
Here: 2.2% city: 6.8%
- Percentage of females in legal occupations:
Here: 4.6% city: 4.8%
- Percentage of females in education, training, and library occupations:
Here: 10.5% city: 12.9%
- Percentage of females in arts, design, entertainment, sports, and media occupations:
Here: 1.1% city: 4.3%
- Percentage of females in healthcare practitioners and technical occupations:
Here: 3.3% city: 8.7%
- Percentage of females in service occupations:
Here: 9.9% city: 8.4%
- Percentage of females in sales and office occupations:
Here: 11.2% city: 11.7%
Education in this neighborhood (subdivision or community):
- Percentage of people 3 years and older in K-12 schools:
Professorville: 23.6% Palo Alto: 14.2%
- Percentage of people 3 years and older in undergraduate colleges:
Professorville: 2.3% Palo Alto: 2.4%
- Percentage of people 3 years and older in grad. or professional schools:
Professorville: 1.1% Palo Alto: 2.8%
- Percentage of students K-12 enrolled in private schools:
Professorville: 10.5% Palo Alto: 22.1%
Percentage of population below poverty level:
| Professorville: | 3.2% |
| Palo Alto: | 4.5% |
Median year owner moved in (as recorded in 2022):
Median year renter moved in (as recorded in 2022):
| Professorville: | 2006 |
| Palo Alto: | 2001 |
Median year renter moved in (as recorded in 2022):
| Professorville: | 2013 |
| Palo Alto: | 2019 |
Percentage of married-couple families with both working:
| Professorville: | 86.0% |
| Palo Alto: | 68.5% |

- 87.5%Utility gas
- 11.1%Electricity
- 1.4%Solar energy
Roads and streets:
Cowper St
Length: 0.35 miles
Direction: SE-NW
Address range: 1100 to 1449
Direction: SE-NW
Address range: 1100 to 1449
Lincoln Ave
Length: 0.32 miles
Direction: SW-NE
Address range: 208 to 499
Direction: SW-NE
Address range: 208 to 499
Kingsley Ave
Length: 0.29 miles
Direction: SW-NE
Address range: 250 to 499
Direction: SW-NE
Address range: 250 to 499
Embarcadero Rd
Length: 0.28 miles
Direction: E-W
Address range: 300 to 499
Direction: E-W
Address range: 300 to 499
Waverley St
Length: 0.27 miles
Direction: SE-NW
Address range: 1100 to 1399
Direction: SE-NW
Address range: 1100 to 1399
Melville Ave
Length: 0.21 miles
Directions: N-S, SW-NE
Address range: 300 to 499
Directions: N-S, SW-NE
Address range: 300 to 499
Bryant St
Length: 0.19 miles
Direction: SE-NW
Address range: 1100 to 1299
Direction: SE-NW
Address range: 1100 to 1299
Whitman Ct
Length: 0.12 miles
Direction: SW-NE
Address range: 301 to 399
Direction: SW-NE
Address range: 301 to 399
Ln 59 E
Length: 0.10 miles
Direction: SE-NW
Address range: 1100 to 1199
Direction: SE-NW
Address range: 1100 to 1199
Ramona St
Length: 0.10 miles
Direction: SE-NW
Address range: 1100 to 1199
Direction: SE-NW
Address range: 1100 to 1199