Peaceful Valley neighborhood in Bellaire, Texas (TX), 77401 detailed profile
Settings
X


Business Search - 14 Million verified businesses
Area: 0.099 square miles
Population: 563
Population density:
| Peaceful Valley: | 5,677 people per square mile |
| Bellaire: | 4,739 people per square mile |

- 41072.7%White
- 6812.1%Asian
- 6812.1%Hispanic or Latino
- 152.7%Two or more races
- 30.5%Black

Median household income in 2022:
| Peaceful Valley: | $206,925 |
| Bellaire: | $215,636 |
Distribution of median household income
![Distribution of median household income]()
- 8Less than $10,000
- 10$20,000 to $29,999
- 2$30,000 to $39,999
- 12$40,000 to $49,999
- 9$60,000 to $74,999
- 29$75,000 to $99,999
- 19$100,000 to $124,999
- 21$125,000 to $149,999
- 30$150,000 to $199,999
- 110$200,000 or more

Distribution of owner-occupied house/condo value
![Distribution of owner-occupied house/condo value]()
- 3$150,000 to $199,999
- 6$200,000 to $249,999
- 5$300,000 to $399,999
- 6$400,000 to $499,999
- 14$500,000 to $749,999
- 47$750,000 to $999,999
- 89$1,000,000 or more

Distribution of rent paid by renters
![Distribution of rent paid by renters]()
- 60$2,000 or more

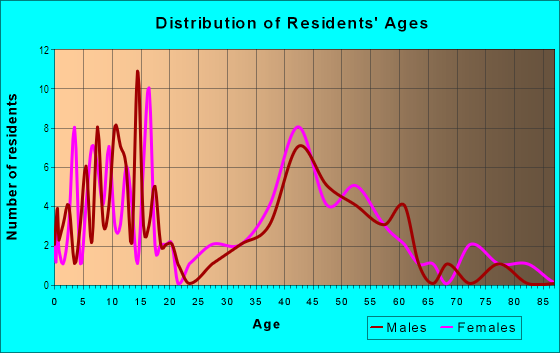
| Males: | 266 |
| Females: | 296 |
Males:
| This neighborhood: | 52.8 years |
| Whole city: | 43.8 years |
| This neighborhood: | 46.8 years |
| Whole city: | 44.9 years |
Average household size:
| Peaceful Valley: | 2.8 people |
| Bellaire: | 2.8 people |
Percentage of family households:
| Peaceful Valley: | 53.4% |
| Bellaire: | 58.0% |
| Here: | 81.3% |
| Bellaire: | 74.9% |
Percentage of married-couple families with children (among all households):
| Peaceful Valley: | 34.0% |
| Bellaire: | 34.0% |
Percentage of single-mother households (among all households):
| Peaceful Valley: | 1.6% |
| Bellaire: | 1.1% |
Percentage of never married males 15 years old and over:
Percentage of never married females 15 years old and over:
| Peaceful Valley: | 10.2% |
| Bellaire: | 11.3% |
Percentage of never married females 15 years old and over:
| Peaceful Valley: | 14.5% |
| city: | 11.6% |
Percentage of people that speak English not well or not at all:
| Peaceful Valley: | 2.9% |
| Bellaire: | 2.4% |
Percentage of people born in this state:
Percentage of people born in another U.S. state:
Percentage of native residents but born outside the U.S.:
Percentage of foreign born residents:
| Here: | 46.1% |
| Bellaire: | 49.6% |
Percentage of people born in another U.S. state:
| Peaceful Valley: | 26.4% |
| Bellaire: | 25.6% |
Percentage of native residents but born outside the U.S.:
| Here: | 3.0% |
| city: | 2.0% |
Percentage of foreign born residents:
| Here: | 24.5% |
| Bellaire: | 22.8% |

Owner-occupied
Renter-occupied


- Rooms in owner-occupied houses and condos in Peaceful Valley
- 01 room
- 02 rooms
- 03 rooms
- 34 rooms
- 185 rooms
- 146 rooms
- 237 rooms
- 238 rooms
- 919+ rooms

- Rooms in renter-occupied apartments in Peaceful Valley
- 01 room
- 02 rooms
- 43 rooms
- 34 rooms
- 05 rooms
- 66 rooms
- 47 rooms
- 08 rooms
- 339+ rooms
Owner-occupied
Renter-occupied

- Bedrooms in owner-occupied houses and condos in Peaceful Valley
- 0no bedroom
- 01 bedroom
- 52 bedrooms
- 263 bedrooms
- 714 bedrooms
- 535+ bedrooms

- Bedrooms in renter-occupied apartments in Peaceful Valley
- 0no bedroom
- 41 bedroom
- 32 bedrooms
- 93 bedrooms
- 04 bedrooms
- 275+ bedrooms
Average number of cars or other vehicles available in houses/condos:
Average number of cars or other vehicles available in apartments:
| This neighborhood: | 2.2 |
| Bellaire: | 2.2 |
Average number of cars or other vehicles available in apartments:
| Here: | |
| city: |
Percentage of units with a mortgage:
| Peaceful Valley: | 55.7% |
| Bellaire: | 53.4% |
Average estimated value of detached houses in 2022 (98.5% of all units):
| Peaceful Valley: | $1,015,440 |
| Texas: | $369,058 |

- Year house built in Peaceful Valley
- 22020 or later
- 192010 to 2019
- 742000 to 2009
- 561990 to 1999
- 171980 to 1989
- 41970 to 1979
- 171960 to 1969
- 171950 to 1959
- 81940 to 1949
- 01939 or earlier

City-data.com crime index for city in 2020 (higher means more crime):
| City: | 83.0 |
| U.S. average: | 219.5 |
Travel time to work (commute)
![Travel time to work (commute)]()
- 235 to 9 minutes
- 3310 to 14 minutes
- 3215 to 19 minutes
- 5220 to 24 minutes
- 1325 to 29 minutes
- 5430 to 34 minutes
- 1035 to 39 minutes
- 940 to 44 minutes
- 445 to 59 minutes

Means of transportation to work
![Means of transportation to work]()
- 80.4%183Drove a car alone
- 2.6%6Carpooled
- 2.6%6Bus
- 1.8%4Subway or elevated rail
- 2.2%5Other means
- 13.2%30Worked at home

Time leaving home to go to work
![Time leaving home to go to work]()
- 212:00 a.m. to 4:59 a.m.
- 15:00 a.m. to 5:29 a.m.
- 45:30 a.m. to 5:59 a.m.
- 256:00 a.m. to 6:29 a.m.
- 186:30 a.m. to 6:59 a.m.
- 357:00 a.m. to 7:29 a.m.
- 377:30 a.m. to 7:59 a.m.
- 338:00 a.m. to 8:29 a.m.
- 378:30 a.m. to 8:59 a.m.
- 199:00 a.m. to 9:59 a.m.
- 510:00 a.m. to 10:59 a.m.
- 512:00 p.m. to 3:59 p.m.
- 94:00 p.m. to 11:59 p.m.

Occupations of males:
- Percentage of males in management occupations (except farmers):
Here: 39.3% city: 22.3%
- Percentage of males in business and financial operations occupations:
Here: 3.8% city: 6.2%
- Percentage of males in computer and mathematical occupations:
Here: 11.7% city: 7.8%
- Percentage of males in architecture and engineering occupations:
Here: 8.8% city: 8.1%
- Percentage of males in life, physical, and social science occupations:
Here: 3.8% city: 3.4%
- Percentage of males in legal occupations:
Here: 9.4% city: 7.7%
- Percentage of males in arts, design, entertainment, sports, and media occupations:
Here: 1.5% city: 1.8%
- Percentage of males in healthcare practitioners and technical occupations:
Here: 5.2% city: 18.7%
- Percentage of males in sales and office occupations:
Here: 18.1% city: 12.1%
- Percentage of males in material moving occupations:
Here: 1.7% city: 1.0%
Occupations of females:
- Percentage of females in management occupations (except farmers):
Here: 15.3% city: 12.4%
- Percentage of females in business and financial operations occupations:
Here: 9.4% city: 9.5%
- Percentage of females in computer and mathematical occupations:
Here: 3.7% city: 3.7%
- Percentage of females in architecture and engineering occupations:
Here: 1.8% city: 1.9%
- Percentage of females in life, physical, and social science occupations:
Here: 2.5% city: 5.2%
- Percentage of females in community and social services occupations:
Here: 3.6% city: 3.6%
- Percentage of females in education, training, and library occupations:
Here: 24.6% city: 15.8%
- Percentage of females in healthcare practitioners and technical occupations:
Here: 15.6% city: 15.2%
- Percentage of females in service occupations:
Here: 4.1% city: 8.2%
- Percentage of females in sales and office occupations:
Here: 13.7% city: 16.0%
- Percentage of females in production occupations:
Here: 4.3% city: 2.2%
- Percentage of females in transportation occupations:
Here: 1.9% city: 1.1%
- Percentage of females in material moving occupations:
Here: 1.9% city: 0.6%
Education in this neighborhood (subdivision or community):
- Percentage of people 3 years and older in K-12 schools:
Peaceful Valley: 27.4% Bellaire: 22.0%
- Percentage of people 3 years and older in undergraduate colleges:
Peaceful Valley: 1.5% Bellaire: 2.8%
- Percentage of people 3 years and older in grad. or professional schools:
Peaceful Valley: 8.0% Bellaire: 1.6%
- Percentage of students K-12 enrolled in private schools:
Peaceful Valley: 45.7% Bellaire: 40.1%
Percentage of population below poverty level:
| Peaceful Valley: | 1.8% |
| Bellaire: | 2.2% |
Median year owner moved in (as recorded in 2022):
| Peaceful Valley: | 2007 |
| Bellaire: | 2008 |
Percentage of married-couple families with both working:
| Peaceful Valley: | 52.4% |
| Bellaire: | 71.4% |

- 74.7%Utility gas
- 25.3%Electricity
Roads and streets:
S Rice Ave
Length: 0.35 miles
Direction: N-S
Address range: 7200 to 7499
Direction: N-S
Address range: 7200 to 7499
Ferris Dr
Length: 0.35 miles
Direction: N-S
Address range: 500 to 799
Direction: N-S
Address range: 500 to 799
Evergreen St
Length: 0.29 miles
Direction: E-W
Address range: 5100 to 5299
Direction: E-W
Address range: 5100 to 5299
Huisache St
Length: 0.29 miles
Direction: E-W
Address range: 5100 to 5299
Direction: E-W
Address range: 5100 to 5299
Patrick Henry St
Length: 0.29 miles
Direction: E-W
Address range: 5100 to 5299
Direction: E-W
Address range: 5100 to 5299
Pocahontas St
Length: 0.29 miles
Direction: E-W
Address range: 5100 to 5299
Direction: E-W
Address range: 5100 to 5299
Grand Lake St
Length: 0.29 miles
Direction: E-W
Address range: 5100 to 5299
Direction: E-W
Address range: 5100 to 5299
Jessamine St
Length: 0.29 miles
Direction: E-W
Address range: 5100 to 5299
Direction: E-W
Address range: 5100 to 5299
Aspen St
Length: 0.29 miles
Direction: E-W
Address range: 5100 to 5299
Direction: E-W
Address range: 5100 to 5299
S 5th St
Length: 0.23 miles
Direction: N-S
Address range: 500 to 799
Direction: N-S
Address range: 500 to 799