Pacific Edison neighborhood in Glendale, California (CA), 91204 detailed profile
Settings
X


Business Search - 14 Million verified businesses
Area: 0.334 square miles
Population: 7,427
Population density:
| Pacific Edison: | 22,230 people per square mile |
| Glendale: | 6,175 people per square mile |

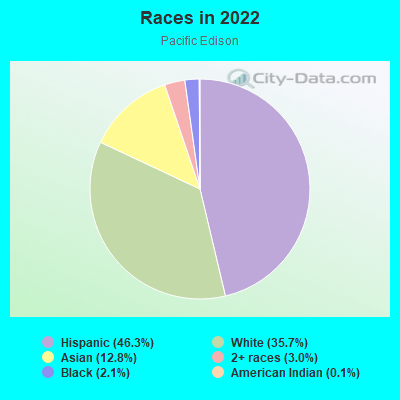
- 3,52046.3%Hispanic or Latino
- 2,71435.7%White
- 97112.8%Asian
- 2263.0%Two or more races
- 1562.1%Black
- 110.1%American Indian
Median household income in 2022:
| Pacific Edison: | $67,197 |
| Glendale: | $77,483 |
Distribution of median household income
![Distribution of median household income]()
- 220Less than $10,000
- 294$10,000 to $19,999
- 292$20,000 to $29,999
- 175$30,000 to $39,999
- 233$40,000 to $49,999
- 250$50,000 to $59,999
- 203$60,000 to $74,999
- 376$75,000 to $99,999
- 306$100,000 to $124,999
- 105$125,000 to $149,999
- 143$150,000 to $199,999
- 168$200,000 or more

Distribution of owner-occupied house/condo value
![Distribution of owner-occupied house/condo value]()
- 47Less than $50,000
- 17$300,000 to $399,999
- 5$400,000 to $499,999
- 27$500,000 to $749,999
- 106$750,000 to $999,999
- 134$1,000,000 or more

Distribution of rent paid by renters
![Distribution of rent paid by renters]()
- 90$200 to $299
- 254$300 to $399
- 49$400 to $499
- 78$500 to $599
- 103$600 to $699
- 36$700 to $799
- 45$800 to $899
- 60$900 to $999
- 334$1,000 to $1,249
- 334$1,250 to $1,499
- 694$1,500 to $1,999
- 1,005$2,000 or more

Median rent in 2022:
| Pacific Edison: | $1,708 |
| Glendale: | $1,842 |
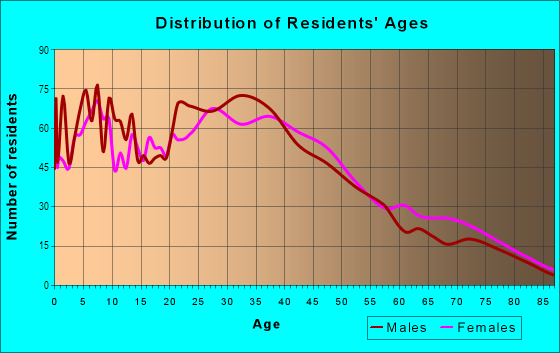
| Males: | 3,462 |
| Females: | 3,964 |
Males:
| This neighborhood: | 39.4 years |
| Whole city: | 41.8 years |
| This neighborhood: | 43.3 years |
| Whole city: | 43.4 years |
Average household size:
| Pacific Edison: | 7.0 people |
| Glendale: | 2.5 people |
Percentage of family households:
| Pacific Edison: | 38.0% |
| Glendale: | 40.0% |
| Here: | 36.6% |
| Glendale: | 44.2% |
Percentage of married-couple families with children (among all households):
| Pacific Edison: | 24.1% |
| Glendale: | 30.5% |
Percentage of single-mother households (among all households):
| Pacific Edison: | 6.7% |
| Glendale: | 7.0% |
Percentage of never married males 15 years old and over:
Percentage of never married females 15 years old and over:
| Pacific Edison: | 23.5% |
| Glendale: | 18.4% |
Percentage of never married females 15 years old and over:
| Pacific Edison: | 21.3% |
| city: | 18.3% |
Percentage of people that speak English not well or not at all:
| Pacific Edison: | 16.7% |
| Glendale: | 12.5% |
Percentage of people born in this state:
Percentage of people born in another U.S. state:
Percentage of native residents but born outside the U.S.:
Percentage of foreign born residents:
| Here: | 37.5% |
| Glendale: | 38.0% |
Percentage of people born in another U.S. state:
| Pacific Edison: | 7.5% |
| Glendale: | 11.6% |
Percentage of native residents but born outside the U.S.:
| Here: | 0.1% |
| city: | 1.5% |
Percentage of foreign born residents:
| Here: | 54.9% |
| Glendale: | 48.9% |

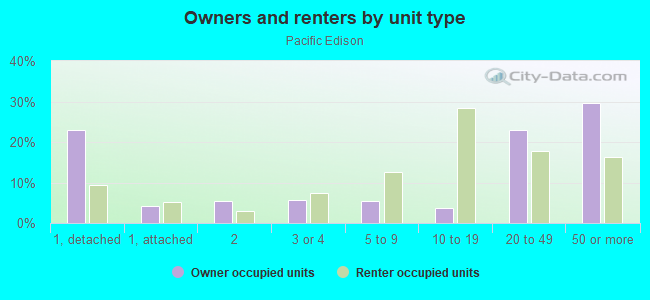
Owner-occupied
Renter-occupied


- Rooms in owner-occupied houses and condos in Pacific Edison
- 01 room
- 1202 rooms
- 803 rooms
- 614 rooms
- 225 rooms
- 256 rooms
- 657 rooms
- 978 rooms
- 09+ rooms

- Rooms in renter-occupied apartments in Pacific Edison
- 2361 room
- 1722 rooms
- 4153 rooms
- 9394 rooms
- 4215 rooms
- 1256 rooms
- 407 rooms
- 08 rooms
- 1549+ rooms
Owner-occupied
Renter-occupied

- Bedrooms in owner-occupied houses and condos in Pacific Edison
- 26no bedroom
- 261 bedroom
- 912 bedrooms
- 733 bedrooms
- 364 bedrooms
- 05+ bedrooms

- Bedrooms in renter-occupied apartments in Pacific Edison
- 306no bedroom
- 8511 bedroom
- 1,0512 bedrooms
- 1783 bedrooms
- 334 bedrooms
- 1595+ bedrooms
Average number of cars or other vehicles available in houses/condos:
Average number of cars or other vehicles available in apartments:
| This neighborhood: | |
| Glendale: |
Average number of cars or other vehicles available in apartments:
| Here: | 1.1 |
| city: | 1.4 |
Percentage of units with a mortgage:
| Pacific Edison: | 64.3% |
| Glendale: | 73.0% |
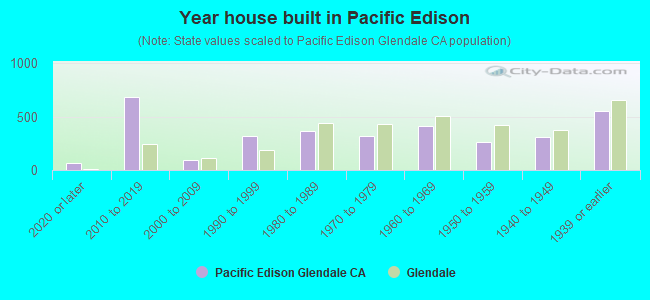
- Year house built in Pacific Edison
- 702020 or later
- 6812010 to 2019
- 972000 to 2009
- 3161990 to 1999
- 3691980 to 1989
- 3181970 to 1979
- 4151960 to 1969
- 2581950 to 1959
- 3111940 to 1949
- 5521939 or earlier
City-data.com crime index for city in 2020 (higher means more crime):
| City: | 110.5 |
| U.S. average: | 219.5 |
Travel time to work (commute)
![Travel time to work (commute)]()
- 64Less than 5 minutes
- 3155 to 9 minutes
- 19610 to 14 minutes
- 37415 to 19 minutes
- 48120 to 24 minutes
- 17525 to 29 minutes
- 74730 to 34 minutes
- 6735 to 39 minutes
- 7540 to 44 minutes
- 25245 to 59 minutes
- 25460 to 89 minutes
- 5890 or more minutes

Means of transportation to work
![Means of transportation to work]()
- 71.9%2,352Drove a car alone
- 5.3%173Carpooled
- 6.8%223Bus
- 0.8%25Bicycle
- 5.8%190Walked
- 2.2%71Other means
- 11.5%376Worked at home

Time leaving home to go to work
![Time leaving home to go to work]()
- 15712:00 a.m. to 4:59 a.m.
- 815:00 a.m. to 5:29 a.m.
- 1375:30 a.m. to 5:59 a.m.
- 1516:00 a.m. to 6:29 a.m.
- 1576:30 a.m. to 6:59 a.m.
- 4537:00 a.m. to 7:29 a.m.
- 2937:30 a.m. to 7:59 a.m.
- 5328:00 a.m. to 8:29 a.m.
- 858:30 a.m. to 8:59 a.m.
- 4119:00 a.m. to 9:59 a.m.
- 36710:00 a.m. to 10:59 a.m.
- 5911:00 a.m. to 11:59 a.m.
- 17112:00 p.m. to 3:59 p.m.
- 524:00 p.m. to 11:59 p.m.

Occupations of males:
- Percentage of males in management occupations (except farmers):
Here: 12.7% city: 12.9%
- Percentage of males in business and financial operations occupations:
Here: 4.6% city: 4.8%
- Percentage of males in architecture and engineering occupations:
Here: 2.5% city: 4.1%
- Percentage of males in arts, design, entertainment, sports, and media occupations:
Here: 7.9% city: 8.9%
- Percentage of males in service occupations:
Here: 18.5% city: 11.8%
- Percentage of males in sales and office occupations:
Here: 15.3% city: 18.3%
- Percentage of males in construction, extraction, and maintenance occupations:
Here: 3.0% city: 5.5%
- Percentage of males in production occupations:
Here: 6.5% city: 4.2%
- Percentage of males in transportation occupations:
Here: 13.1% city: 6.0%
- Percentage of males in material moving occupations:
Here: 9.2% city: 2.3%
Occupations of females:
- Percentage of females in management occupations (except farmers):
Here: 4.0% city: 10.3%
- Percentage of females in business and financial operations occupations:
Here: 6.3% city: 6.1%
- Percentage of females in computer and mathematical occupations:
Here: 1.1% city: 1.6%
- Percentage of females in architecture and engineering occupations:
Here: 1.4% city: 1.0%
- Percentage of females in community and social services occupations:
Here: 3.0% city: 2.8%
- Percentage of females in education, training, and library occupations:
Here: 4.4% city: 9.4%
- Percentage of females in healthcare practitioners and technical occupations:
Here: 5.6% city: 10.7%
- Percentage of females in service occupations:
Here: 31.9% city: 18.3%
- Percentage of females in sales and office occupations:
Here: 38.2% city: 26.5%
- Percentage of females in production occupations:
Here: 2.5% city: 1.5%
Education in this neighborhood (subdivision or community):
- Percentage of people 3 years and older in K-12 schools:
Pacific Edison: 21.4% Glendale: 14.1%
- Percentage of people 3 years and older in undergraduate colleges:
Pacific Edison: 5.1% Glendale: 5.2%
- Percentage of people 3 years and older in grad. or professional schools:
Pacific Edison: 3.4% Glendale: 1.9%
- Percentage of students K-12 enrolled in private schools:
Pacific Edison: 22.8% Glendale: 9.3%
Percentage of population below poverty level:
| Pacific Edison: | 21.2% |
| Glendale: | 13.0% |
Median year renter moved in (as recorded in 2022):
| Pacific Edison: | 2013 |
| Glendale: | 2018 |
Percentage of married-couple families with both working:
| Pacific Edison: | 59.6% |
| Glendale: | 66.7% |
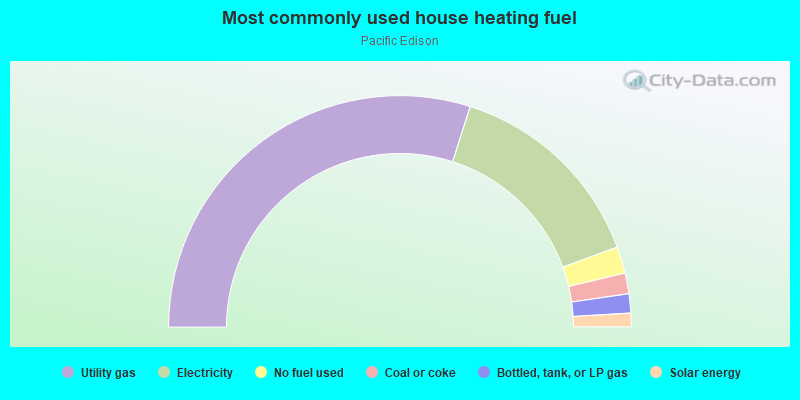
- 59.9%Utility gas
- 29.0%Electricity
- 3.7%No fuel used
- 2.9%Coal or coke
- 2.7%Bottled, tank, or LP gas
- 1.9%Solar energy
Highways in this neighborhood:
San Fernando Rd
Length: 0.43 miles
Directions: E-W, SE-NW
Address range: 4500 to 4699
Directions: E-W, SE-NW
Address range: 4500 to 4699
Roads and streets:
Riverdale Dr
Length: 0.61 miles
Directions: E-W, SE-NW, SW-NE
Address range: 300 to 553
Directions: E-W, SE-NW, SW-NE
Address range: 300 to 553
S Columbus Ave
Length: 0.55 miles
Directions: N-S, SE-NW
Address range: 400 to 1099
Directions: N-S, SE-NW
Address range: 400 to 1099
W Garfield Ave
Length: 0.52 miles
Direction: E-W
Address range: 300 to 549
Direction: E-W
Address range: 300 to 549
W Chevy Chase Dr
Length: 0.46 miles
Direction: E-W
Address range: 300 to 549
Direction: E-W
Address range: 300 to 549
W Maple St
Length: 0.45 miles
Direction: E-W
Address range: 300 to 499
Direction: E-W
Address range: 300 to 499
W Windsor Rd
Length: 0.43 miles
Direction: E-W
Address range: 300 to 499
Direction: E-W
Address range: 300 to 499
W Elk Ave
Length: 0.43 miles
Direction: E-W
Address range: 400 to 555
Direction: E-W
Address range: 400 to 555
Vine St
Length: 0.40 miles
Direction: E-W
Address range: 400 to 598
Direction: E-W
Address range: 400 to 598
S Pacific Ave
Length: 0.39 miles
Direction: N-S
Address range: 300 to 799
Direction: N-S
Address range: 300 to 799
W Acacia Ave
Length: 0.36 miles
Direction: E-W
Address range: 300 to 499
Direction: E-W
Address range: 300 to 499
W Lomita Ave
Length: 0.32 miles
Direction: E-W
Address range: 300 to 499
Direction: E-W
Address range: 300 to 499
W Colorado St
Length: 0.22 miles
Direction: E-W
Address range: 500 to 637
Direction: E-W
Address range: 500 to 637
S Kenilworth Ave
Length: 0.15 miles
Direction: N-S
Address range: 400 to 599
Direction: N-S
Address range: 400 to 599
Colorado St Fwy Exn
Length: 0.12 miles
Directions: E-W, N-S, SE-NW, SW-NE
Directions: E-W, N-S, SE-NW, SW-NE
Virginia Pl
Length: 0.09 miles
Direction: N-S
Address range: 1000 to 1099
Direction: N-S
Address range: 1000 to 1099
Florence Pl
Length: 0.09 miles
Direction: N-S
Address range: 1000 to 1099
Direction: N-S
Address range: 1000 to 1099
Edison Pl
Length: 0.06 miles
Direction: N-S
Direction: N-S
Los Angeles St
Length: 0.06 miles
Directions: E-W, SE-NW
Address range: 816 to 1099
Directions: E-W, SE-NW
Address range: 816 to 1099