North Fillmore (North Fillmore Industrial Park) neighborhood in Fillmore, California (CA), 93015 detailed profile
Settings
X


Business Search - 14 Million verified businesses
Area: 1.122 square miles
Population: 110
Population density:
| North Fillmore (North Fillmore Industrial Park): | 98 people per square mile |
| Fillmore: | 5,923 people per square mile |

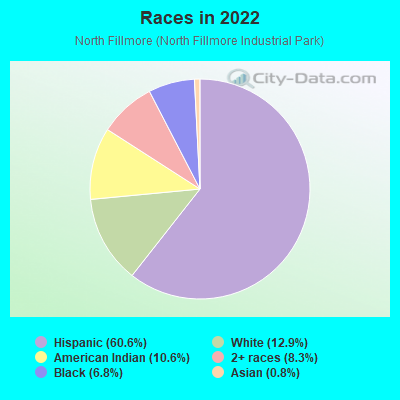
- 8060.6%Hispanic or Latino
- 1712.9%White
- 1410.6%American Indian
- 118.3%Two or more races
- 96.8%Black
- 10.8%Asian
Median household income in 2022:
| North Fillmore (North Fillmore Industrial Park): | $72,386 |
| Fillmore: | $85,255 |
Distribution of median household income
![Distribution of median household income]()
- 8Less than $10,000
- 9$10,000 to $19,999
- 7$20,000 to $29,999
- 38$30,000 to $39,999
- 13$40,000 to $49,999
- 72$50,000 to $59,999
- 3$60,000 to $74,999
- 8$75,000 to $99,999
- 7$100,000 to $124,999
- 1$125,000 to $149,999
- 4$150,000 to $199,999
- 5$200,000 or more

Distribution of owner-occupied house/condo value
![Distribution of owner-occupied house/condo value]()
- 1Less than $50,000
- 18$50,000 to $99,999
- 5$100,000 to $149,999
- 1$150,000 to $199,999
- 7$200,000 to $249,999
- 38$300,000 to $399,999
- 4$400,000 to $499,999
- 10$500,000 to $749,999
- 1$750,000 to $999,999
- 15$1,000,000 or more

Distribution of rent paid by renters
![Distribution of rent paid by renters]()
- 1$200 to $299
- 15$500 to $599
- 10$700 to $799
- 21$800 to $899
- 2$900 to $999
- 2$1,000 to $1,249
- 1$1,250 to $1,499
- 1$1,500 to $1,999
- 9$2,000 or more

Median rent in 2022:
| North Fillmore (North Fillmore Industrial Park): | $2,103 |
| Fillmore: | $1,721 |
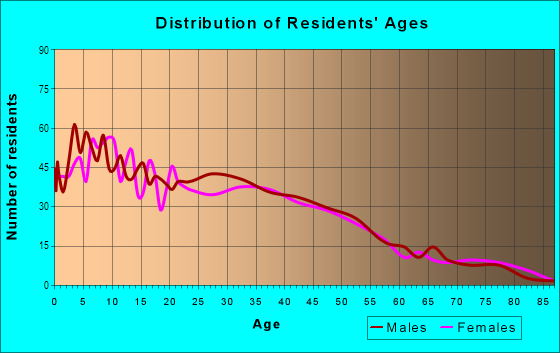
| Males: | 50 |
| Females: | 60 |
Males:
| This neighborhood: | 29.2 years |
| Whole city: | 35.3 years |
| This neighborhood: | 48.1 years |
| Whole city: | 34.6 years |
Average household size:
| North Fillmore (North Fillmore Industrial Park): | 2.4 people |
| Fillmore: | 3.3 people |
Percentage of family households:
| North Fillmore (North Fillmore Industrial Park): | 54.7% |
| Fillmore: | 60.4% |
| Here: | 40.7% |
| Fillmore: | 53.1% |
Percentage of married-couple families with children (among all households):
| North Fillmore (North Fillmore Industrial Park): | 31.8% |
| Fillmore: | 22.7% |
Percentage of single-mother households (among all households):
| North Fillmore (North Fillmore Industrial Park): | 10.4% |
| Fillmore: | 5.9% |
Percentage of never married males 15 years old and over:
Percentage of never married females 15 years old and over:
| North Fillmore (North Fillmore Industrial Park): | 10.2% |
| Fillmore: | 20.0% |
Percentage of never married females 15 years old and over:
| North Fillmore (North Fillmore Industrial Park): | 13.0% |
| city: | 17.2% |
Percentage of people that speak English not well or not at all:
| North Fillmore (North Fillmore Industrial Park): | 18.9% |
| Fillmore: | 9.6% |
Percentage of people born in this state:
Percentage of people born in another U.S. state:
Percentage of native residents but born outside the U.S.:
Percentage of foreign born residents:
| Here: | 72.6% |
| Fillmore: | 73.9% |
Percentage of people born in another U.S. state:
| North Fillmore (North Fillmore Industrial Park): | 8.2% |
| Fillmore: | 6.1% |
Percentage of native residents but born outside the U.S.:
| Here: | 0.6% |
| city: | 0.8% |
Percentage of foreign born residents:
| Here: | 18.7% |
| Fillmore: | 19.2% |
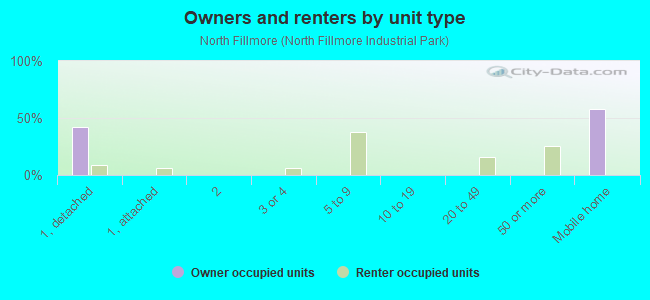
Owner-occupied
Renter-occupied

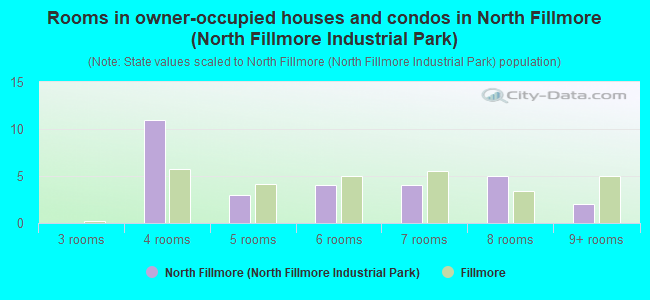
- Rooms in owner-occupied houses and condos in North Fillmore <
> - 01 room
- 02 rooms
- 03 rooms
- 114 rooms
- 35 rooms
- 46 rooms
- 47 rooms
- 58 rooms
- 29+ rooms
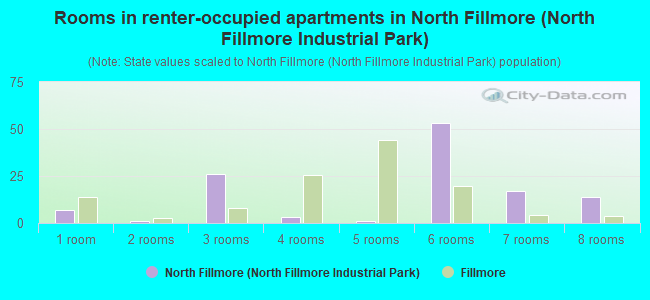
- Rooms in renter-occupied apartments in North Fillmore <
> - 71 room
- 12 rooms
- 263 rooms
- 34 rooms
- 15 rooms
- 536 rooms
- 177 rooms
- 148 rooms
- 09+ rooms
Owner-occupied
Renter-occupied
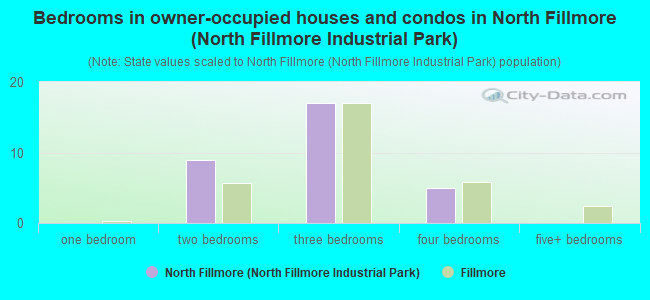
- Bedrooms in owner-occupied houses and condos in North Fillmore <
> - 0no bedroom
- 01 bedroom
- 92 bedrooms
- 173 bedrooms
- 54 bedrooms
- 05+ bedrooms

- Bedrooms in renter-occupied apartments in North Fillmore <
> - 8no bedroom
- 21 bedroom
- 12 bedrooms
- 13 bedrooms
- 304 bedrooms
- 05+ bedrooms
Average number of cars or other vehicles available in houses/condos:
Average number of cars or other vehicles available in apartments:
| This neighborhood: | 1.9 |
| Fillmore: | 2.5 |
Average number of cars or other vehicles available in apartments:
| Here: | 1.2 |
| city: | 1.7 |
Percentage of units with a mortgage:
| North Fillmore (North Fillmore Industrial Park): | 70.6% |
| Fillmore: | 64.0% |
Housing prices:
- Average estimated value of detached houses in 2022 (34.0% of all units):
North Fillmore (North Fillmore Industrial Park): $584,516 California: $988,808
- Average estimated value of mobile home in 2022 (40.0% of all units):
North Fillmore (North Fillmore Industrial Park): $135,839 California: $184,506
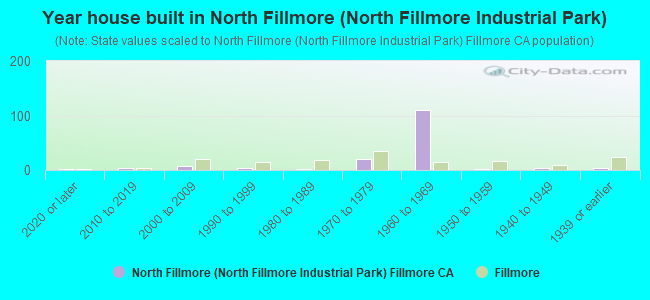
- Year house built in North Fillmore <
> - 12020 or later
- 42010 to 2019
- 72000 to 2009
- 41990 to 1999
- 21980 to 1989
- 201970 to 1979
- 1111960 to 1969
- 11950 to 1959
- 41940 to 1949
- 31939 or earlier
City-data.com crime index for city in 2020 (higher means more crime):
| City: | 105.8 |
| U.S. average: | 219.5 |
Travel time to work (commute)
![Travel time to work (commute)]()
- 98Less than 5 minutes
- 685 to 9 minutes
- 14610 to 14 minutes
- 7215 to 19 minutes
- 7820 to 24 minutes
- 7725 to 29 minutes
- 17130 to 34 minutes
- 4535 to 39 minutes
- 6540 to 44 minutes
- 445 to 59 minutes
- 9660 to 89 minutes
- 6990 or more minutes

Means of transportation to work
![Means of transportation to work]()
- 85.0%50Drove a car alone
- 10.2%6Carpooled
- 20.4%12Bus
- 3.4%2Bicycle
- 20.4%12Walked
- 11.9%7Other means
- 1.7%1Worked at home

Time leaving home to go to work
![Time leaving home to go to work]()
- 7812:00 a.m. to 4:59 a.m.
- 215:00 a.m. to 5:29 a.m.
- 1715:30 a.m. to 5:59 a.m.
- 346:00 a.m. to 6:29 a.m.
- 956:30 a.m. to 6:59 a.m.
- 1437:00 a.m. to 7:29 a.m.
- 1217:30 a.m. to 7:59 a.m.
- 1058:00 a.m. to 8:29 a.m.
- 328:30 a.m. to 8:59 a.m.
- 959:00 a.m. to 9:59 a.m.
- 5911:00 a.m. to 11:59 a.m.
- 9012:00 p.m. to 3:59 p.m.
- 1014:00 p.m. to 11:59 p.m.

Occupations of males:
- Percentage of males in management occupations (except farmers):
Here: 15.9% city: 10.4%
- Percentage of males in business and financial operations occupations:
Here: 2.9% city: 2.4%
- Percentage of males in computer and mathematical occupations:
Here: 6.7% city: 1.9%
- Percentage of males in architecture and engineering occupations:
Here: 57.2% city: 3.2%
- Percentage of males in education, training, and library occupations:
Here: 4.0% city: 0.8%
- Percentage of males in arts, design, entertainment, sports, and media occupations:
Here: 16.4% city: 0.4%
- Percentage of males in service occupations:
Here: 8.5% city: 18.9%
- Percentage of males in sales and office occupations:
Here: 10.6% city: 14.8%
- Percentage of males in farming, fishing, and forestry occupations:
Here: 8.0% city: 9.6%
- Percentage of males in construction, extraction, and maintenance occupations:
Here: 20.1% city: 8.0%
- Percentage of males in production occupations:
Here: 22.5% city: 8.9%
- Percentage of males in material moving occupations:
Here: 79.7% city: 6.1%
Occupations of females:
- Percentage of females in management occupations (except farmers):
Here: 14.6% city: 6.8%
- Percentage of females in business and financial operations occupations:
Here: 2.3% city: 4.6%
- Percentage of females in architecture and engineering occupations:
Here: 88.4% city: 2.5%
- Percentage of females in community and social services occupations:
Here: 10.4% city: 5.0%
- Percentage of females in education, training, and library occupations:
Here: 65.2% city: 3.9%
- Percentage of females in arts, design, entertainment, sports, and media occupations:
Here: 5.3% city: 1.8%
- Percentage of females in service occupations:
Here: 41.5% city: 21.3%
- Percentage of females in sales and office occupations:
Here: 15.4% city: 29.7%
- Percentage of females in farming, fishing, and forestry occupations:
Here: 91.2% city: 4.5%
- Percentage of females in production occupations:
Here: 54.0% city: 3.4%
- Percentage of females in transportation occupations:
Here: 23.3% city: 1.2%
- Percentage of females in material moving occupations:
Here: 9.6% city: 1.7%
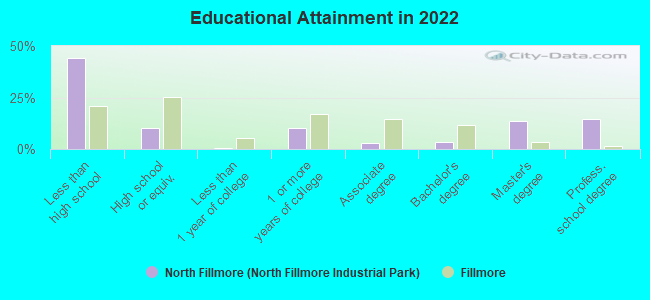
Education in this neighborhood (subdivision or community):
- Percentage of people 3 years and older in K-12 schools:
North Fillmore (North Fillmore Industrial Park): 50.9% Fillmore: 20.8%
- Percentage of people 3 years and older in undergraduate colleges:
North Fillmore (North Fillmore Industrial Park): 45.5% Fillmore: 8.0%
- Percentage of people 3 years and older in grad. or professional schools:
North Fillmore (North Fillmore Industrial Park): 0.0% Fillmore: 0.0%
- Percentage of students K-12 enrolled in private schools:
North Fillmore (North Fillmore Industrial Park): 10.7% Fillmore: 10.8%
Percentage of population below poverty level:
| North Fillmore (North Fillmore Industrial Park): | 8.1% |
| Fillmore: | 6.8% |
Median year owner moved in (as recorded in 2022):
Median year renter moved in (as recorded in 2022):
| North Fillmore (North Fillmore Industrial Park): | 2012 |
| Fillmore: | 2006 |
Median year renter moved in (as recorded in 2022):
| North Fillmore (North Fillmore Industrial Park): | 2014 |
| Fillmore: | 2013 |
Percentage of married-couple families with both working:
| North Fillmore (North Fillmore Industrial Park): | 93.0% |
| Fillmore: | 59.6% |

- 61.7%Utility gas
- 18.0%Electricity
- 12.9%No fuel used
- 6.6%Solar energy
- 0.8%Bottled, tank, or LP gas
Roads and streets:
4th St
Length: 1.61 miles
Directions: E-W, SE-NW, SW-NE
Address range: 1 to 899
Directions: E-W, SE-NW, SW-NE
Address range: 1 to 899
3rd St
Length: 1.49 miles
Directions: E-W, SE-NW
Address range: 147 to 999
Directions: E-W, SE-NW
Address range: 147 to 999
Blaine Ave
Length: 0.97 miles
Direction: E-W
Address range: 200 to 998
Direction: E-W
Address range: 200 to 998
B St
Length: 0.66 miles
Direction: N-S
Address range: 700 to 1199
Direction: N-S
Address range: 700 to 1199
Foothill Dr
Length: 0.62 miles
Directions: E-W, N-S, SE-NW, SW-NE
Address range: 200 to 1009
Directions: E-W, N-S, SE-NW, SW-NE
Address range: 200 to 1009
Goodenough Rd
Length: 0.58 miles
Directions: N-S, SE-NW, SW-NE
Address range: 1100 to 1295
Directions: N-S, SE-NW, SW-NE
Address range: 1100 to 1295
5th St
Length: 0.49 miles
Direction: E-W
Address range: 700 to 899
Direction: E-W
Address range: 700 to 899
Griffan Dr
Length: 0.49 miles
Directions: E-W, N-S, SE-NW, SW-NE
Directions: E-W, N-S, SE-NW, SW-NE
A St
Length: 0.48 miles
Directions: N-S, SE-NW
Address range: 700 to 999
Directions: N-S, SE-NW
Address range: 700 to 999
Goodenough Dr (6th St)
Length: 0.47 miles
Directions: E-W, SE-NW, SW-NE
Directions: E-W, SE-NW, SW-NE
Levee Dr (Goodenough Rd)
Length: 0.43 miles
Directions: E-W, N-S, SW-NE
Directions: E-W, N-S, SW-NE
Hinckley Ln
Length: 0.38 miles
Directions: E-W, N-S, SE-NW, SW-NE
Address range: 1000 to 1099
Directions: E-W, N-S, SE-NW, SW-NE
Address range: 1000 to 1099
Padelford Rd
Length: 0.37 miles
Directions: E-W, N-S, SE-NW, SW-NE
Address range: 100 to 510
Directions: E-W, N-S, SE-NW, SW-NE
Address range: 100 to 510
Meadowlark Dr
Length: 0.36 miles
Directions: E-W, SE-NW
Address range: 948 to 1199
Directions: E-W, SE-NW
Address range: 948 to 1199
7th St
Length: 0.35 miles
Direction: E-W
Address range: 600 to 699
Direction: E-W
Address range: 600 to 699
Hunter Dr
Length: 0.34 miles
Directions: E-W, N-S, SE-NW
Directions: E-W, N-S, SE-NW
Central Ave
Length: 0.32 miles
Direction: N-S
Address range: 700 to 949
Direction: N-S
Address range: 700 to 949
8th St
Length: 0.29 miles
Directions: E-W, SW-NE
Directions: E-W, SW-NE
Edison Ln
Length: 0.29 miles
Direction: E-W
Address range: 700 to 999
Direction: E-W
Address range: 700 to 999
Woodgrove Rd
Length: 0.28 miles
Directions: E-W, N-S, SE-NW, SW-NE
Address range: 800 to 899
Directions: E-W, N-S, SE-NW, SW-NE
Address range: 800 to 899
C St
Length: 0.22 miles
Directions: N-S, SW-NE
Address range: 590 to 799
Directions: N-S, SW-NE
Address range: 590 to 799
Morris Dr
Length: 0.22 miles
Directions: E-W, N-S, SE-NW
Address range: 500 to 600
Directions: E-W, N-S, SE-NW
Address range: 500 to 600
Fine St
Length: 0.21 miles
Directions: E-W, N-S, SE-NW
Address range: 700 to 837
Directions: E-W, N-S, SE-NW
Address range: 700 to 837
Old Telegraph Rd
Length: 0.19 miles
Direction: SE-NW
Address range: 786 to 799
Direction: SE-NW
Address range: 786 to 799
Arundell Cir
Length: 0.19 miles
Directions: E-W, N-S, SE-NW, SW-NE
Address range: 100 to 599
Directions: E-W, N-S, SE-NW, SW-NE
Address range: 100 to 599
Falcon Way
Length: 0.19 miles
Directions: E-W, N-S, SE-NW, SW-NE
Address range: 600 to 1099
Directions: E-W, N-S, SE-NW, SW-NE
Address range: 600 to 1099
Candelaria
Length: 0.18 miles
Directions: E-W, N-S, SE-NW, SW-NE
Directions: E-W, N-S, SE-NW, SW-NE
Arrasmith Ln
Length: 0.18 miles
Directions: E-W, N-S, SE-NW
Address range: 900 to 1099
Directions: E-W, N-S, SE-NW
Address range: 900 to 1099
Taylor Ln
Length: 0.16 miles
Directions: E-W, N-S
Address range: 901 to 991
Directions: E-W, N-S
Address range: 901 to 991
Stonehedge Dr
Length: 0.16 miles
Directions: E-W, N-S, SE-NW
Address range: 500 to 599
Directions: E-W, N-S, SE-NW
Address range: 500 to 599
Fernglen Cir
Length: 0.15 miles
Directions: E-W, N-S, SE-NW, SW-NE
Address range: 600 to 699
Directions: E-W, N-S, SE-NW, SW-NE
Address range: 600 to 699
Lemon Way
Length: 0.14 miles
Directions: E-W, N-S, SE-NW
Address range: 600 to 699
Directions: E-W, N-S, SE-NW
Address range: 600 to 699
Manzanita Dr
Length: 0.14 miles
Directions: E-W, N-S, SW-NE
Address range: 600 to 699
Directions: E-W, N-S, SW-NE
Address range: 600 to 699
Island View St
Length: 0.13 miles
Direction: N-S
Address range: 700 to 799
Direction: N-S
Address range: 700 to 799
Saratoga St
Length: 0.13 miles
Direction: N-S
Direction: N-S
Mountain View St
Length: 0.13 miles
Direction: N-S
Address range: 661 to 999
Direction: N-S
Address range: 661 to 999
Edison Way
Length: 0.13 miles
Direction: N-S
Direction: N-S
Akers St
Length: 0.13 miles
Direction: N-S
Address range: 700 to 799
Direction: N-S
Address range: 700 to 799
Harthorn Ln
Length: 0.13 miles
Directions: E-W, N-S, SE-NW, SW-NE
Address range: 1000 to 1099
Directions: E-W, N-S, SE-NW, SW-NE
Address range: 1000 to 1099
Walker Ln
Length: 0.11 miles
Directions: E-W, N-S
Address range: 501 to 799
Directions: E-W, N-S
Address range: 501 to 799
Valley Vis
Length: 0.11 miles
Directions: E-W, N-S, SE-NW, SW-NE
Address range: 800 to 852
Directions: E-W, N-S, SE-NW, SW-NE
Address range: 800 to 852
Shady Ln
Length: 0.10 miles
Directions: N-S, SW-NE
Address range: 1100 to 1199
Directions: N-S, SW-NE
Address range: 1100 to 1199
Mockingbird Ln
Length: 0.10 miles
Directions: N-S, SE-NW
Address range: 401 to 599
Directions: N-S, SE-NW
Address range: 401 to 599
Catalina Ct
Length: 0.10 miles
Directions: E-W, N-S, SE-NW, SW-NE
Address range: 950 to 965
Directions: E-W, N-S, SE-NW, SW-NE
Address range: 950 to 965
Maple Ct
Length: 0.10 miles
Directions: E-W, SW-NE
Address range: 600 to 699
Directions: E-W, SW-NE
Address range: 600 to 699
Oriole Cir
Length: 0.10 miles
Direction: E-W
Address range: 1100 to 1199
Direction: E-W
Address range: 1100 to 1199
Boulder St
Length: 0.08 miles
Direction: N-S
Address range: 600 to 699
Direction: N-S
Address range: 600 to 699
Country Ct
Length: 0.08 miles
Directions: E-W, SE-NW
Address range: 600 to 699
Directions: E-W, SE-NW
Address range: 600 to 699
Chaparral St
Length: 0.08 miles
Direction: N-S
Address range: 628 to 699
Direction: N-S
Address range: 628 to 699
Eagle Ct
Length: 0.08 miles
Direction: N-S
Address range: 600 to 699
Direction: N-S
Address range: 600 to 699
2nd St
Length: 0.08 miles
Directions: E-W, N-S
Address range: 900 to 999
Directions: E-W, N-S
Address range: 900 to 999
Mesa Dr
Length: 0.08 miles
Directions: E-W, N-S, SE-NW, SW-NE
Address range: 800 to 899
Directions: E-W, N-S, SE-NW, SW-NE
Address range: 800 to 899
Carrillo Ct
Length: 0.07 miles
Directions: E-W, N-S, SE-NW
Address range: 952 to 1061
Directions: E-W, N-S, SE-NW
Address range: 952 to 1061
Ash Cir
Length: 0.06 miles
Directions: E-W, SE-NW
Address range: 599 to 699
Directions: E-W, SE-NW
Address range: 599 to 699
Via Rodeo
Length: 0.06 miles
Direction: N-S
Address range: 500 to 699
Direction: N-S
Address range: 500 to 699
Tighe Ln
Length: 0.05 miles
Direction: N-S
Address range: 700 to 799
Direction: N-S
Address range: 700 to 799
Galvin Ln
Length: 0.05 miles
Direction: N-S
Address range: 700 to 799
Direction: N-S
Address range: 700 to 799
Finch Ct
Length: 0.04 miles
Direction: N-S
Address range: 550 to 599
Direction: N-S
Address range: 550 to 599
Fremlin Dr
Length: 0.04 miles
Direction: SW-NE
Direction: SW-NE
Arrasmith Ct
Length: 0.03 miles
Direction: E-W
Direction: E-W
Lockhart Ln
Length: 0.03 miles
Direction: E-W
Address range: 600 to 699
Direction: E-W
Address range: 600 to 699
Canyon Vw
Length: 0.03 miles
Direction: N-S
Address range: 800 to 899
Direction: N-S
Address range: 800 to 899
Railroad features:
Union Pacific RR
Length: 0.16 miles
Direction: SE-NW
Direction: SE-NW
Other features:
Pole Crk
Length: 0.49 miles
Directions: E-W, N-S, SE-NW, SW-NE
Directions: E-W, N-S, SE-NW, SW-NE