Mission Dolores neighborhood in San Francisco, California (CA), 94103, 94110, 94114 detailed profile
Settings
X


Business Search - 14 Million verified businesses
Area: 0.279 square miles
Population: 10,740
Population density:
| Mission Dolores: | 38,450 people per square mile |
| San Francisco: | 17,313 people per square mile |

- 6,81163.4%White
- 1,62515.1%Asian
- 1,08310.1%Two or more races
- 9408.8%Hispanic or Latino
- 2782.6%Black

Median household income in 2022:
| Mission Dolores: | $161,558 |
| San Francisco: | $136,692 |
Distribution of median household income
![Distribution of median household income]()
- 272Less than $10,000
- 214$10,000 to $19,999
- 131$20,000 to $29,999
- 277$30,000 to $39,999
- 327$40,000 to $49,999
- 91$50,000 to $59,999
- 66$60,000 to $74,999
- 1,176$75,000 to $99,999
- 436$100,000 to $124,999
- 562$125,000 to $149,999
- 745$150,000 to $199,999
- 3,102$200,000 or more

Distribution of owner-occupied house/condo value
![Distribution of owner-occupied house/condo value]()
- 477$100,000 to $149,999
- 45$300,000 to $399,999
- 346$500,000 to $749,999
- 667$750,000 to $999,999
- 1,412$1,000,000 or more

Distribution of rent paid by renters
![Distribution of rent paid by renters]()
- 36$300 to $399
- 60$600 to $699
- 83$700 to $799
- 67$800 to $899
- 294$1,000 to $1,249
- 206$1,250 to $1,499
- 735$1,500 to $1,999
- 2,666$2,000 or more

Median rent in 2022:
| Mission Dolores: | $2,701 |
| San Francisco: | $2,001 |
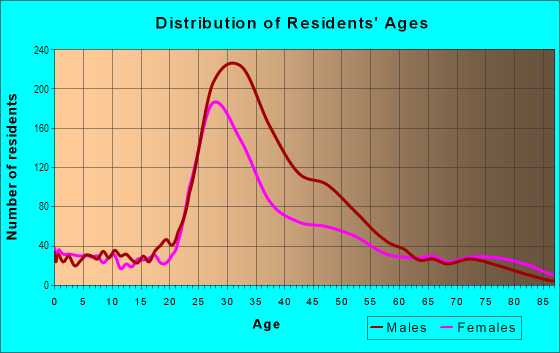
| Males: | 6,477 |
| Females: | 4,262 |
Males:
| This neighborhood: | 42.8 years |
| Whole city: | 40.3 years |
| This neighborhood: | 37.7 years |
| Whole city: | 40.5 years |
Average household size:
| Mission Dolores: | 1.6 people |
| San Francisco: | 2.2 people |
Percentage of family households:
| Mission Dolores: | 23.3% |
| San Francisco: | 30.3% |
| Here: | 20.7% |
| San Francisco: | 35.3% |
Percentage of married-couple families with children (among all households):
| Mission Dolores: | 22.5% |
| San Francisco: | 35.9% |
Percentage of single-mother households (among all households):
| Mission Dolores: | 34.4% |
| San Francisco: | 6.0% |
Percentage of never married males 15 years old and over:
Percentage of never married females 15 years old and over:
| Mission Dolores: | 41.8% |
| San Francisco: | 24.6% |
Percentage of never married females 15 years old and over:
| Mission Dolores: | 15.7% |
| city: | 19.9% |
Percentage of people that speak English not well or not at all:
| Mission Dolores: | 1.4% |
| San Francisco: | 10.9% |
Percentage of people born in this state:
Percentage of people born in another U.S. state:
Percentage of native residents but born outside the U.S.:
Percentage of foreign born residents:
| Here: | 33.2% |
| San Francisco: | 40.8% |
Percentage of people born in another U.S. state:
| Mission Dolores: | 38.1% |
| San Francisco: | 23.4% |
Percentage of native residents but born outside the U.S.:
| Here: | 8.9% |
| city: | 2.6% |
Percentage of foreign born residents:
| Here: | 19.8% |
| San Francisco: | 33.2% |

Owner-occupied
Renter-occupied


- Rooms in owner-occupied houses and condos in Mission Dolores
- 01 room
- 562 rooms
- 983 rooms
- 5434 rooms
- 9745 rooms
- 8156 rooms
- 1017 rooms
- 908 rooms
- 419+ rooms

- Rooms in renter-occupied apartments in Mission Dolores
- 4261 room
- 1,1922 rooms
- 1,2653 rooms
- 7304 rooms
- 5795 rooms
- 1976 rooms
- 837 rooms
- 578 rooms
- 189+ rooms
Owner-occupied
Renter-occupied

- Bedrooms in owner-occupied houses and condos in Mission Dolores
- 0no bedroom
- 7051 bedroom
- 1,2482 bedrooms
- 5993 bedrooms
- 574 bedrooms
- 325+ bedrooms

- Bedrooms in renter-occupied apartments in Mission Dolores
- 589no bedroom
- 1,6021 bedroom
- 1,5142 bedrooms
- 3103 bedrooms
- 1724 bedrooms
- 05+ bedrooms
Average number of cars or other vehicles available in houses/condos:
Average number of cars or other vehicles available in apartments:
| This neighborhood: | 1.0 |
| San Francisco: | 1.5 |
Average number of cars or other vehicles available in apartments:
| Here: | 0.6 |
| city: | 0.8 |
Percentage of units with a mortgage:
| Mission Dolores: | 67.4% |
| San Francisco: | 62.3% |
Housing prices:
- Average estimated value of detached houses in 2022 (2.2% of all units):
Mission Dolores: $1,090,349 San Francisco: $1,942,973
- Average estimated value of townhouses or other attached units in 2022 (2.5% of all units):
This neighborhood: $1,423,254 city: $1,528,422
- Average estimated value of housing units in 2-unit structures in 2022 (11.6% of all units):
This neighborhood: $1,343,564 San Francisco: $1,536,932
- Average estimated '22 value of housing units in 3-to-4-unit structures (26.8% of all units):
Mission Dolores: $1,092,872 city: $1,622,965
- Average estimated '22 value of housing units in 5-or-more-unit structures (15.8% of all units):
Mission Dolores: $1,354,368 San Francisco: $1,155,972

- Year house built in Mission Dolores
- 02020 or later
- 4352010 to 2019
- 2132000 to 2009
- 1941990 to 1999
- 5721980 to 1989
- 2051970 to 1979
- 1,2051960 to 1969
- 1621950 to 1959
- 3991940 to 1949
- 4,3871939 or earlier

City-data.com crime index for city in 2020 (higher means more crime):
| City: | 387.4 |
| U.S. average: | 219.5 |
Travel time to work (commute)
![Travel time to work (commute)]()
- 35Less than 5 minutes
- 945 to 9 minutes
- 18810 to 14 minutes
- 72915 to 19 minutes
- 85920 to 24 minutes
- 54925 to 29 minutes
- 51130 to 34 minutes
- 8335 to 39 minutes
- 13440 to 44 minutes
- 35045 to 59 minutes
- 43960 to 89 minutes
- 17790 or more minutes

Means of transportation to work
![Means of transportation to work]()
- 13.2%1,095Drove a car alone
- 1.3%106Carpooled
- 10.0%824Bus
- 18.0%1,487Subway or elevated rail
- 1.2%103Long-distance train or commuter rail
- 1.0%82Light rail, streetcar or trolley
- 0.3%26Ferryboat
- 0.9%75Taxi
- 0.9%73Motorcycle
- 6.5%536Bicycle
- 8.8%726Walked
- 0.6%51Other means
- 39.8%3,289Worked at home

Time leaving home to go to work
![Time leaving home to go to work]()
- 8012:00 a.m. to 4:59 a.m.
- 515:00 a.m. to 5:29 a.m.
- 185:30 a.m. to 5:59 a.m.
- 2236:00 a.m. to 6:29 a.m.
- 1186:30 a.m. to 6:59 a.m.
- 4797:00 a.m. to 7:29 a.m.
- 4397:30 a.m. to 7:59 a.m.
- 8138:00 a.m. to 8:29 a.m.
- 5658:30 a.m. to 8:59 a.m.
- 5959:00 a.m. to 9:59 a.m.
- 33910:00 a.m. to 10:59 a.m.
- 15611:00 a.m. to 11:59 a.m.
- 18312:00 p.m. to 3:59 p.m.
- 1054:00 p.m. to 11:59 p.m.

Occupations of males:
- Percentage of males in management occupations (except farmers):
Here: 26.9% city: 17.2%
- Percentage of males in business and financial operations occupations:
Here: 9.4% city: 8.9%
- Percentage of males in computer and mathematical occupations:
Here: 16.9% city: 14.6%
- Percentage of males in architecture and engineering occupations:
Here: 4.1% city: 4.0%
- Percentage of males in life, physical, and social science occupations:
Here: 1.5% city: 2.4%
- Percentage of males in community and social services occupations:
Here: 2.5% city: 1.0%
- Percentage of males in education, training, and library occupations:
Here: 4.8% city: 3.4%
- Percentage of males in arts, design, entertainment, sports, and media occupations:
Here: 5.4% city: 4.9%
- Percentage of males in service occupations:
Here: 7.7% city: 11.8%
- Percentage of males in sales and office occupations:
Here: 14.2% city: 13.5%
- Percentage of males in production occupations:
Here: 3.9% city: 2.5%
Occupations of females:
- Percentage of females in management occupations (except farmers):
Here: 14.8% city: 15.8%
- Percentage of females in business and financial operations occupations:
Here: 19.0% city: 11.5%
- Percentage of females in computer and mathematical occupations:
Here: 3.8% city: 5.1%
- Percentage of females in architecture and engineering occupations:
Here: 1.3% city: 1.6%
- Percentage of females in life, physical, and social science occupations:
Here: 6.1% city: 2.9%
- Percentage of females in community and social services occupations:
Here: 1.1% city: 1.6%
- Percentage of females in legal occupations:
Here: 1.7% city: 3.0%
- Percentage of females in education, training, and library occupations:
Here: 10.1% city: 7.1%
- Percentage of females in arts, design, entertainment, sports, and media occupations:
Here: 12.3% city: 5.1%
- Percentage of females in healthcare practitioners and technical occupations:
Here: 4.7% city: 8.4%
- Percentage of females in service occupations:
Here: 2.7% city: 15.4%
- Percentage of females in sales and office occupations:
Here: 21.1% city: 19.3%
- Percentage of females in production occupations:
Here: 2.4% city: 1.5%
Education in this neighborhood (subdivision or community):
- Percentage of people 3 years and older in K-12 schools:
Mission Dolores: 3.5% San Francisco: 9.7%
- Percentage of people 3 years and older in undergraduate colleges:
Mission Dolores: 0.7% San Francisco: 4.8%
- Percentage of people 3 years and older in grad. or professional schools:
Mission Dolores: 6.2% San Francisco: 2.6%
- Percentage of students K-12 enrolled in private schools:
Mission Dolores: 7.0% San Francisco: 36.5%
Percentage of population below poverty level:
| Mission Dolores: | 5.0% |
| San Francisco: | 10.4% |
Median year owner moved in (as recorded in 2022):
Median year renter moved in (as recorded in 2022):
| Mission Dolores: | 2010 |
| San Francisco: | 2007 |
Median year renter moved in (as recorded in 2022):
| Mission Dolores: | 2017 |
| San Francisco: | 2019 |
Percentage of married-couple families with both working:
| Mission Dolores: | 103.1% |
| San Francisco: | 75.9% |

- 56.5%Utility gas
- 33.5%Electricity
- 6.0%No fuel used
- 2.1%Bottled, tank, or LP gas
- 1.0%Other fuel
- 0.9%Solar energy
Roads and streets:
Guerrero St
Length: 1.48 miles
Directions: N-S, SE-NW
Address range: 101 to 749
Directions: N-S, SE-NW
Address range: 101 to 749
Dolores St
Length: 1.32 miles
Directions: N-S, SE-NW, SW-NE
Address range: 101 to 649
Directions: N-S, SE-NW, SW-NE
Address range: 101 to 649
16th St
Length: 0.34 miles
Direction: E-W
Address range: 3133 to 3349
Direction: E-W
Address range: 3133 to 3349
15th St
Length: 0.31 miles
Direction: E-W
Address range: 1751 to 1949
Direction: E-W
Address range: 1751 to 1949
17th St
Length: 0.31 miles
Direction: E-W
Address range: 3438 to 3639
Direction: E-W
Address range: 3438 to 3639
18th St
Length: 0.25 miles
Direction: E-W
Address range: 3538 to 3699
Direction: E-W
Address range: 3538 to 3699
19th St
Length: 0.25 miles
Direction: E-W
Address range: 3531 to 3699
Direction: E-W
Address range: 3531 to 3699
14th St
Length: 0.24 miles
Direction: E-W
Address range: 500 to 651
Direction: E-W
Address range: 500 to 651
Landers St
Length: 0.22 miles
Directions: N-S, SE-NW
Address range: 1 to 199
Directions: N-S, SE-NW
Address range: 1 to 199
Albion St
Length: 0.22 miles
Direction: N-S
Address range: 1 to 199
Direction: N-S
Address range: 1 to 199
Linda St
Length: 0.20 miles
Directions: N-S, SW-NE
Address range: 1 to 199
Directions: N-S, SW-NE
Address range: 1 to 199
Dorland St
Length: 0.15 miles
Directions: E-W, SW-NE
Address range: 1 to 99
Directions: E-W, SW-NE
Address range: 1 to 99
Cumberland St
Length: 0.15 miles
Direction: E-W
Address range: 1 to 99
Direction: E-W
Address range: 1 to 99
Elgin Park
Length: 0.12 miles
Direction: N-S
Address range: 1 to 99
Direction: N-S
Address range: 1 to 99
Dearborn St
Length: 0.11 miles
Directions: N-S, SE-NW
Address range: 1 to 76
Directions: N-S, SE-NW
Address range: 1 to 76
Ramona Ave (Ramona St)
Length: 0.11 miles
Direction: N-S
Address range: 1 to 99
Direction: N-S
Address range: 1 to 99
Lapidge St
Length: 0.11 miles
Direction: N-S
Address range: 1 to 99
Direction: N-S
Address range: 1 to 99
Oakwood St
Length: 0.11 miles
Direction: N-S
Address range: 1 to 99
Direction: N-S
Address range: 1 to 99
Duboce Ave
Length: 0.10 miles
Direction: E-W
Address range: 132 to 199
Direction: E-W
Address range: 132 to 199
Dolores Ter
Length: 0.09 miles
Direction: E-W
Address range: 1 to 99
Direction: E-W
Address range: 1 to 99
Alert Aly
Length: 0.08 miles
Direction: E-W
Address range: 1 to 99
Direction: E-W
Address range: 1 to 99
Camp St
Length: 0.08 miles
Direction: E-W
Address range: 1 to 99
Direction: E-W
Address range: 1 to 99
Clinton Park
Length: 0.08 miles
Direction: E-W
Address range: 200 to 250
Direction: E-W
Address range: 200 to 250
Chula Ln
Length: 0.06 miles
Direction: E-W
Address range: 1 to 48
Direction: E-W
Address range: 1 to 48
Hidalgo Ter
Length: 0.06 miles
Direction: E-W
Address range: 1 to 99
Direction: E-W
Address range: 1 to 99
Pearl St
Length: 0.06 miles
Direction: N-S
Address range: 42 to 99
Direction: N-S
Address range: 42 to 99
Rosemont Pl
Length: 0.06 miles
Direction: N-S
Address range: 1 to 99
Direction: N-S
Address range: 1 to 99
Abbey St
Length: 0.06 miles
Direction: N-S
Address range: 1 to 99
Direction: N-S
Address range: 1 to 99
Gaiser Ct
Length: 0.04 miles
Direction: E-W
Address range: 1 to 99
Direction: E-W
Address range: 1 to 99
Bird St
Length: 0.04 miles
Direction: E-W
Address range: 1 to 99
Direction: E-W
Address range: 1 to 99
Spencer Aly (Spencer St)
Length: 0.03 miles
Direction: N-S
Address range: 1 to 99
Direction: N-S
Address range: 1 to 99
Pink Aly
Length: 0.02 miles
Direction: E-W
Address range: 1 to 99
Direction: E-W
Address range: 1 to 99
McCoppin St
Length: 0.01 miles
Direction: E-W
Address range: 117 to 162
Direction: E-W
Address range: 117 to 162