Midtown-Edmondson neighborhood in Baltimore, Maryland (MD), 21223, 21216, 21217 detailed profile
Settings
X


Business Search - 14 Million verified businesses
Area: 0.146 square miles
Population: 1,451
Population density:
| Midtown-Edmondson: | 9,927 people per square mile |
| Baltimore: | 7,053 people per square mile |

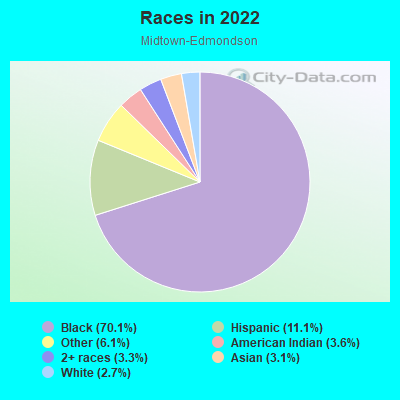
- 1,35070.1%Black
- 21311.1%Hispanic or Latino
- 1186.1%Some other race
- 693.6%American Indian
- 633.3%Two or more races
- 603.1%Asian
- 522.7%White
Distribution of median household income
![Distribution of median household income]()
- 121Less than $10,000
- 185$10,000 to $19,999
- 189$20,000 to $29,999
- 163$30,000 to $39,999
- 166$40,000 to $49,999
- 116$50,000 to $59,999
- 66$60,000 to $74,999
- 65$75,000 to $99,999
- 141$100,000 to $124,999
- 61$125,000 to $149,999
- 56$150,000 to $199,999
- 9$200,000 or more

Distribution of owner-occupied house/condo value
![Distribution of owner-occupied house/condo value]()
- 334Less than $50,000
- 379$50,000 to $99,999
- 74$100,000 to $149,999
- 67$150,000 to $199,999
- 22$200,000 to $249,999
- 96$250,000 to $299,999
- 11$300,000 to $399,999
- 35$400,000 to $499,999
- 7$500,000 to $749,999
- 96$750,000 to $999,999

Distribution of rent paid by renters
![Distribution of rent paid by renters]()
- 112Less than $100
- 106$100 to $199
- 416$200 to $299
- 15$300 to $399
- 78$400 to $499
- 22$500 to $599
- 198$600 to $699
- 148$700 to $799
- 69$800 to $899
- 62$900 to $999
- 117$1,000 to $1,249
- 206$1,250 to $1,499
- 114$1,500 to $1,999
- 11$2,000 or more

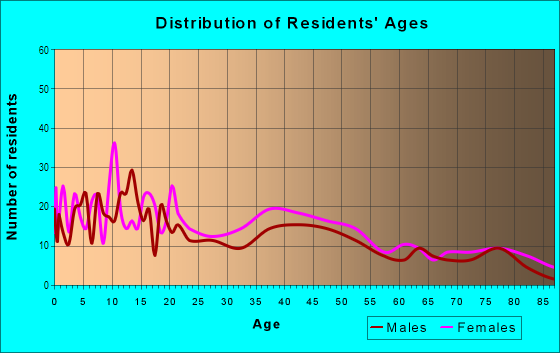
| Males: | 657 |
| Females: | 793 |
Males:
| This neighborhood: | 42.3 years |
| Whole city: | 35.0 years |
| This neighborhood: | 37.3 years |
| Whole city: | 38.2 years |
Average household size:
| Midtown-Edmondson: | 2.4 people |
| Baltimore: | 2.2 people |
Percentage of family households:
| Midtown-Edmondson: | 37.4% |
| Baltimore: | 34.2% |
| Here: | 13.7% |
| Baltimore: | 23.3% |
Percentage of married-couple families with children (among all households):
| Midtown-Edmondson: | 48.1% |
| Baltimore: | 22.4% |
Percentage of single-mother households (among all households):
| Midtown-Edmondson: | 24.3% |
| Baltimore: | 18.7% |
Percentage of never married males 15 years old and over:
Percentage of never married females 15 years old and over:
| Midtown-Edmondson: | 28.1% |
| Baltimore: | 25.1% |
Percentage of never married females 15 years old and over:
| Midtown-Edmondson: | 30.9% |
| city: | 27.5% |
Percentage of people that speak English not well or not at all:
| Midtown-Edmondson: | 0.5% |
| Baltimore: | 2.3% |
Percentage of people born in this state:
Percentage of people born in another U.S. state:
Percentage of native residents but born outside the U.S.:
Percentage of foreign born residents:
| Here: | 84.7% |
| Baltimore: | 64.4% |
Percentage of people born in another U.S. state:
| Midtown-Edmondson: | 9.3% |
| Baltimore: | 25.0% |
Percentage of native residents but born outside the U.S.:
| Here: | 2.3% |
| city: | 0.9% |
Percentage of foreign born residents:
| Here: | 4.0% |
| Baltimore: | 9.7% |
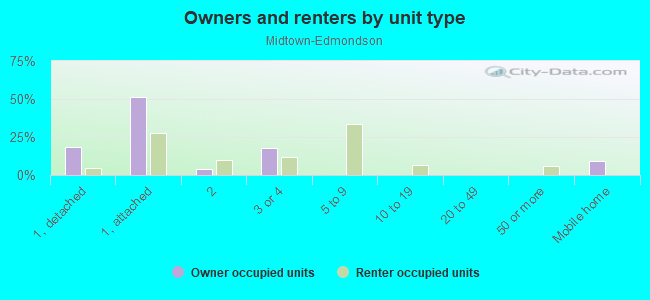
Owner-occupied
Renter-occupied

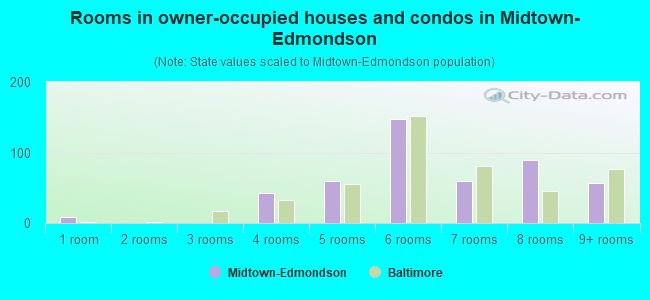
- Rooms in owner-occupied houses and condos in Midtown-Edmondson
- 81 room
- 02 rooms
- 03 rooms
- 424 rooms
- 595 rooms
- 1476 rooms
- 607 rooms
- 908 rooms
- 579+ rooms
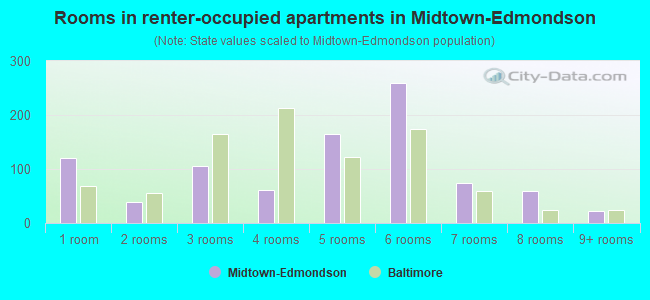
- Rooms in renter-occupied apartments in Midtown-Edmondson
- 1201 room
- 392 rooms
- 1053 rooms
- 624 rooms
- 1655 rooms
- 2606 rooms
- 757 rooms
- 608 rooms
- 239+ rooms
Owner-occupied
Renter-occupied
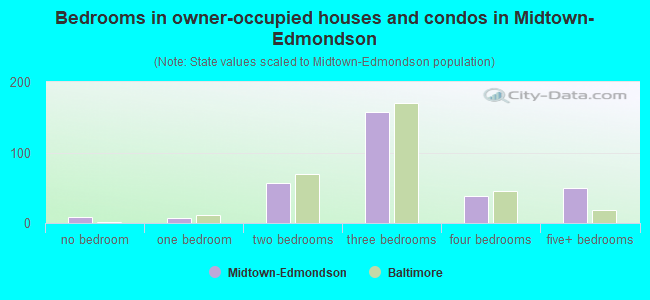
- Bedrooms in owner-occupied houses and condos in Midtown-Edmondson
- 8no bedroom
- 71 bedroom
- 572 bedrooms
- 1583 bedrooms
- 384 bedrooms
- 495+ bedrooms
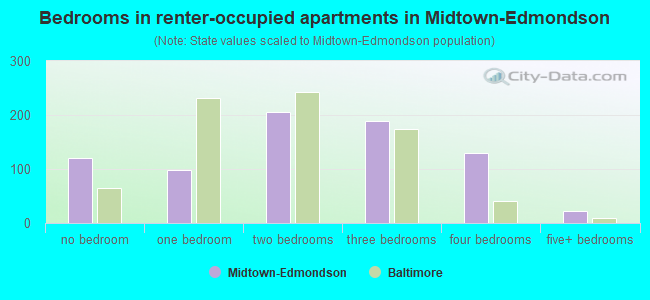
- Bedrooms in renter-occupied apartments in Midtown-Edmondson
- 120no bedroom
- 981 bedroom
- 2062 bedrooms
- 1883 bedrooms
- 1304 bedrooms
- 225+ bedrooms
Average number of cars or other vehicles available in houses/condos:
Average number of cars or other vehicles available in apartments:
| This neighborhood: | 1.5 |
| Baltimore: | 1.5 |
Average number of cars or other vehicles available in apartments:
| Here: | 0.9 |
| city: | 0.8 |
Percentage of units with a mortgage:
| Midtown-Edmondson: | 29.2% |
| Baltimore: | 64.3% |
Average estimated value of townhouses or other attached units in 2022 (81.8% of all units):
| This neighborhood: | $140,064 |
| city: | $206,258 |
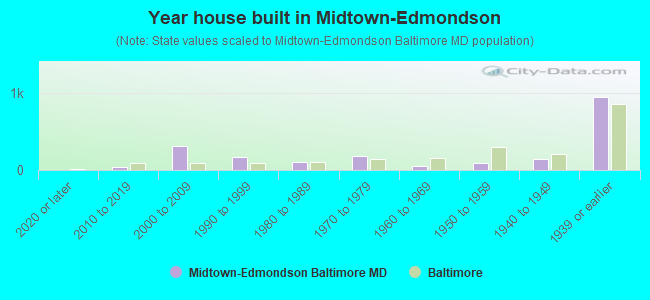
- Year house built in Midtown-Edmondson
- 02020 or later
- 412010 to 2019
- 3162000 to 2009
- 1661990 to 1999
- 1021980 to 1989
- 1831970 to 1979
- 541960 to 1969
- 901950 to 1959
- 1461940 to 1949
- 9401939 or earlier
Travel time to work (commute)
![Travel time to work (commute)]()
- 115 to 9 minutes
- 1710 to 14 minutes
- 9115 to 19 minutes
- 9320 to 24 minutes
- 525 to 29 minutes
- 9530 to 34 minutes
- 135 to 39 minutes
- 2940 to 44 minutes
- 4145 to 59 minutes
- 5560 to 89 minutes
- 5390 or more minutes

Means of transportation to work
![Means of transportation to work]()
- 55.6%230Drove a car alone
- 19.3%80Carpooled
- 38.5%159Bus
- 6.3%26Subway or elevated rail
- 6.0%25Long-distance train or commuter rail
- 27.6%114Taxi
- 3.4%14Walked
- 11.6%48Other means
- 47.2%195Worked at home

Time leaving home to go to work
![Time leaving home to go to work]()
- 2912:00 a.m. to 4:59 a.m.
- 295:00 a.m. to 5:29 a.m.
- 195:30 a.m. to 5:59 a.m.
- 326:00 a.m. to 6:29 a.m.
- 346:30 a.m. to 6:59 a.m.
- 287:00 a.m. to 7:29 a.m.
- 327:30 a.m. to 7:59 a.m.
- 1008:00 a.m. to 8:29 a.m.
- 308:30 a.m. to 8:59 a.m.
- 549:00 a.m. to 9:59 a.m.
- 1010:00 a.m. to 10:59 a.m.
- 511:00 a.m. to 11:59 a.m.
- 7412:00 p.m. to 3:59 p.m.
- 464:00 p.m. to 11:59 p.m.

Occupations of males:
- Percentage of males in management occupations (except farmers):
Here: 4.3% city: 10.7%
- Percentage of males in business and financial operations occupations:
Here: 2.7% city: 5.9%
- Percentage of males in life, physical, and social science occupations:
Here: 8.9% city: 2.3%
- Percentage of males in community and social services occupations:
Here: 2.4% city: 1.6%
- Percentage of males in education, training, and library occupations:
Here: 3.1% city: 5.4%
- Percentage of males in service occupations:
Here: 48.0% city: 14.7%
- Percentage of males in sales and office occupations:
Here: 2.9% city: 14.2%
- Percentage of males in construction, extraction, and maintenance occupations:
Here: 5.7% city: 5.6%
- Percentage of males in production occupations:
Here: 5.8% city: 4.2%
- Percentage of males in transportation occupations:
Here: 14.1% city: 6.8%
- Percentage of males in material moving occupations:
Here: 12.0% city: 7.0%
Occupations of females:
- Percentage of females in management occupations (except farmers):
Here: 20.2% city: 10.1%
- Percentage of females in business and financial operations occupations:
Here: 4.6% city: 6.6%
- Percentage of females in computer and mathematical occupations:
Here: 3.8% city: 2.4%
- Percentage of females in education, training, and library occupations:
Here: 2.8% city: 10.7%
- Percentage of females in arts, design, entertainment, sports, and media occupations:
Here: 1.3% city: 2.4%
- Percentage of females in healthcare practitioners and technical occupations:
Here: 4.5% city: 9.8%
- Percentage of females in service occupations:
Here: 23.5% city: 20.4%
- Percentage of females in sales and office occupations:
Here: 21.7% city: 22.3%
- Percentage of females in construction, extraction, and maintenance occupations:
Here: 4.6% city: 0.4%
- Percentage of females in production occupations:
Here: 2.9% city: 2.3%
- Percentage of females in transportation occupations:
Here: 5.6% city: 1.7%
- Percentage of females in material moving occupations:
Here: 7.1% city: 1.9%
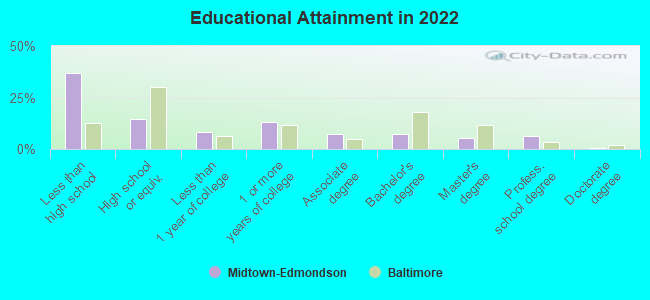
Education in this neighborhood (subdivision or community):
- Percentage of people 3 years and older in K-12 schools:
Midtown-Edmondson: 67.4% Baltimore: 14.7%
- Percentage of people 3 years and older in undergraduate colleges:
Midtown-Edmondson: 11.5% Baltimore: 6.0%
- Percentage of people 3 years and older in grad. or professional schools:
Midtown-Edmondson: 0.8% Baltimore: 2.8%
- Percentage of students K-12 enrolled in private schools:
Midtown-Edmondson: 9.1% Baltimore: 12.7%
Percentage of population below poverty level:
| Midtown-Edmondson: | 39.1% |
| Baltimore: | 18.5% |
Median year owner moved in (as recorded in 2022):
| Midtown-Edmondson: | 1993 |
| Baltimore: | 2009 |
Percentage of married-couple families with both working:
| Midtown-Edmondson: | 63.0% |
| Baltimore: | 79.2% |
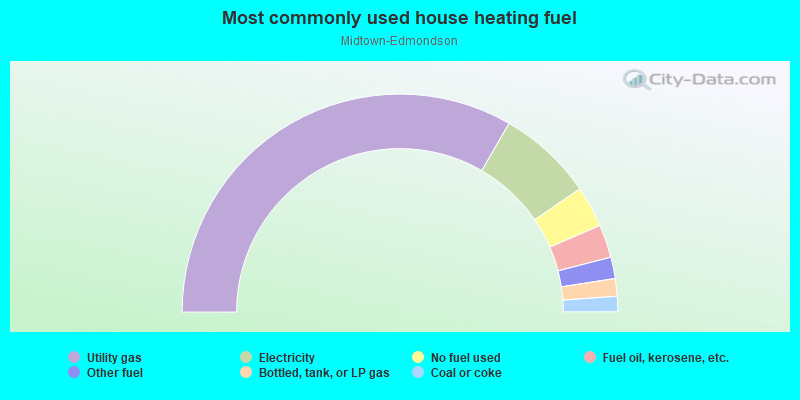
- 66.7%Utility gas
- 14.2%Electricity
- 6.1%No fuel used
- 4.9%Fuel oil, kerosene, etc.
- 3.2%Other fuel
- 2.6%Bottled, tank, or LP gas
- 2.3%Coal or coke
Highways in this neighborhood:
US Hwy 40 (W Franklin St)
Length: 0.39 miles
Direction: E-W
Address range: 2000 to 2399
Direction: E-W
Address range: 2000 to 2399
Roads and streets:
N Payson St
Length: 0.49 miles
Direction: N-S
Address range: 500 to 1099
Direction: N-S
Address range: 500 to 1099
Appleton St
Length: 0.47 miles
Direction: N-S
Address range: 600 to 1501
Direction: N-S
Address range: 600 to 1501
W Lanvale St
Length: 0.38 miles
Direction: E-W
Address range: 1925 to 2299
Direction: E-W
Address range: 1925 to 2299
N Pulaski St
Length: 0.35 miles
Direction: N-S
Address range: 406 to 899
Direction: N-S
Address range: 406 to 899
W Lafayette Ave
Length: 0.35 miles
Direction: E-W
Address range: 1926 to 2299
Direction: E-W
Address range: 1926 to 2299
Edmondson Ave
Length: 0.33 miles
Direction: E-W
Address range: 1900 to 2199
Direction: E-W
Address range: 1900 to 2199
N Brice St
Length: 0.26 miles
Direction: N-S
Address range: 500 to 899
Direction: N-S
Address range: 500 to 899
N Bentalou St
Length: 0.20 miles
Direction: N-S
Address range: 619 to 899
Direction: N-S
Address range: 619 to 899
Harlem Ave
Length: 0.18 miles
Direction: E-W
Address range: 1925 to 2099
Direction: E-W
Address range: 1925 to 2099
Spedden St
Length: 0.10 miles
Direction: N-S
Address range: 800 to 899
Direction: N-S
Address range: 800 to 899
Rayner Ave
Length: 0.09 miles
Direction: E-W
Address range: 2000 to 2099
Direction: E-W
Address range: 2000 to 2099
Mosher St (W Mosher St)
Length: 0.06 miles
Direction: E-W
Address range: 1926 to 1999
Direction: E-W
Address range: 1926 to 1999
Riggs Ave
Length: 0.06 miles
Direction: E-W
Address range: 1914 to 1937
Direction: E-W
Address range: 1914 to 1937
Railroad features:
Penn Central RR
Length: 0.37 miles
Directions: N-S, SW-NE
Directions: N-S, SW-NE