Mesa Park neighborhood in Round Rock, Texas (TX), 78664 detailed profile
Settings
X


Business Search - 14 Million verified businesses
Area: 0.189 square miles
Population: 1,069
Population density:
| Mesa Park: | 5,653 people per square mile |
| Round Rock: | 4,774 people per square mile |

- 48545.4%White
- 46543.5%Hispanic or Latino
- 524.9%Black
- 413.8%Two or more races
- 252.3%Asian

Median household income in 2022:
| Mesa Park: | $51,023 |
| Round Rock: | $81,804 |
Distribution of median household income
![Distribution of median household income]()
- 14Less than $10,000
- 60$10,000 to $19,999
- 28$20,000 to $29,999
- 40$30,000 to $39,999
- 82$40,000 to $49,999
- 108$50,000 to $59,999
- 26$60,000 to $74,999
- 23$75,000 to $99,999
- 14$100,000 to $124,999
- 20$125,000 to $149,999
- 20$150,000 to $199,999
- 22$200,000 or more

Distribution of owner-occupied house/condo value
![Distribution of owner-occupied house/condo value]()
- 11$100,000 to $149,999
- 12$150,000 to $199,999
- 23$200,000 to $249,999
- 46$250,000 to $299,999
- 35$300,000 to $399,999
- 7$400,000 to $499,999

Distribution of rent paid by renters
![Distribution of rent paid by renters]()
- 5$700 to $799
- 30$800 to $899
- 67$900 to $999
- 154$1,000 to $1,249
- 67$1,250 to $1,499
- 38$1,500 to $1,999

Median rent in 2022:
| Mesa Park: | $1,155 |
| Round Rock: | $1,572 |
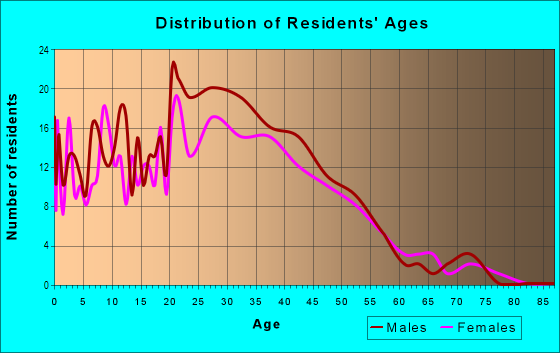
| Males: | 434 |
| Females: | 635 |
Males:
| This neighborhood: | 56.1 years |
| Whole city: | 31.6 years |
| This neighborhood: | 26.3 years |
| Whole city: | 37.6 years |
Average household size:
| Mesa Park: | 1.9 people |
| Round Rock: | 2.7 people |
Percentage of family households:
| Mesa Park: | 44.1% |
| Round Rock: | 53.1% |
| Here: | 21.7% |
| Round Rock: | 50.0% |
Percentage of married-couple families with children (among all households):
| Mesa Park: | 7.6% |
| Round Rock: | 27.8% |
Percentage of single-mother households (among all households):
| Mesa Park: | 33.4% |
| Round Rock: | 8.2% |
Percentage of never married males 15 years old and over:
Percentage of never married females 15 years old and over:
| Mesa Park: | 11.0% |
| Round Rock: | 18.5% |
Percentage of never married females 15 years old and over:
| Mesa Park: | 37.5% |
| city: | 15.3% |
Percentage of people that speak English not well or not at all:
| Mesa Park: | 35.7% |
| Round Rock: | 3.7% |
Percentage of people born in this state:
Percentage of people born in another U.S. state:
Percentage of native residents but born outside the U.S.:
Percentage of foreign born residents:
| Here: | 47.8% |
| Round Rock: | 51.2% |
Percentage of people born in another U.S. state:
| Mesa Park: | 29.2% |
| Round Rock: | 31.6% |
Percentage of native residents but born outside the U.S.:
| Here: | 1.5% |
| city: | 2.0% |
Percentage of foreign born residents:
| Here: | 21.5% |
| Round Rock: | 15.2% |

Owner-occupied
Renter-occupied


- Rooms in owner-occupied houses and condos in Mesa Park
- 01 room
- 02 rooms
- 243 rooms
- 174 rooms
- 225 rooms
- 266 rooms
- 507 rooms
- 218 rooms
- 279+ rooms

- Rooms in renter-occupied apartments in Mesa Park
- 81 room
- 162 rooms
- 433 rooms
- 1694 rooms
- 705 rooms
- 76 rooms
- 77 rooms
- 08 rooms
- 09+ rooms
Owner-occupied
Renter-occupied

- Bedrooms in owner-occupied houses and condos in Mesa Park
- 0no bedroom
- 01 bedroom
- 242 bedrooms
- 883 bedrooms
- 264 bedrooms
- 05+ bedrooms

- Bedrooms in renter-occupied apartments in Mesa Park
- 8no bedroom
- 881 bedroom
- 1872 bedrooms
- 383 bedrooms
- 564 bedrooms
- 05+ bedrooms
Average number of cars or other vehicles available in houses/condos:
Average number of cars or other vehicles available in apartments:
| This neighborhood: | 2.5 |
| Round Rock: | 2.1 |
Average number of cars or other vehicles available in apartments:
| Here: | 1.3 |
| city: | 1.6 |
Percentage of units with a mortgage:
| Mesa Park: | 44.8% |
| Round Rock: | 72.4% |

- Year house built in Mesa Park
- 02020 or later
- 92010 to 2019
- 152000 to 2009
- 991990 to 1999
- 1041980 to 1989
- 1951970 to 1979
- 261960 to 1969
- 41950 to 1959
- 01940 to 1949
- 01939 or earlier

City-data.com crime index for city in 2020 (higher means more crime):
| City: | 119.9 |
| U.S. average: | 219.5 |
Travel time to work (commute)
![Travel time to work (commute)]()
- 38Less than 5 minutes
- 2335 to 9 minutes
- 22710 to 14 minutes
- 25015 to 19 minutes
- 28020 to 24 minutes
- 9425 to 29 minutes
- 18030 to 34 minutes
- 2135 to 39 minutes
- 1040 to 44 minutes
- 1945 to 59 minutes
- 8260 to 89 minutes
- 1990 or more minutes

Means of transportation to work
![Means of transportation to work]()
- 77.8%419Drove a car alone
- 4.5%24Carpooled
- 3.5%19Bus
- 8.2%44Taxi
- 3.5%19Bicycle
- 7.8%42Walked
- 9.7%52Worked at home

Time leaving home to go to work
![Time leaving home to go to work]()
- 9612:00 a.m. to 4:59 a.m.
- 955:00 a.m. to 5:29 a.m.
- 195:30 a.m. to 5:59 a.m.
- 1156:00 a.m. to 6:29 a.m.
- 1296:30 a.m. to 6:59 a.m.
- 2667:00 a.m. to 7:29 a.m.
- 1327:30 a.m. to 7:59 a.m.
- 1038:00 a.m. to 8:29 a.m.
- 788:30 a.m. to 8:59 a.m.
- 289:00 a.m. to 9:59 a.m.
- 9910:00 a.m. to 10:59 a.m.
- 211:00 a.m. to 11:59 a.m.
- 19112:00 p.m. to 3:59 p.m.
- 1554:00 p.m. to 11:59 p.m.

Occupations of males:
- Percentage of males in management occupations (except farmers):
Here: 28.2% city: 12.7%
- Percentage of males in business and financial operations occupations:
Here: 20.2% city: 5.0%
- Percentage of males in computer and mathematical occupations:
Here: 5.7% city: 14.3%
- Percentage of males in architecture and engineering occupations:
Here: 30.0% city: 4.5%
- Percentage of males in arts, design, entertainment, sports, and media occupations:
Here: 20.2% city: 1.7%
- Percentage of males in healthcare practitioners and technical occupations:
Here: 14.7% city: 2.7%
- Percentage of males in service occupations:
Here: 24.7% city: 12.2%
- Percentage of males in sales and office occupations:
Here: 9.2% city: 18.7%
- Percentage of males in construction, extraction, and maintenance occupations:
Here: 7.5% city: 5.8%
- Percentage of males in production occupations:
Here: 65.6% city: 4.7%
- Percentage of males in transportation occupations:
Here: 65.0% city: 4.1%
- Percentage of males in material moving occupations:
Here: 17.8% city: 4.3%
Occupations of females:
- Percentage of females in management occupations (except farmers):
Here: 3.8% city: 9.3%
- Percentage of females in business and financial operations occupations:
Here: 2.4% city: 8.4%
- Percentage of females in computer and mathematical occupations:
Here: 1.9% city: 4.1%
- Percentage of females in architecture and engineering occupations:
Here: 1.3% city: 1.7%
- Percentage of females in community and social services occupations:
Here: 4.6% city: 1.2%
- Percentage of females in education, training, and library occupations:
Here: 5.3% city: 9.3%
- Percentage of females in healthcare practitioners and technical occupations:
Here: 9.7% city: 8.6%
- Percentage of females in service occupations:
Here: 38.0% city: 17.0%
- Percentage of females in sales and office occupations:
Here: 34.3% city: 31.0%
- Percentage of females in production occupations:
Here: 4.0% city: 2.7%
- Percentage of females in transportation occupations:
Here: 8.7% city: 1.6%
- Percentage of females in material moving occupations:
Here: 1.8% city: 1.4%
Education in this neighborhood (subdivision or community):
- Percentage of people 3 years and older in K-12 schools:
Mesa Park: 16.2% Round Rock: 20.5%
- Percentage of people 3 years and older in undergraduate colleges:
Mesa Park: 3.0% Round Rock: 6.0%
- Percentage of people 3 years and older in grad. or professional schools:
Mesa Park: 0.8% Round Rock: 1.8%
- Percentage of students K-12 enrolled in private schools:
Mesa Park: 14.8% Round Rock: 9.6%
Percentage of population below poverty level:
| Mesa Park: | 10.7% |
| Round Rock: | 10.7% |
Median year owner moved in (as recorded in 2022):
Median year renter moved in (as recorded in 2022):
| Mesa Park: | 1998 |
| Round Rock: | 2014 |
Median year renter moved in (as recorded in 2022):
| Mesa Park: | 2018 |
| Round Rock: | 2021 |
Percentage of married-couple families with both working:
| Mesa Park: | 100.0% |
| Round Rock: | 82.2% |

- 79.6%Electricity
- 20.4%Utility gas
Roads and streets:
Mesa Park Dr
Length: 0.36 miles
Directions: N-S, SE-NW
Address range: 1502 to 1899
Directions: N-S, SE-NW
Address range: 1502 to 1899
Long Meadow Dr
Length: 0.31 miles
Directions: E-W, N-S, SW-NE
Address range: 900 to 1199
Directions: E-W, N-S, SW-NE
Address range: 900 to 1199
Ridgeline Dr
Length: 0.22 miles
Directions: E-W, SW-NE
Address range: 900 to 1100
Directions: E-W, SW-NE
Address range: 900 to 1100
Georgetown St
Length: 0.18 miles
Directions: N-S, SW-NE
Address range: 1301 to 1499
Directions: N-S, SW-NE
Address range: 1301 to 1499
Rolling Green Dr
Length: 0.15 miles
Directions: E-W, SW-NE
Address range: 900 to 1099
Directions: E-W, SW-NE
Address range: 900 to 1099
Green Meadow Dr
Length: 0.12 miles
Directions: E-W, SW-NE
Address range: 900 to 1003
Directions: E-W, SW-NE
Address range: 900 to 1003
Wild Flower Dr
Length: 0.09 miles
Direction: SE-NW
Address range: 1506 to 1699
Direction: SE-NW
Address range: 1506 to 1699
New Cove
Length: 0.04 miles
Direction: SW-NE
Address range: 1600 to 1611
Direction: SW-NE
Address range: 1600 to 1611