Manhattan Manor neighborhood in Tampa, Florida (FL), 33611 detailed profile
Settings
X


Business Search - 14 Million verified businesses
Area: 0.210 square miles
Population: 1,060
Population density:
| Manhattan Manor: | 5,054 people per square mile |
| Tampa: | 3,553 people per square mile |

- 70564.9%White
- 23221.3%Hispanic or Latino
- 746.8%Black
- 494.5%Asian
- 161.5%Some other race
- 111.0%Two or more races

Median household income in 2022:
| Manhattan Manor: | $77,048 |
| Tampa: | $71,089 |
Distribution of median household income
![Distribution of median household income]()
- 21Less than $10,000
- 41$10,000 to $19,999
- 15$20,000 to $29,999
- 65$30,000 to $39,999
- 87$40,000 to $49,999
- 47$50,000 to $59,999
- 50$60,000 to $74,999
- 127$75,000 to $99,999
- 25$100,000 to $124,999
- 27$125,000 to $149,999
- 99$150,000 to $199,999
- 46$200,000 or more

Distribution of owner-occupied house/condo value
![Distribution of owner-occupied house/condo value]()
- 18Less than $50,000
- 22$50,000 to $99,999
- 64$100,000 to $149,999
- 112$150,000 to $199,999
- 75$200,000 to $249,999
- 43$250,000 to $299,999
- 34$300,000 to $399,999
- 59$400,000 to $499,999
- 52$500,000 to $749,999
- 5$1,000,000 or more

Distribution of rent paid by renters
![Distribution of rent paid by renters]()
- 7$100 to $199
- 10$200 to $299
- 10$300 to $399
- 7$400 to $499
- 5$600 to $699
- 4$800 to $899
- 7$900 to $999
- 74$1,000 to $1,249
- 49$1,250 to $1,499
- 28$1,500 to $1,999
- 28$2,000 or more

Median rent in 2022:
| Manhattan Manor: | $1,507 |
| Tampa: | $1,444 |
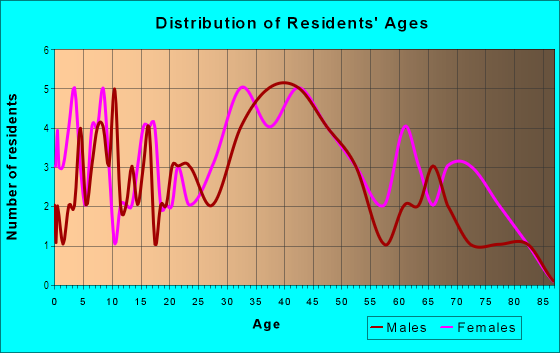
| Males: | 532 |
| Females: | 528 |
Males:
| This neighborhood: | 48.2 years |
| Whole city: | 35.5 years |
| This neighborhood: | 58.4 years |
| Whole city: | 35.1 years |
Average household size:
| Manhattan Manor: | 7.5 people |
| Tampa: | 2.3 people |
Percentage of family households:
| Manhattan Manor: | 19.2% |
| Tampa: | 39.9% |
| Here: | 21.9% |
| Tampa: | 35.4% |
Percentage of married-couple families with children (among all households):
| Manhattan Manor: | 23.9% |
| Tampa: | 25.1% |
Percentage of single-mother households (among all households):
| Manhattan Manor: | 15.7% |
| Tampa: | 12.2% |
Percentage of never married males 15 years old and over:
Percentage of never married females 15 years old and over:
| Manhattan Manor: | 26.3% |
| Tampa: | 23.6% |
Percentage of never married females 15 years old and over:
| Manhattan Manor: | 18.2% |
| city: | 20.9% |
Percentage of people that speak English not well or not at all:
| Manhattan Manor: | 0.8% |
| Tampa: | 6.4% |
Percentage of people born in this state:
Percentage of people born in another U.S. state:
Percentage of native residents but born outside the U.S.:
Percentage of foreign born residents:
| Here: | 41.0% |
| Tampa: | 39.7% |
Percentage of people born in another U.S. state:
| Manhattan Manor: | 40.8% |
| Tampa: | 35.7% |
Percentage of native residents but born outside the U.S.:
| Here: | 2.8% |
| city: | 4.6% |
Percentage of foreign born residents:
| Here: | 15.4% |
| Tampa: | 20.0% |

Owner-occupied
Renter-occupied


- Rooms in owner-occupied houses and condos in Manhattan Manor
- 611 room
- 42 rooms
- 253 rooms
- 1074 rooms
- 765 rooms
- 456 rooms
- 227 rooms
- 598 rooms
- 209+ rooms

- Rooms in renter-occupied apartments in Manhattan Manor
- 181 room
- 222 rooms
- 583 rooms
- 664 rooms
- 215 rooms
- 176 rooms
- 07 rooms
- 08 rooms
- 09+ rooms
Owner-occupied
Renter-occupied

- Bedrooms in owner-occupied houses and condos in Manhattan Manor
- 61no bedroom
- 321 bedroom
- 1462 bedrooms
- 1473 bedrooms
- 294 bedrooms
- 05+ bedrooms

- Bedrooms in renter-occupied apartments in Manhattan Manor
- 15no bedroom
- 771 bedroom
- 892 bedrooms
- 133 bedrooms
- 04 bedrooms
- 05+ bedrooms
Average number of cars or other vehicles available in houses/condos:
Average number of cars or other vehicles available in apartments:
| This neighborhood: | 1.7 |
| Tampa: | 1.9 |
Average number of cars or other vehicles available in apartments:
| Here: | 1.3 |
| city: | 1.3 |
Percentage of units with a mortgage:
| Manhattan Manor: | 72.7% |
| Tampa: | 65.8% |
Average estimated value of detached houses in 2022 (37.5% of all units):
| Manhattan Manor: | $381,344 |
| Tampa: | $505,567 |

- Year house built in Manhattan Manor
- 02020 or later
- 492010 to 2019
- 1322000 to 2009
- 561990 to 1999
- 1351980 to 1989
- 661970 to 1979
- 291960 to 1969
- 1491950 to 1959
- 01940 to 1949
- 141939 or earlier

City-data.com crime index for city in 2020 (higher means more crime):
| City: | 212.7 |
| U.S. average: | 219.5 |
Travel time to work (commute)
![Travel time to work (commute)]()
- 14Less than 5 minutes
- 105 to 9 minutes
- 5110 to 14 minutes
- 6415 to 19 minutes
- 4120 to 24 minutes
- 1525 to 29 minutes
- 6630 to 34 minutes
- 735 to 39 minutes
- 340 to 44 minutes
- 3545 to 59 minutes
- 1360 to 89 minutes
- 390 or more minutes

Means of transportation to work
![Means of transportation to work]()
- 76.2%484Drove a car alone
- 2.8%18Carpooled
- 1.3%8Bus
- 0.6%4Bicycle
- 4.1%26Other means
- 16.2%103Worked at home

Time leaving home to go to work
![Time leaving home to go to work]()
- 912:00 a.m. to 4:59 a.m.
- 35:30 a.m. to 5:59 a.m.
- 176:00 a.m. to 6:29 a.m.
- 526:30 a.m. to 6:59 a.m.
- 307:00 a.m. to 7:29 a.m.
- 327:30 a.m. to 7:59 a.m.
- 568:00 a.m. to 8:29 a.m.
- 278:30 a.m. to 8:59 a.m.
- 359:00 a.m. to 9:59 a.m.
- 910:00 a.m. to 10:59 a.m.
- 1412:00 p.m. to 3:59 p.m.
- 204:00 p.m. to 11:59 p.m.

Occupations of males:
- Percentage of males in management occupations (except farmers):
Here: 16.1% city: 14.3%
- Percentage of males in business and financial operations occupations:
Here: 8.7% city: 7.8%
- Percentage of males in computer and mathematical occupations:
Here: 5.2% city: 6.0%
- Percentage of males in legal occupations:
Here: 2.3% city: 2.8%
- Percentage of males in education, training, and library occupations:
Here: 1.8% city: 2.2%
- Percentage of males in arts, design, entertainment, sports, and media occupations:
Here: 5.0% city: 2.5%
- Percentage of males in healthcare practitioners and technical occupations:
Here: 10.3% city: 4.9%
- Percentage of males in service occupations:
Here: 5.6% city: 13.7%
- Percentage of males in sales and office occupations:
Here: 33.1% city: 16.3%
- Percentage of males in construction, extraction, and maintenance occupations:
Here: 2.8% city: 8.2%
- Percentage of males in production occupations:
Here: 1.2% city: 3.7%
- Percentage of males in transportation occupations:
Here: 2.9% city: 5.8%
- Percentage of males in material moving occupations:
Here: 1.5% city: 3.8%
Occupations of females:
- Percentage of females in management occupations (except farmers):
Here: 13.7% city: 10.9%
- Percentage of females in business and financial operations occupations:
Here: 12.7% city: 8.5%
- Percentage of females in computer and mathematical occupations:
Here: 1.1% city: 2.4%
- Percentage of females in life, physical, and social science occupations:
Here: 2.5% city: 1.2%
- Percentage of females in legal occupations:
Here: 1.9% city: 2.7%
- Percentage of females in education, training, and library occupations:
Here: 8.5% city: 7.2%
- Percentage of females in arts, design, entertainment, sports, and media occupations:
Here: 2.7% city: 2.1%
- Percentage of females in healthcare practitioners and technical occupations:
Here: 7.1% city: 10.3%
- Percentage of females in service occupations:
Here: 16.5% city: 19.1%
- Percentage of females in sales and office occupations:
Here: 31.3% city: 27.1%
- Percentage of females in production occupations:
Here: 1.1% city: 2.0%
Percentage of people 16-64 in Armed Forces:
| Manhattan Manor: | 1.2% |
| Tampa: | 1.1% |
Education in this neighborhood (subdivision or community):
- Percentage of people 3 years and older in K-12 schools:
Manhattan Manor: 10.9% Tampa: 14.3%
- Percentage of people 3 years and older in undergraduate colleges:
Manhattan Manor: 4.5% Tampa: 7.8%
- Percentage of people 3 years and older in grad. or professional schools:
Manhattan Manor: 9.8% Tampa: 2.0%
- Percentage of students K-12 enrolled in private schools:
Manhattan Manor: 2.7% Tampa: 12.5%
Percentage of population below poverty level:
| Manhattan Manor: | 8.5% |
| Tampa: | 16.3% |
Median year owner moved in (as recorded in 2022):
Median year renter moved in (as recorded in 2022):
| Manhattan Manor: | 2424 |
| Tampa: | 2013 |
Median year renter moved in (as recorded in 2022):
| Manhattan Manor: | 2438 |
| Tampa: | 2020 |
Percentage of married-couple families with both working:
| Manhattan Manor: | 85.7% |
| Tampa: | 70.4% |

- 98.4%Electricity
- 0.9%No fuel used
- 0.7%Utility gas
Roads and streets:
W Knights Ave
Length: 0.46 miles
Direction: E-W
Address range: 4000 to 4399
Direction: E-W
Address range: 4000 to 4399
S Lois Ave
Length: 0.28 miles
Direction: N-S
Address range: 4300 to 4699
Direction: N-S
Address range: 4300 to 4699
S Clark Ave
Length: 0.24 miles
Direction: N-S
Address range: 4300 to 4608
Direction: N-S
Address range: 4300 to 4608
W Coachman Ave
Length: 0.24 miles
Direction: E-W
Address range: 4003 to 4299
Direction: E-W
Address range: 4003 to 4299
W Lawn Ave
Length: 0.22 miles
Direction: E-W
Address range: 4000 to 4199
Direction: E-W
Address range: 4000 to 4199
S Grady Ave
Length: 0.19 miles
Direction: N-S
Address range: 4300 to 4399
Direction: N-S
Address range: 4300 to 4399
S Hale Ave
Length: 0.19 miles
Direction: N-S
Address range: 4300 to 4399
Direction: N-S
Address range: 4300 to 4399
S Cameron Ave
Length: 0.19 miles
Direction: N-S
Address range: 4300 to 4399
Direction: N-S
Address range: 4300 to 4399
W Fielder St
Length: 0.10 miles
Direction: E-W
Address range: 4100 to 4199
Direction: E-W
Address range: 4100 to 4199
S Coolidge Ave
Length: 0.09 miles
Direction: N-S
Address range: 4300 to 4313
Direction: N-S
Address range: 4300 to 4313