Hoover (Foster) neighborhood in Emeryville, California (CA), 94608, 94609, 94612 detailed profile
Settings
X


Business Search - 14 Million verified businesses
Area: 0.286 square miles
Population: 5,384
Population density:
| Hoover (Foster): | 18,840 people per square mile |
| Emeryville: | 10,534 people per square mile |

- 1,75431.8%Black
- 1,35524.6%White
- 1,17421.3%Hispanic or Latino
- 72813.2%Asian
- 3446.2%Two or more races
- 831.5%American Indian
- 500.9%Native Hawaiian and Other
Pacific Islander - 240.4%Some other race

Median household income in 2022:
| Hoover (Foster): | $93,476 |
| Emeryville: | $114,345 |
Distribution of median household income
![Distribution of median household income]()
- 191Less than $10,000
- 265$10,000 to $19,999
- 120$20,000 to $29,999
- 101$30,000 to $39,999
- 114$40,000 to $49,999
- 118$50,000 to $59,999
- 104$60,000 to $74,999
- 408$75,000 to $99,999
- 247$100,000 to $124,999
- 122$125,000 to $149,999
- 119$150,000 to $199,999
- 271$200,000 or more

Distribution of owner-occupied house/condo value
![Distribution of owner-occupied house/condo value]()
- 88Less than $50,000
- 11$100,000 to $149,999
- 59$150,000 to $199,999
- 38$200,000 to $249,999
- 17$250,000 to $299,999
- 44$300,000 to $399,999
- 84$400,000 to $499,999
- 85$500,000 to $749,999
- 194$750,000 to $999,999
- 159$1,000,000 or more

Distribution of rent paid by renters
![Distribution of rent paid by renters]()
- 75Less than $100
- 221$100 to $199
- 182$200 to $299
- 186$300 to $399
- 44$400 to $499
- 53$600 to $699
- 162$700 to $799
- 94$800 to $899
- 38$900 to $999
- 141$1,000 to $1,249
- 130$1,250 to $1,499
- 219$1,500 to $1,999
- 795$2,000 or more

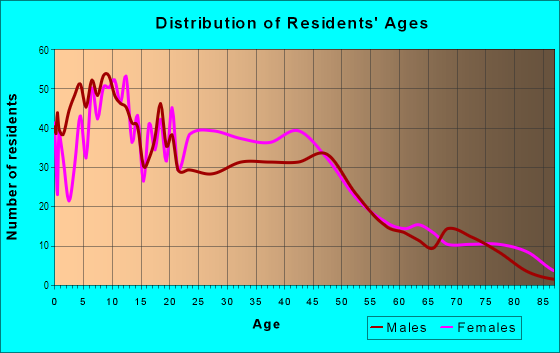
| Males: | 2,905 |
| Females: | 2,479 |
Males:
| This neighborhood: | 32.6 years |
| Whole city: | 36.3 years |
| This neighborhood: | 32.4 years |
| Whole city: | 35.3 years |
Average household size:
| Hoover (Foster): | 5.3 people |
| Emeryville: | 1.8 people |
Percentage of family households:
| Hoover (Foster): | 33.1% |
| Emeryville: | 26.3% |
| Here: | 17.4% |
| Emeryville: | 23.0% |
Percentage of married-couple families with children (among all households):
| Hoover (Foster): | 17.1% |
| Emeryville: | 35.0% |
Percentage of single-mother households (among all households):
| Hoover (Foster): | 9.6% |
| Emeryville: | 14.7% |
Percentage of never married males 15 years old and over:
Percentage of never married females 15 years old and over:
| Hoover (Foster): | 39.2% |
| Emeryville: | 23.5% |
Percentage of never married females 15 years old and over:
| Hoover (Foster): | 29.0% |
| city: | 27.7% |
Percentage of people that speak English not well or not at all:
| Hoover (Foster): | 4.7% |
| Emeryville: | 3.1% |
Percentage of people born in this state:
Percentage of people born in another U.S. state:
Percentage of native residents but born outside the U.S.:
Percentage of foreign born residents:
| Here: | 56.2% |
| Emeryville: | 33.9% |
Percentage of people born in another U.S. state:
| Hoover (Foster): | 24.9% |
| Emeryville: | 30.6% |
Percentage of native residents but born outside the U.S.:
| Here: | 1.7% |
| city: | 2.5% |
Percentage of foreign born residents:
| Here: | 17.2% |
| Emeryville: | 32.9% |

Owner-occupied
Renter-occupied


- Rooms in owner-occupied houses and condos in Hoover <
> - 401 room
- 272 rooms
- 883 rooms
- 404 rooms
- 935 rooms
- 1176 rooms
- 1717 rooms
- 1038 rooms
- 1309+ rooms

- Rooms in renter-occupied apartments in Hoover <
> - 1291 room
- 1282 rooms
- 2563 rooms
- 3084 rooms
- 2195 rooms
- 2356 rooms
- 717 rooms
- 668 rooms
- 259+ rooms
Owner-occupied
Renter-occupied

- Bedrooms in owner-occupied houses and condos in Hoover <
> - 40no bedroom
- 871 bedroom
- 1282 bedrooms
- 1483 bedrooms
- 934 bedrooms
- 795+ bedrooms

- Bedrooms in renter-occupied apartments in Hoover <
> - 152no bedroom
- 2801 bedroom
- 4392 bedrooms
- 2373 bedrooms
- 1984 bedrooms
- 705+ bedrooms
Average number of cars or other vehicles available in houses/condos:
Average number of cars or other vehicles available in apartments:
| This neighborhood: | 1.5 |
| Emeryville: | 1.2 |
Average number of cars or other vehicles available in apartments:
| Here: | 1.3 |
| city: | 1.2 |
Percentage of units with a mortgage:
| Hoover (Foster): | 83.7% |
| Emeryville: | 65.5% |
Average estimated value of detached houses in 2022 (26.6% of all units):
| Hoover (Foster): | $779,718 |
| California: | $988,808 |

- Year house built in Hoover <
> - 1402020 or later
- 762010 to 2019
- 1712000 to 2009
- 751990 to 1999
- 1211980 to 1989
- 3691970 to 1979
- 971960 to 1969
- 1711950 to 1959
- 1271940 to 1949
- 1,2221939 or earlier

City-data.com crime index for city in 2020 (higher means more crime):
| City: | 810.6 |
| U.S. average: | 219.5 |
Travel time to work (commute)
![Travel time to work (commute)]()
- 52Less than 5 minutes
- 315 to 9 minutes
- 50010 to 14 minutes
- 51615 to 19 minutes
- 28720 to 24 minutes
- 8325 to 29 minutes
- 49530 to 34 minutes
- 10935 to 39 minutes
- 16040 to 44 minutes
- 20945 to 59 minutes
- 25860 to 89 minutes
- 14290 or more minutes

Means of transportation to work
![Means of transportation to work]()
- 48.6%1,544Drove a car alone
- 7.8%249Carpooled
- 9.3%295Bus
- 16.0%509Subway or elevated rail
- 0.6%19Long-distance train or commuter rail
- 1.7%53Ferryboat
- 5.4%172Taxi
- 1.1%36Motorcycle
- 2.7%85Bicycle
- 2.9%93Walked
- 1.6%52Other means
- 10.7%340Worked at home

Time leaving home to go to work
![Time leaving home to go to work]()
- 10912:00 a.m. to 4:59 a.m.
- 235:00 a.m. to 5:29 a.m.
- 495:30 a.m. to 5:59 a.m.
- 2376:00 a.m. to 6:29 a.m.
- 1186:30 a.m. to 6:59 a.m.
- 1887:00 a.m. to 7:29 a.m.
- 3197:30 a.m. to 7:59 a.m.
- 4758:00 a.m. to 8:29 a.m.
- 2178:30 a.m. to 8:59 a.m.
- 4329:00 a.m. to 9:59 a.m.
- 10010:00 a.m. to 10:59 a.m.
- 2311:00 a.m. to 11:59 a.m.
- 41212:00 p.m. to 3:59 p.m.
- 834:00 p.m. to 11:59 p.m.

Occupations of males:
- Percentage of males in management occupations (except farmers):
Here: 9.8% city: 18.1%
- Percentage of males in business and financial operations occupations:
Here: 5.5% city: 10.9%
- Percentage of males in computer and mathematical occupations:
Here: 6.5% city: 14.5%
- Percentage of males in architecture and engineering occupations:
Here: 5.6% city: 8.0%
- Percentage of males in life, physical, and social science occupations:
Here: 1.5% city: 4.6%
- Percentage of males in community and social services occupations:
Here: 1.1% city: 0.1%
- Percentage of males in legal occupations:
Here: 3.2% city: 2.7%
- Percentage of males in education, training, and library occupations:
Here: 9.0% city: 4.3%
- Percentage of males in arts, design, entertainment, sports, and media occupations:
Here: 8.9% city: 5.1%
- Percentage of males in healthcare practitioners and technical occupations:
Here: 2.8% city: 4.7%
- Percentage of males in service occupations:
Here: 12.9% city: 4.4%
- Percentage of males in sales and office occupations:
Here: 17.6% city: 8.9%
- Percentage of males in farming, fishing, and forestry occupations:
Here: 1.7% city: 0.0%
- Percentage of males in construction, extraction, and maintenance occupations:
Here: 5.0% city: 3.4%
- Percentage of males in production occupations:
Here: 2.3% city: 0.2%
- Percentage of males in transportation occupations:
Here: 4.1% city: 4.2%
- Percentage of males in material moving occupations:
Here: 1.2% city: 3.8%
Occupations of females:
- Percentage of females in management occupations (except farmers):
Here: 13.9% city: 16.5%
- Percentage of females in business and financial operations occupations:
Here: 11.4% city: 17.3%
- Percentage of females in computer and mathematical occupations:
Here: 2.9% city: 5.1%
- Percentage of females in community and social services occupations:
Here: 8.2% city: 2.3%
- Percentage of females in education, training, and library occupations:
Here: 4.5% city: 9.3%
- Percentage of females in arts, design, entertainment, sports, and media occupations:
Here: 5.5% city: 6.6%
- Percentage of females in healthcare practitioners and technical occupations:
Here: 5.2% city: 6.6%
- Percentage of females in service occupations:
Here: 21.9% city: 6.3%
- Percentage of females in sales and office occupations:
Here: 17.5% city: 16.8%
- Percentage of females in construction, extraction, and maintenance occupations:
Here: 1.3% city: 0.0%
- Percentage of females in production occupations:
Here: 3.2% city: 0.0%
- Percentage of females in transportation occupations:
Here: 1.8% city: 0.2%
- Percentage of females in material moving occupations:
Here: 1.2% city: 1.1%
Education in this neighborhood (subdivision or community):
- Percentage of people 3 years and older in K-12 schools:
Hoover (Foster): 18.2% Emeryville: 4.0%
- Percentage of people 3 years and older in undergraduate colleges:
Hoover (Foster): 7.9% Emeryville: 6.9%
- Percentage of people 3 years and older in grad. or professional schools:
Hoover (Foster): 3.6% Emeryville: 4.5%
- Percentage of students K-12 enrolled in private schools:
Hoover (Foster): 22.4% Emeryville: 10.6%
Percentage of population below poverty level:
| Hoover (Foster): | 29.3% |
| Emeryville: | 12.2% |
Median year renter moved in (as recorded in 2022):
| Hoover (Foster): | 2016 |
| Emeryville: | 2018 |
Percentage of married-couple families with both working:
| Hoover (Foster): | 103.0% |
| Emeryville: | 69.0% |

- 49.6%Utility gas
- 36.5%Electricity
- 5.0%No fuel used
- 4.1%Bottled, tank, or LP gas
- 3.9%Other fuel
- 1.1%Solar energy
Limited-access highways (interstate or state) in this neighborhood:
I- 580
Length: 1.03 miles
Directions: E-W, SE-NW
Directions: E-W, SE-NW
I- 980 (Grove Shafter Fwy)
Length: 0.19 miles
Direction: N-S
Direction: N-S
Roads and streets:
San Pablo Ave
Length: 0.93 miles
Direction: N-S
Address range: 2300 to 3579
Direction: N-S
Address range: 2300 to 3579
San Pablo
Length: 0.77 miles
Direction: N-S
Direction: N-S
Martin Luther King Jr Way
Length: 0.76 miles
Directions: E-W, N-S, SE-NW, SW-NE
Address range: 2550 to 3499
Directions: E-W, N-S, SE-NW, SW-NE
Address range: 2550 to 3499
West St
Length: 0.69 miles
Direction: N-S
Address range: 2500 to 3499
Direction: N-S
Address range: 2500 to 3499
35th St
Length: 0.63 miles
Directions: E-W, SE-NW
Address range: 600 to 999
Directions: E-W, SE-NW
Address range: 600 to 999
34th St
Length: 0.57 miles
Direction: E-W
Address range: 648 to 999
Direction: E-W
Address range: 648 to 999
33rd St
Length: 0.52 miles
Direction: E-W
Address range: 600 to 999
Direction: E-W
Address range: 600 to 999
Brockhurst St
Length: 0.51 miles
Directions: E-W, SE-NW
Address range: 600 to 999
Directions: E-W, SE-NW
Address range: 600 to 999
32nd St
Length: 0.45 miles
Direction: E-W
Address range: 598 to 949
Direction: E-W
Address range: 598 to 949
31st St
Length: 0.44 miles
Directions: E-W, N-S
Address range: 600 to 999
Directions: E-W, N-S
Address range: 600 to 999
30th St
Length: 0.41 miles
Direction: E-W
Address range: 600 to 899
Direction: E-W
Address range: 600 to 899
Market St
Length: 0.40 miles
Directions: N-S, SW-NE
Address range: 2950 to 3499
Directions: N-S, SW-NE
Address range: 2950 to 3499
West
Length: 0.35 miles
Directions: E-W, N-S, SW-NE
Directions: E-W, N-S, SW-NE
29th St
Length: 0.35 miles
Direction: E-W
Address range: 650 to 899
Direction: E-W
Address range: 650 to 899
Bay Pl (27th St)
Length: 0.33 miles
Directions: E-W, SE-NW
Address range: 600 to 849
Directions: E-W, SE-NW
Address range: 600 to 849
Market
Length: 0.33 miles
Directions: N-S, SW-NE
Directions: N-S, SW-NE
Martin Luther King Jr
Length: 0.27 miles
Direction: N-S
Direction: N-S
26th St
Length: 0.25 miles
Direction: E-W
Address range: 600 to 899
Direction: E-W
Address range: 600 to 899
27th
Length: 0.23 miles
Direction: E-W
Direction: E-W
28th St
Length: 0.23 miles
Direction: E-W
Address range: 600 to 899
Direction: E-W
Address range: 600 to 899
Sycamore St
Length: 0.22 miles
Direction: E-W
Address range: 649 to 799
Direction: E-W
Address range: 649 to 799
25th St
Length: 0.18 miles
Direction: E-W
Address range: 606 to 799
Direction: E-W
Address range: 606 to 799
Interstate 580
Length: 0.11 miles
Direction: E-W
Direction: E-W
23rd St
Length: 0.06 miles
Directions: E-W, N-S
Address range: 706 to 749
Directions: E-W, N-S
Address range: 706 to 749
Merrimac St
Length: 0.03 miles
Direction: E-W
Address range: 600 to 649
Direction: E-W
Address range: 600 to 649
Merrimac
Length: 0.01 miles
Direction: E-W
Direction: E-W