Historic Inner East neighborhood in Dayton, Ohio (OH), 45402, 45403 detailed profile
Settings
X


Business Search - 14 Million verified businesses
Area: 0.562 square miles
Population: 2,448
Population density:
| Historic Inner East: | 4,358 people per square mile |
| Dayton: | 2,437 people per square mile |

- 1,71967.1%White
- 33913.2%Hispanic or Latino
- 2078.1%Black
- 1867.3%Two or more races
- 722.8%Asian
- 381.5%American Indian

Distribution of median household income
![Distribution of median household income]()
- 66Less than $10,000
- 283$10,000 to $19,999
- 252$20,000 to $29,999
- 119$30,000 to $39,999
- 231$40,000 to $49,999
- 56$50,000 to $59,999
- 184$60,000 to $74,999
- 260$75,000 to $99,999
- 32$100,000 to $124,999
- 117$125,000 to $149,999
- 73$150,000 to $199,999
- 37$200,000 or more

Distribution of owner-occupied house/condo value
![Distribution of owner-occupied house/condo value]()
- 438Less than $50,000
- 382$50,000 to $99,999
- 191$100,000 to $149,999
- 111$150,000 to $199,999
- 144$200,000 to $249,999
- 144$250,000 to $299,999
- 70$300,000 to $399,999
- 54$400,000 to $499,999
- 25$500,000 to $749,999

Distribution of rent paid by renters
![Distribution of rent paid by renters]()
- 35Less than $100
- 68$100 to $199
- 194$200 to $299
- 200$300 to $399
- 177$400 to $499
- 818$500 to $599
- 312$600 to $699
- 244$700 to $799
- 76$800 to $899
- 82$900 to $999
- 54$1,000 to $1,249
- 40$1,250 to $1,499
- 86$1,500 to $1,999

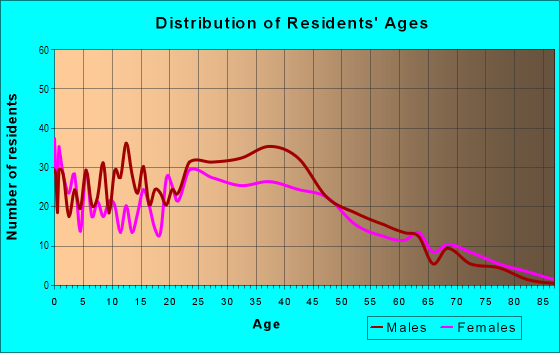
| Males: | 1,292 |
| Females: | 1,155 |
Males:
| This neighborhood: | 29.9 years |
| Whole city: | 36.3 years |
| This neighborhood: | 36.2 years |
| Whole city: | 40.2 years |
Average household size:
| Historic Inner East: | 9.9 people |
| Dayton: | 1.9 people |
Percentage of family households:
| Historic Inner East: | 36.0% |
| Dayton: | 32.6% |
| Here: | 31.9% |
| Dayton: | 24.5% |
Percentage of married-couple families with children (among all households):
| Historic Inner East: | 30.7% |
| Dayton: | 19.6% |
Percentage of single-mother households (among all households):
| Historic Inner East: | 53.6% |
| Dayton: | 24.9% |
Percentage of never married males 15 years old and over:
Percentage of never married females 15 years old and over:
| Historic Inner East: | 20.4% |
| Dayton: | 24.8% |
Percentage of never married females 15 years old and over:
| Historic Inner East: | 10.4% |
| city: | 23.3% |
Percentage of people that speak English not well or not at all:
| Historic Inner East: | 3.5% |
| Dayton: | 1.6% |
Percentage of people born in this state:
Percentage of people born in another U.S. state:
Percentage of native residents but born outside the U.S.:
Percentage of foreign born residents:
| Here: | 73.9% |
| Dayton: | 68.0% |
Percentage of people born in another U.S. state:
| Historic Inner East: | 18.2% |
| Dayton: | 26.4% |
Percentage of native residents but born outside the U.S.:
| Here: | 0.2% |
| city: | 1.7% |
Percentage of foreign born residents:
| Here: | 7.7% |
| Dayton: | 3.8% |

Owner-occupied
Renter-occupied


- Rooms in owner-occupied houses and condos in Historic Inner East
- 1991 room
- 02 rooms
- 173 rooms
- 584 rooms
- 1945 rooms
- 1006 rooms
- 1807 rooms
- 798 rooms
- 1139+ rooms

- Rooms in renter-occupied apartments in Historic Inner East
- 1871 room
- 1182 rooms
- 2753 rooms
- 974 rooms
- 895 rooms
- 1156 rooms
- 867 rooms
- 2358 rooms
- 559+ rooms
Owner-occupied
Renter-occupied

- Bedrooms in owner-occupied houses and condos in Historic Inner East
- 199no bedroom
- 2111 bedroom
- 882 bedrooms
- 2313 bedrooms
- 1054 bedrooms
- 435+ bedrooms

- Bedrooms in renter-occupied apartments in Historic Inner East
- 187no bedroom
- 3131 bedroom
- 2432 bedrooms
- 1733 bedrooms
- 554 bedrooms
- 05+ bedrooms
Average number of cars or other vehicles available in houses/condos:
Average number of cars or other vehicles available in apartments:
| This neighborhood: | 1.7 |
| Dayton: | 1.8 |
Average number of cars or other vehicles available in apartments:
| Here: | 1.3 |
| city: | 0.9 |
Percentage of units with a mortgage:
| Historic Inner East: | 58.6% |
| Dayton: | 54.7% |
Average estimated value of detached houses in 2022 (51.8% of all units):
| Historic Inner East: | $90,116 |
| Dayton: | $96,843 |

- Year house built in Historic Inner East
- 02020 or later
- 452010 to 2019
- 1262000 to 2009
- 301990 to 1999
- 2941980 to 1989
- 2281970 to 1979
- 681960 to 1969
- 311950 to 1959
- 1051940 to 1949
- 1,2781939 or earlier

City-data.com crime index for city in 2020 (higher means more crime):
| City: | 559.8 |
| U.S. average: | 219.5 |
Travel time to work (commute)
![Travel time to work (commute)]()
- 38Less than 5 minutes
- 725 to 9 minutes
- 26310 to 14 minutes
- 22015 to 19 minutes
- 15820 to 24 minutes
- 5625 to 29 minutes
- 11330 to 34 minutes
- 2235 to 39 minutes
- 4340 to 44 minutes
- 15845 to 59 minutes
- 1760 to 89 minutes
- 1190 or more minutes

Means of transportation to work
![Means of transportation to work]()
- 62.9%766Drove a car alone
- 29.0%353Carpooled
- 0.9%11Bus
- 9.8%119Bicycle
- 3.1%38Walked
- 3.9%47Other means
- 7.9%96Worked at home

Time leaving home to go to work
![Time leaving home to go to work]()
- 1912:00 a.m. to 4:59 a.m.
- 445:00 a.m. to 5:29 a.m.
- 345:30 a.m. to 5:59 a.m.
- 476:00 a.m. to 6:29 a.m.
- 1196:30 a.m. to 6:59 a.m.
- 1567:00 a.m. to 7:29 a.m.
- 1717:30 a.m. to 7:59 a.m.
- 1918:00 a.m. to 8:29 a.m.
- 618:30 a.m. to 8:59 a.m.
- 509:00 a.m. to 9:59 a.m.
- 2010:00 a.m. to 10:59 a.m.
- 311:00 a.m. to 11:59 a.m.
- 2712:00 p.m. to 3:59 p.m.
- 444:00 p.m. to 11:59 p.m.

Occupations of males:
- Percentage of males in management occupations (except farmers):
Here: 7.1% city: 7.5%
- Percentage of males in computer and mathematical occupations:
Here: 14.9% city: 3.2%
- Percentage of males in architecture and engineering occupations:
Here: 4.6% city: 3.4%
- Percentage of males in legal occupations:
Here: 2.2% city: 0.5%
- Percentage of males in education, training, and library occupations:
Here: 3.2% city: 3.4%
- Percentage of males in arts, design, entertainment, sports, and media occupations:
Here: 3.3% city: 2.9%
- Percentage of males in healthcare practitioners and technical occupations:
Here: 5.5% city: 1.7%
- Percentage of males in service occupations:
Here: 17.3% city: 18.0%
- Percentage of males in sales and office occupations:
Here: 6.6% city: 14.3%
- Percentage of males in construction, extraction, and maintenance occupations:
Here: 16.4% city: 5.2%
- Percentage of males in production occupations:
Here: 9.8% city: 13.4%
- Percentage of males in transportation occupations:
Here: 3.9% city: 8.0%
- Percentage of males in material moving occupations:
Here: 4.2% city: 8.4%
Occupations of females:
- Percentage of females in management occupations (except farmers):
Here: 9.4% city: 6.5%
- Percentage of females in business and financial operations occupations:
Here: 5.7% city: 4.8%
- Percentage of females in computer and mathematical occupations:
Here: 3.5% city: 1.8%
- Percentage of females in community and social services occupations:
Here: 11.7% city: 2.8%
- Percentage of females in legal occupations:
Here: 3.8% city: 1.1%
- Percentage of females in education, training, and library occupations:
Here: 5.7% city: 7.0%
- Percentage of females in arts, design, entertainment, sports, and media occupations:
Here: 4.1% city: 1.9%
- Percentage of females in healthcare practitioners and technical occupations:
Here: 17.5% city: 8.6%
- Percentage of females in service occupations:
Here: 3.0% city: 24.7%
- Percentage of females in sales and office occupations:
Here: 23.9% city: 27.9%
- Percentage of females in production occupations:
Here: 6.6% city: 5.9%
- Percentage of females in transportation occupations:
Here: 3.5% city: 1.6%
- Percentage of females in material moving occupations:
Here: 1.6% city: 2.8%
Percentage of people 16-64 in Armed Forces:
| Historic Inner East: | 0.4% |
| Dayton: | 1.6% |
Education in this neighborhood (subdivision or community):
- Percentage of people 3 years and older in K-12 schools:
Historic Inner East: 48.5% Dayton: 12.8%
- Percentage of people 3 years and older in undergraduate colleges:
Historic Inner East: 7.9% Dayton: 11.0%
- Percentage of people 3 years and older in grad. or professional schools:
Historic Inner East: 8.3% Dayton: 1.3%
- Percentage of students K-12 enrolled in private schools:
Historic Inner East: 73.3% Dayton: 31.5%
Percentage of population below poverty level:
| Historic Inner East: | 30.9% |
| Dayton: | 25.4% |
Median year renter moved in (as recorded in 2022):
| Historic Inner East: | 2016 |
| Dayton: | 2019 |
Percentage of married-couple families with both working:
| Historic Inner East: | 55.4% |
| Dayton: | 65.9% |

- 66.9%Utility gas
- 27.4%Electricity
- 3.3%No fuel used
- 2.4%Other fuel
Highways in this neighborhood:
US Hwy 35
Length: 1.01 miles
Direction: E-W
Direction: E-W
Roads and streets:
Mc Lain St
Length: 1.16 miles
Direction: E-W
Address range: 500 to 1899
Direction: E-W
Address range: 500 to 1899
E 5th St
Length: 1.02 miles
Direction: E-W
Address range: 1300 to 2332
Direction: E-W
Address range: 1300 to 2332
E 4th St
Length: 1.02 miles
Directions: E-W, SW-NE
Address range: 1300 to 2099
Directions: E-W, SW-NE
Address range: 1300 to 2099
Josie St
Length: 0.97 miles
Directions: E-W, N-S, SE-NW, SW-NE
Address range: 1 to 1599
Directions: E-W, N-S, SE-NW, SW-NE
Address range: 1 to 1599
Hamilton Ave
Length: 0.79 miles
Directions: E-W, SE-NW
Address range: 1 to 699
Directions: E-W, SE-NW
Address range: 1 to 699
Huffman Ave
Length: 0.50 miles
Directions: E-W, N-S, SE-NW
Address range: 39 to 414
Directions: E-W, N-S, SE-NW
Address range: 39 to 414
Plocher Ln
Length: 0.48 miles
Direction: E-W
Address range: 1400 to 1999
Direction: E-W
Address range: 1400 to 1999
Richard St
Length: 0.38 miles
Directions: E-W, N-S, SE-NW, SW-NE
Address range: 1900 to 2291
Directions: E-W, N-S, SE-NW, SW-NE
Address range: 1900 to 2291
Henry St
Length: 0.36 miles
Direction: N-S
Address range: 1 to 299
Direction: N-S
Address range: 1 to 299
Linden Ave
Length: 0.32 miles
Directions: E-W, SE-NW
Address range: 37 to 749
Directions: E-W, SE-NW
Address range: 37 to 749
Sherman St
Length: 0.30 miles
Directions: E-W, SW-NE
Address range: 1 to 299
Directions: E-W, SW-NE
Address range: 1 to 299
Boltin St
Length: 0.29 miles
Direction: N-S
Address range: 1 to 199
Direction: N-S
Address range: 1 to 199
Centre St
Length: 0.28 miles
Directions: E-W, SW-NE
Address range: 1 to 199
Directions: E-W, SW-NE
Address range: 1 to 199
McClure St
Length: 0.28 miles
Direction: N-S
Address range: 1 to 199
Direction: N-S
Address range: 1 to 199
Mc Reynolds St
Length: 0.26 miles
Direction: N-S
Address range: 1 to 199
Direction: N-S
Address range: 1 to 199
Samuel Ave
Length: 0.25 miles
Direction: N-S
Address range: 1 to 199
Direction: N-S
Address range: 1 to 199
Drummer Ave
Length: 0.24 miles
Direction: N-S
Address range: 1 to 199
Direction: N-S
Address range: 1 to 199
High St
Length: 0.24 miles
Direction: N-S
Address range: 1 to 273
Direction: N-S
Address range: 1 to 273
S Van Lear St
Length: 0.22 miles
Direction: N-S
Address range: 29 to 199
Direction: N-S
Address range: 29 to 199
St Jude Ave
Length: 0.21 miles
Direction: N-S
Address range: 1 to 299
Direction: N-S
Address range: 1 to 299
S Dutoit St
Length: 0.21 miles
Direction: N-S
Address range: 25 to 299
Direction: N-S
Address range: 25 to 299
S Clinton St
Length: 0.21 miles
Direction: N-S
Address range: 100 to 299
Direction: N-S
Address range: 100 to 299
Milton St
Length: 0.20 miles
Directions: N-S, SE-NW
Address range: 1 to 199
Directions: N-S, SE-NW
Address range: 1 to 199
Wyoming Hamilton Con
Length: 0.18 miles
Directions: N-S, SW-NE
Directions: N-S, SW-NE
Columbus St
Length: 0.18 miles
Direction: N-S
Address range: 100 to 299
Direction: N-S
Address range: 100 to 299
Bacon St
Length: 0.16 miles
Directions: E-W, SW-NE
Address range: 400 to 499
Directions: E-W, SW-NE
Address range: 400 to 499
Simms St
Length: 0.15 miles
Directions: E-W, SW-NE
Address range: 1 to 99
Directions: E-W, SW-NE
Address range: 1 to 99
Yates St
Length: 0.13 miles
Directions: N-S, SW-NE
Address range: 1 to 299
Directions: N-S, SW-NE
Address range: 1 to 299
Labelle St
Length: 0.13 miles
Direction: N-S
Address range: 1 to 99
Direction: N-S
Address range: 1 to 99
Bell St
Length: 0.13 miles
Direction: SE-NW
Address range: 40 to 99
Direction: SE-NW
Address range: 40 to 99
S Terry St
Length: 0.13 miles
Direction: N-S
Address range: 100 to 199
Direction: N-S
Address range: 100 to 199
Ringgold St
Length: 0.13 miles
Direction: N-S
Address range: 100 to 199
Direction: N-S
Address range: 100 to 199
S June St
Length: 0.13 miles
Direction: N-S
Address range: 100 to 199
Direction: N-S
Address range: 100 to 199
Pritz Ave
Length: 0.11 miles
Direction: N-S
Address range: 228 to 399
Direction: N-S
Address range: 228 to 399
Sander Ct
Length: 0.11 miles
Direction: E-W
Address range: 1 to 99
Direction: E-W
Address range: 1 to 99
Rott St
Length: 0.10 miles
Direction: N-S
Address range: 200 to 299
Direction: N-S
Address range: 200 to 299
la Belle St
Length: 0.10 miles
Direction: N-S
Address range: 100 to 199
Direction: N-S
Address range: 100 to 199
Tower Ln
Length: 0.10 miles
Direction: N-S
Address range: 1 to 99
Direction: N-S
Address range: 1 to 99
Potomac St
Length: 0.10 miles
Direction: N-S
Address range: 1 to 199
Direction: N-S
Address range: 1 to 199
John St
Length: 0.09 miles
Directions: N-S, SW-NE
Address range: 1 to 99
Directions: N-S, SW-NE
Address range: 1 to 99
Tato St
Length: 0.08 miles
Directions: N-S, SW-NE
Address range: 2 to 99
Directions: N-S, SW-NE
Address range: 2 to 99
Bantz Ct
Length: 0.07 miles
Direction: E-W
Address range: 400 to 499
Direction: E-W
Address range: 400 to 499
Eichel Ln
Length: 0.04 miles
Direction: E-W
Address range: 31 to 99
Direction: E-W
Address range: 31 to 99
Mabel Ave
Length: 0.03 miles
Direction: N-S
Direction: N-S
Railroad features:
Conrail RR
Length: 0.59 miles
Direction: E-W
Direction: E-W