Highland Park neighborhood in Norfolk, Virginia (VA), 23508 detailed profile
Settings
X


Business Search - 14 Million verified businesses
Area: 0.240 square miles
Population: 2,070
Population density:
| Highland Park: | 8,629 people per square mile |
| Norfolk: | 4,337 people per square mile |

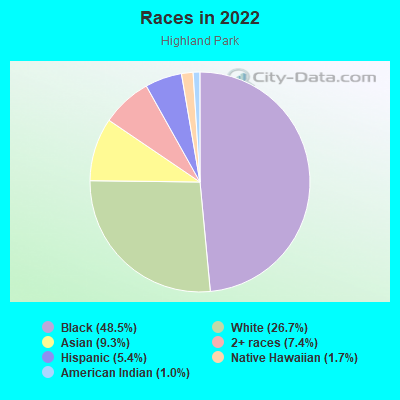
- 1,01548.5%Black
- 55926.7%White
- 1959.3%Asian
- 1557.4%Two or more races
- 1125.4%Hispanic or Latino
- 361.7%Native Hawaiian and Other
Pacific Islander - 201.0%American Indian
Median household income in 2022:
| Highland Park: | $51,341 |
| Norfolk: | $61,090 |
Distribution of median household income
![Distribution of median household income]()
- 76Less than $10,000
- 152$10,000 to $19,999
- 102$20,000 to $29,999
- 53$30,000 to $39,999
- 73$40,000 to $49,999
- 64$50,000 to $59,999
- 45$60,000 to $74,999
- 51$75,000 to $99,999
- 18$100,000 to $124,999
- 36$125,000 to $149,999
- 98$150,000 to $199,999
- 119$200,000 or more

Distribution of owner-occupied house/condo value
![Distribution of owner-occupied house/condo value]()
- 4$50,000 to $99,999
- 12$100,000 to $149,999
- 23$150,000 to $199,999
- 77$200,000 to $249,999
- 57$250,000 to $299,999
- 166$300,000 to $399,999
- 23$400,000 to $499,999
- 80$500,000 to $749,999
- 24$1,000,000 or more

Distribution of rent paid by renters
![Distribution of rent paid by renters]()
- 25$200 to $299
- 4$400 to $499
- 13$500 to $599
- 23$600 to $699
- 49$700 to $799
- 56$800 to $899
- 38$900 to $999
- 35$1,000 to $1,249
- 199$1,250 to $1,499
- 73$1,500 to $1,999
- 89$2,000 or more

Median rent in 2022:
| Highland Park: | $1,259 |
| Norfolk: | $1,035 |
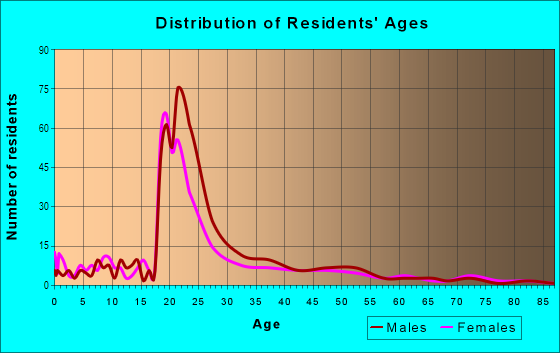
| Males: | 1,089 |
| Females: | 980 |
Males:
| This neighborhood: | 28.5 years |
| Whole city: | 31.3 years |
| This neighborhood: | 28.2 years |
| Whole city: | 34.4 years |
Average household size:
| Highland Park: | 6.9 people |
| Norfolk: | 2.3 people |
Percentage of family households:
| Highland Park: | 15.1% |
| Norfolk: | 41.3% |
| Here: | 13.0% |
| Norfolk: | 31.7% |
Percentage of married-couple families with children (among all households):
| Highland Park: | 28.6% |
| Norfolk: | 20.2% |
Percentage of single-mother households (among all households):
| Highland Park: | 15.4% |
| Norfolk: | 16.3% |
Percentage of never married males 15 years old and over:
Percentage of never married females 15 years old and over:
| Highland Park: | 49.7% |
| Norfolk: | 25.4% |
Percentage of never married females 15 years old and over:
| Highland Park: | 43.0% |
| city: | 20.5% |
Percentage of people that speak English not well or not at all:
| Highland Park: | 0.2% |
| Norfolk: | 1.4% |
Percentage of people born in this state:
Percentage of people born in another U.S. state:
Percentage of native residents but born outside the U.S.:
Percentage of foreign born residents:
| Here: | 53.6% |
| Norfolk: | 51.1% |
Percentage of people born in another U.S. state:
| Highland Park: | 33.7% |
| Norfolk: | 40.8% |
Percentage of native residents but born outside the U.S.:
| Here: | 0.8% |
| city: | 1.6% |
Percentage of foreign born residents:
| Here: | 11.9% |
| Norfolk: | 6.5% |
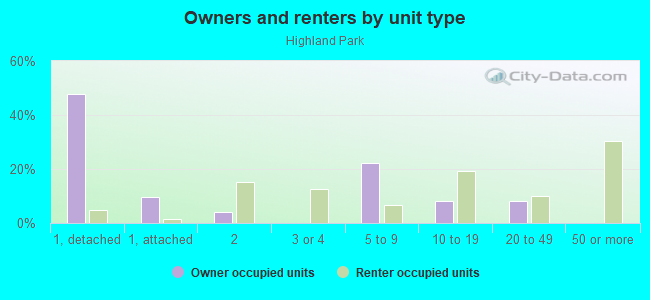
Owner-occupied
Renter-occupied

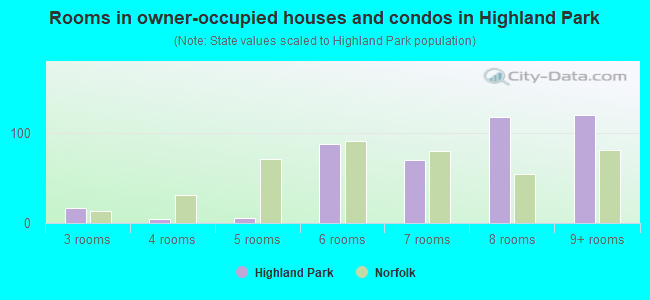
- Rooms in owner-occupied houses and condos in Highland Park
- 01 room
- 02 rooms
- 173 rooms
- 44 rooms
- 65 rooms
- 886 rooms
- 707 rooms
- 1188 rooms
- 1209+ rooms
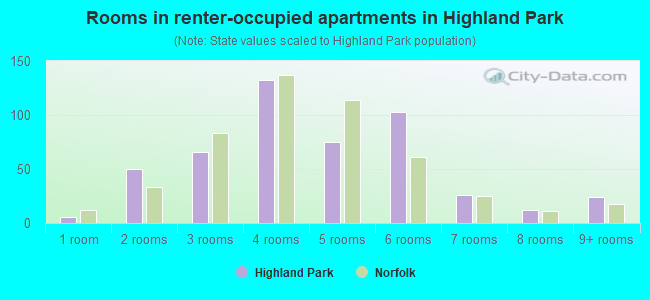
- Rooms in renter-occupied apartments in Highland Park
- 61 room
- 502 rooms
- 663 rooms
- 1324 rooms
- 755 rooms
- 1036 rooms
- 267 rooms
- 128 rooms
- 249+ rooms
Owner-occupied
Renter-occupied
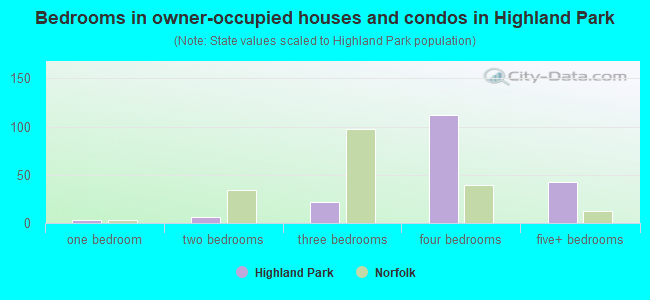
- Bedrooms in owner-occupied houses and condos in Highland Park
- 0no bedroom
- 31 bedroom
- 62 bedrooms
- 223 bedrooms
- 1124 bedrooms
- 435+ bedrooms
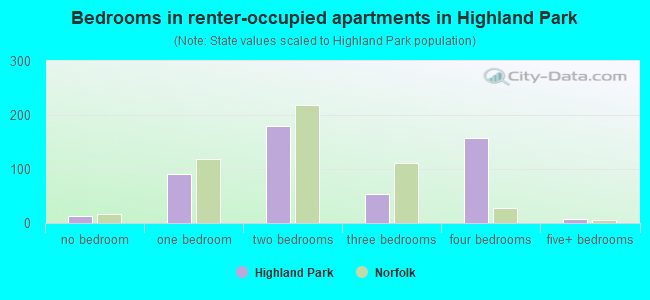
- Bedrooms in renter-occupied apartments in Highland Park
- 13no bedroom
- 901 bedroom
- 1802 bedrooms
- 533 bedrooms
- 1584 bedrooms
- 75+ bedrooms
Average number of cars or other vehicles available in houses/condos:
Average number of cars or other vehicles available in apartments:
| This neighborhood: | |
| Norfolk: |
Average number of cars or other vehicles available in apartments:
| Here: | 1.6 |
| city: | 1.3 |
Percentage of units with a mortgage:
| Highland Park: | 82.3% |
| Norfolk: | 70.0% |
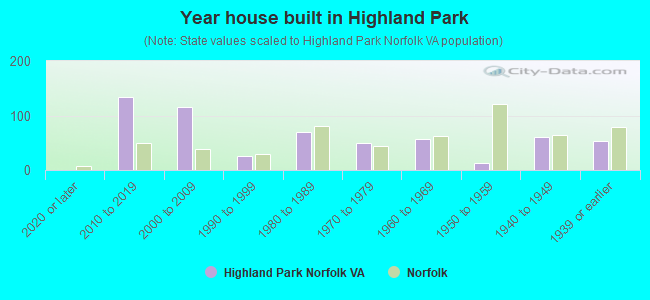
- Year house built in Highland Park
- 02020 or later
- 1342010 to 2019
- 1152000 to 2009
- 261990 to 1999
- 701980 to 1989
- 491970 to 1979
- 561960 to 1969
- 121950 to 1959
- 601940 to 1949
- 531939 or earlier
City-data.com crime index for city in 2020 (higher means more crime):
| City: | 327.9 |
| U.S. average: | 219.5 |
Travel time to work (commute)
![Travel time to work (commute)]()
- 44Less than 5 minutes
- 2005 to 9 minutes
- 20410 to 14 minutes
- 17115 to 19 minutes
- 14920 to 24 minutes
- 3625 to 29 minutes
- 14830 to 34 minutes
- 835 to 39 minutes
- 5740 to 44 minutes
- 7045 to 59 minutes
- 5660 to 89 minutes
- 10290 or more minutes

Means of transportation to work
![Means of transportation to work]()
- 45.6%461Drove a car alone
- 8.1%82Carpooled
- 3.6%36Bus
- 0.9%9Subway or elevated rail
- 0.3%3Taxi
- 1.8%18Motorcycle
- 4.4%44Bicycle
- 24.2%245Walked
- 5.7%58Other means
- 10.5%106Worked at home

Time leaving home to go to work
![Time leaving home to go to work]()
- 9412:00 a.m. to 4:59 a.m.
- 45:00 a.m. to 5:29 a.m.
- 295:30 a.m. to 5:59 a.m.
- 596:00 a.m. to 6:29 a.m.
- 386:30 a.m. to 6:59 a.m.
- 507:00 a.m. to 7:29 a.m.
- 817:30 a.m. to 7:59 a.m.
- 1998:00 a.m. to 8:29 a.m.
- 408:30 a.m. to 8:59 a.m.
- 1699:00 a.m. to 9:59 a.m.
- 11910:00 a.m. to 10:59 a.m.
- 5711:00 a.m. to 11:59 a.m.
- 18112:00 p.m. to 3:59 p.m.
- 934:00 p.m. to 11:59 p.m.

Occupations of males:
- Percentage of males in management occupations (except farmers):
Here: 6.7% city: 8.2%
- Percentage of males in business and financial operations occupations:
Here: 2.5% city: 4.4%
- Percentage of males in computer and mathematical occupations:
Here: 9.5% city: 4.2%
- Percentage of males in architecture and engineering occupations:
Here: 1.8% city: 3.7%
- Percentage of males in life, physical, and social science occupations:
Here: 2.5% city: 1.2%
- Percentage of males in education, training, and library occupations:
Here: 11.1% city: 3.9%
- Percentage of males in arts, design, entertainment, sports, and media occupations:
Here: 6.1% city: 2.2%
- Percentage of males in service occupations:
Here: 18.6% city: 16.9%
- Percentage of males in sales and office occupations:
Here: 22.0% city: 15.6%
- Percentage of males in construction, extraction, and maintenance occupations:
Here: 4.1% city: 9.8%
- Percentage of males in production occupations:
Here: 3.6% city: 6.5%
- Percentage of males in transportation occupations:
Here: 1.9% city: 5.3%
- Percentage of males in material moving occupations:
Here: 9.4% city: 5.3%
Occupations of females:
- Percentage of females in management occupations (except farmers):
Here: 5.0% city: 7.7%
- Percentage of females in computer and mathematical occupations:
Here: 1.7% city: 1.7%
- Percentage of females in education, training, and library occupations:
Here: 17.6% city: 9.1%
- Percentage of females in healthcare practitioners and technical occupations:
Here: 7.4% city: 9.6%
- Percentage of females in service occupations:
Here: 33.4% city: 22.3%
- Percentage of females in sales and office occupations:
Here: 28.4% city: 28.7%
- Percentage of females in production occupations:
Here: 3.0% city: 2.7%
- Percentage of females in transportation occupations:
Here: 1.7% city: 1.6%
Percentage of people 16-64 in Armed Forces:
| Highland Park: | 2.1% |
| Norfolk: | 15.8% |
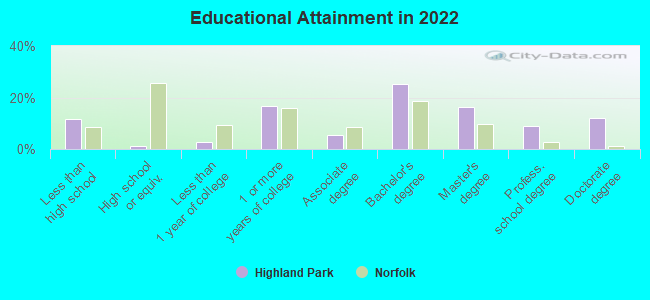
Education in this neighborhood (subdivision or community):
- Percentage of people 3 years and older in K-12 schools:
Highland Park: 7.4% Norfolk: 14.3%
- Percentage of people 3 years and older in undergraduate colleges:
Highland Park: 75.8% Norfolk: 8.0%
- Percentage of people 3 years and older in grad. or professional schools:
Highland Park: 6.9% Norfolk: 2.1%
- Percentage of students K-12 enrolled in private schools:
Highland Park: 54.6% Norfolk: 16.2%
Percentage of population below poverty level:
| Highland Park: | 40.8% |
| Norfolk: | 17.7% |
Median year renter moved in (as recorded in 2022):
| Highland Park: | 2019 |
| Norfolk: | 2020 |
Percentage of married-couple families with both working:
| Highland Park: | 52.5% |
| Norfolk: | 65.5% |
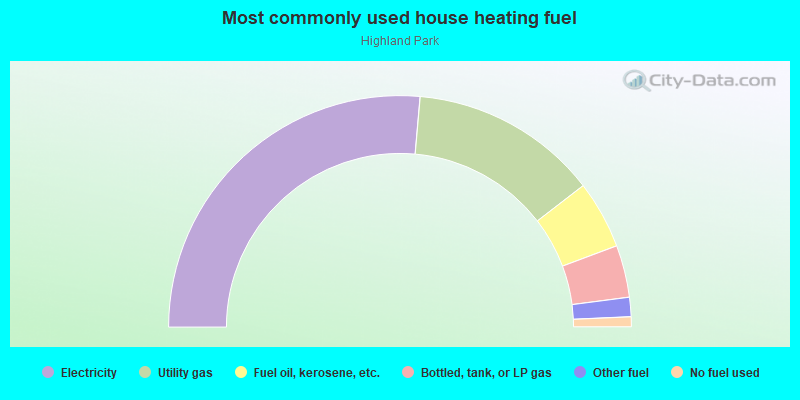
- 52.8%Electricity
- 26.3%Utility gas
- 9.5%Fuel oil, kerosene, etc.
- 7.3%Bottled, tank, or LP gas
- 2.7%Other fuel
- 1.4%No fuel used
Roads and streets:
Colley Ave
Length: 0.77 miles
Direction: N-S
Address range: 3800 to 5299
Direction: N-S
Address range: 3800 to 5299
W 49th St
Length: 0.47 miles
Direction: E-W
Address range: 700 to 1043
Direction: E-W
Address range: 700 to 1043
W 48th St
Length: 0.47 miles
Direction: E-W
Address range: 700 to 1049
Direction: E-W
Address range: 700 to 1049
W 50th St
Length: 0.37 miles
Direction: E-W
Address range: 700 to 1099
Direction: E-W
Address range: 700 to 1099
W 51st St
Length: 0.35 miles
Directions: E-W, SW-NE
Address range: 700 to 899
Directions: E-W, SW-NE
Address range: 700 to 899
W 52nd St
Length: 0.25 miles
Direction: E-W
Address range: 700 to 899
Direction: E-W
Address range: 700 to 899
Killam Ave
Length: 0.15 miles
Directions: N-S, SW-NE
Address range: 4800 to 5099
Directions: N-S, SW-NE
Address range: 4800 to 5099
Mayflower Rd
Length: 0.10 miles
Direction: N-S
Direction: N-S
W 46th St
Length: 0.07 miles
Directions: E-W, N-S, SE-NW
Address range: 700 to 799
Directions: E-W, N-S, SE-NW
Address range: 700 to 799
W 41st St
Length: 0.06 miles
Direction: E-W
Address range: 700 to 799
Direction: E-W
Address range: 700 to 799
W 45th St
Length: 0.06 miles
Direction: E-W
Address range: 700 to 799
Direction: E-W
Address range: 700 to 799
W 53rd St
Length: 0.06 miles
Direction: E-W
Direction: E-W
Waterfront Dr
Length: 0.05 miles
Direction: SW-NE
Address range: 4801 to 4819
Direction: SW-NE
Address range: 4801 to 4819
W 40th St
Length: 0.05 miles
Direction: E-W
Address range: 700 to 799
Direction: E-W
Address range: 700 to 799
Michigan Ave
Length: 0.04 miles
Direction: E-W
Address range: 762 to 799
Direction: E-W
Address range: 762 to 799
W 44th St
Length: 0.04 miles
Direction: E-W
Address range: 700 to 799
Direction: E-W
Address range: 700 to 799
W 43rd St
Length: 0.03 miles
Direction: SW-NE
Address range: 700 to 799
Direction: SW-NE
Address range: 700 to 799
W 47th St
Length: 0.03 miles
Direction: E-W
Address range: 700 to 799
Direction: E-W
Address range: 700 to 799