Glenwood Park neighborhood in Norfolk, Virginia (VA), 23505 detailed profile
Settings
X


Business Search - 14 Million verified businesses
Area: 0.186 square miles
Population: 1,337
Population density:
| Glenwood Park: | 7,189 people per square mile |
| Norfolk: | 4,337 people per square mile |

- 50234.0%White
- 49133.3%Black
- 24316.5%Hispanic or Latino
- 1369.2%Asian
- 1047.0%Two or more races

Median household income in 2022:
| Glenwood Park: | $49,763 |
| Norfolk: | $61,090 |
Distribution of median household income
![Distribution of median household income]()
- 64Less than $10,000
- 56$10,000 to $19,999
- 77$20,000 to $29,999
- 81$30,000 to $39,999
- 79$40,000 to $49,999
- 136$50,000 to $59,999
- 67$60,000 to $74,999
- 81$75,000 to $99,999
- 53$100,000 to $124,999
- 16$125,000 to $149,999
- 22$200,000 or more

Distribution of owner-occupied house/condo value
![Distribution of owner-occupied house/condo value]()
- 28$50,000 to $99,999
- 13$100,000 to $149,999
- 58$150,000 to $199,999
- 49$200,000 to $249,999
- 22$300,000 to $399,999
- 17$1,000,000 or more

Distribution of rent paid by renters
![Distribution of rent paid by renters]()
- 14Less than $100
- 25$200 to $299
- 43$700 to $799
- 158$800 to $899
- 124$900 to $999
- 169$1,000 to $1,249
- 89$1,250 to $1,499
- 67$1,500 to $1,999

Median rent in 2022:
| Glenwood Park: | $1,069 |
| Norfolk: | $1,035 |
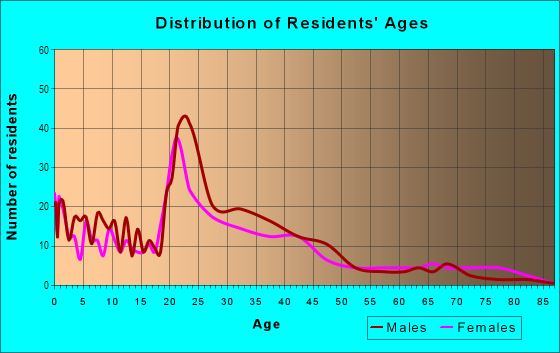
| Males: | 794 |
| Females: | 543 |
Males:
| This neighborhood: | 27.0 years |
| Whole city: | 31.3 years |
| This neighborhood: | 30.1 years |
| Whole city: | 34.4 years |
Average household size:
| Glenwood Park: | 8.0 people |
| Norfolk: | 2.3 people |
Percentage of family households:
| Glenwood Park: | 25.2% |
| Norfolk: | 41.3% |
| Here: | 14.8% |
| Norfolk: | 31.7% |
Percentage of married-couple families with children (among all households):
| Glenwood Park: | 16.6% |
| Norfolk: | 20.2% |
Percentage of single-mother households (among all households):
| Glenwood Park: | 44.5% |
| Norfolk: | 16.3% |
Percentage of never married males 15 years old and over:
Percentage of never married females 15 years old and over:
| Glenwood Park: | 32.6% |
| Norfolk: | 25.4% |
Percentage of never married females 15 years old and over:
| Glenwood Park: | 15.6% |
| city: | 20.5% |
Percentage of people that speak English not well or not at all:
| Glenwood Park: | 0.0% |
| Norfolk: | 1.4% |
Percentage of people born in this state:
Percentage of people born in another U.S. state:
Percentage of native residents but born outside the U.S.:
Percentage of foreign born residents:
| Here: | 31.9% |
| Norfolk: | 51.1% |
Percentage of people born in another U.S. state:
| Glenwood Park: | 57.2% |
| Norfolk: | 40.8% |
Percentage of native residents but born outside the U.S.:
| Here: | 2.4% |
| city: | 1.6% |
Percentage of foreign born residents:
| Here: | 8.5% |
| Norfolk: | 6.5% |

Owner-occupied
Renter-occupied


- Rooms in owner-occupied houses and condos in Glenwood Park
- 01 room
- 02 rooms
- 93 rooms
- 624 rooms
- 235 rooms
- 56 rooms
- 47 rooms
- 188 rooms
- 319+ rooms

- Rooms in renter-occupied apartments in Glenwood Park
- 01 room
- 252 rooms
- 2213 rooms
- 2934 rooms
- 1055 rooms
- 196 rooms
- 467 rooms
- 08 rooms
- 09+ rooms
Owner-occupied
Renter-occupied

- Bedrooms in owner-occupied houses and condos in Glenwood Park
- 0no bedroom
- 01 bedroom
- 632 bedrooms
- 393 bedrooms
- 424 bedrooms
- 05+ bedrooms

- Bedrooms in renter-occupied apartments in Glenwood Park
- 0no bedroom
- 1461 bedroom
- 3462 bedrooms
- 323 bedrooms
- 634 bedrooms
- 05+ bedrooms
Average number of cars or other vehicles available in houses/condos:
Average number of cars or other vehicles available in apartments:
| This neighborhood: | 2.0 |
| Norfolk: | 2.0 |
Average number of cars or other vehicles available in apartments:
| Here: | 1.1 |
| city: | 1.3 |
Percentage of units with a mortgage:
| Glenwood Park: | 72.8% |
| Norfolk: | 70.0% |
Average estimated value of detached houses in 2022 (31.9% of all units):
| Glenwood Park: | $1,136,226 |
| Norfolk: | $337,508 |

- Year house built in Glenwood Park
- 02020 or later
- 392010 to 2019
- 02000 to 2009
- 851990 to 1999
- 2031980 to 1989
- 511970 to 1979
- 1551960 to 1969
- 1211950 to 1959
- 1991940 to 1949
- 191939 or earlier

City-data.com crime index for city in 2020 (higher means more crime):
| City: | 327.9 |
| U.S. average: | 219.5 |
Travel time to work (commute)
![Travel time to work (commute)]()
- 9Less than 5 minutes
- 875 to 9 minutes
- 13110 to 14 minutes
- 20815 to 19 minutes
- 34020 to 24 minutes
- 1625 to 29 minutes
- 10430 to 34 minutes
- 2335 to 39 minutes
- 1440 to 44 minutes
- 1545 to 59 minutes
- 860 to 89 minutes

Means of transportation to work
![Means of transportation to work]()
- 78.4%741Drove a car alone
- 14.9%141Carpooled
- 2.9%27Bus
- 3.8%36Walked
- 2.5%24Worked at home

Time leaving home to go to work
![Time leaving home to go to work]()
- 16512:00 a.m. to 4:59 a.m.
- 445:00 a.m. to 5:29 a.m.
- 1205:30 a.m. to 5:59 a.m.
- 706:00 a.m. to 6:29 a.m.
- 1446:30 a.m. to 6:59 a.m.
- 917:00 a.m. to 7:29 a.m.
- 1157:30 a.m. to 7:59 a.m.
- 408:00 a.m. to 8:29 a.m.
- 58:30 a.m. to 8:59 a.m.
- 429:00 a.m. to 9:59 a.m.
- 610:00 a.m. to 10:59 a.m.
- 4912:00 p.m. to 3:59 p.m.
- 534:00 p.m. to 11:59 p.m.

Occupations of males:
- Percentage of males in management occupations (except farmers):
Here: 2.6% city: 8.2%
- Percentage of males in computer and mathematical occupations:
Here: 10.3% city: 4.2%
- Percentage of males in life, physical, and social science occupations:
Here: 4.8% city: 1.2%
- Percentage of males in education, training, and library occupations:
Here: 13.8% city: 3.9%
- Percentage of males in service occupations:
Here: 27.1% city: 16.9%
- Percentage of males in sales and office occupations:
Here: 9.9% city: 15.6%
- Percentage of males in construction, extraction, and maintenance occupations:
Here: 5.3% city: 9.8%
- Percentage of males in production occupations:
Here: 8.1% city: 6.5%
- Percentage of males in transportation occupations:
Here: 11.0% city: 5.3%
Occupations of females:
- Percentage of females in management occupations (except farmers):
Here: 1.2% city: 7.7%
- Percentage of females in business and financial operations occupations:
Here: 2.0% city: 5.2%
- Percentage of females in community and social services occupations:
Here: 1.2% city: 3.1%
- Percentage of females in education, training, and library occupations:
Here: 5.9% city: 9.1%
- Percentage of females in healthcare practitioners and technical occupations:
Here: 8.5% city: 9.6%
- Percentage of females in service occupations:
Here: 35.4% city: 22.3%
- Percentage of females in sales and office occupations:
Here: 40.9% city: 28.7%
- Percentage of females in material moving occupations:
Here: 4.9% city: 2.4%
Percentage of people 16-64 in Armed Forces:
| Glenwood Park: | 39.3% |
| Norfolk: | 15.8% |
Education in this neighborhood (subdivision or community):
- Percentage of people 3 years and older in K-12 schools:
Glenwood Park: 7.4% Norfolk: 14.3%
- Percentage of people 3 years and older in undergraduate colleges:
Glenwood Park: 22.6% Norfolk: 8.0%
- Percentage of people 3 years and older in grad. or professional schools:
Glenwood Park: 1.7% Norfolk: 2.1%
- Percentage of students K-12 enrolled in private schools:
Glenwood Park: 0.0% Norfolk: 16.2%
Percentage of population below poverty level:
| Glenwood Park: | 14.9% |
| Norfolk: | 17.7% |
Median year owner moved in (as recorded in 2022):
Median year renter moved in (as recorded in 2022):
| Glenwood Park: | 2006 |
| Norfolk: | 2013 |
Median year renter moved in (as recorded in 2022):
| Glenwood Park: | 2018 |
| Norfolk: | 2020 |
Percentage of married-couple families with both working:
| Glenwood Park: | 34.5% |
| Norfolk: | 65.5% |

- 76.8%Electricity
- 14.3%Utility gas
- 6.2%No fuel used
- 2.6%Fuel oil, kerosene, etc.
Roads and streets:
Forrest Ave
Length: 0.74 miles
Directions: E-W, SW-NE
Address range: 105 to 599
Directions: E-W, SW-NE
Address range: 105 to 599
Woodview Ave
Length: 0.73 miles
Direction: E-W
Address range: 110 to 599
Direction: E-W
Address range: 110 to 599
Glendale Ave
Length: 0.73 miles
Direction: E-W
Address range: 104 to 599
Direction: E-W
Address range: 104 to 599
Rogers Ave
Length: 0.53 miles
Direction: E-W
Address range: 113 to 419
Direction: E-W
Address range: 113 to 419
Greenbrier Ave
Length: 0.51 miles
Direction: E-W
Address range: 111 to 299
Direction: E-W
Address range: 111 to 299
Beechwood Ave
Length: 0.47 miles
Direction: E-W
Address range: 104 to 399
Direction: E-W
Address range: 104 to 399
Glen Myrtle Ave
Length: 0.32 miles
Direction: N-S
Address range: 8100 to 8699
Direction: N-S
Address range: 8100 to 8699
Laurel Ave
Length: 0.31 miles
Direction: N-S
Address range: 8100 to 8699
Direction: N-S
Address range: 8100 to 8699
Evergreen Ave
Length: 0.25 miles
Direction: N-S
Address range: 8100 to 8515
Direction: N-S
Address range: 8100 to 8515
Mapleshade Ave
Length: 0.18 miles
Direction: E-W
Address range: 112 to 199
Direction: E-W
Address range: 112 to 199
Boush Creek Ave
Length: 0.16 miles
Directions: N-S, SE-NW
Address range: 8100 to 8399
Directions: N-S, SE-NW
Address range: 8100 to 8399