Downtown Westmont (Downtown) neighborhood in Westmont, Illinois (IL), 60559 detailed profile
Settings
X


Business Search - 14 Million verified businesses
Area: 0.077 square miles
Population: 468
Population density:
| Downtown Westmont (Downtown): | 6,040 people per square mile |
| Westmont: | 4,957 people per square mile |

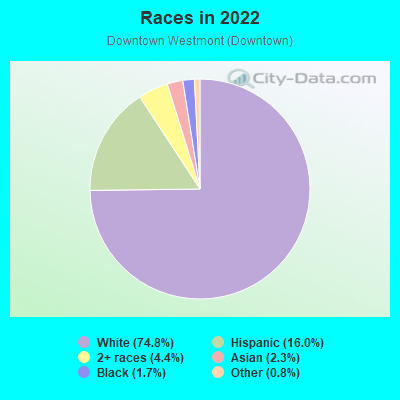
- 35674.8%White
- 7616.0%Hispanic or Latino
- 214.4%Two or more races
- 112.3%Asian
- 81.7%Black
- 40.8%Some other race
Distribution of median household income
![Distribution of median household income]()
- 8Less than $10,000
- 12$10,000 to $19,999
- 15$20,000 to $29,999
- 16$30,000 to $39,999
- 9$40,000 to $49,999
- 13$50,000 to $59,999
- 9$60,000 to $74,999
- 29$75,000 to $99,999
- 24$100,000 to $124,999
- 14$125,000 to $149,999
- 12$150,000 to $199,999
- 43$200,000 or more

Distribution of owner-occupied house/condo value
![Distribution of owner-occupied house/condo value]()
- 21Less than $50,000
- 11$50,000 to $99,999
- 5$100,000 to $149,999
- 6$150,000 to $199,999
- 13$200,000 to $249,999
- 17$250,000 to $299,999
- 33$300,000 to $399,999
- 12$400,000 to $499,999
- 39$500,000 to $749,999
- 5$750,000 to $999,999
- 3$1,000,000 or more

Distribution of rent paid by renters
![Distribution of rent paid by renters]()
- 5$600 to $699
- 1$700 to $799
- 4$800 to $899
- 7$900 to $999
- 20$1,000 to $1,249
- 18$1,250 to $1,499
- 9$1,500 to $1,999
- 9$2,000 or more

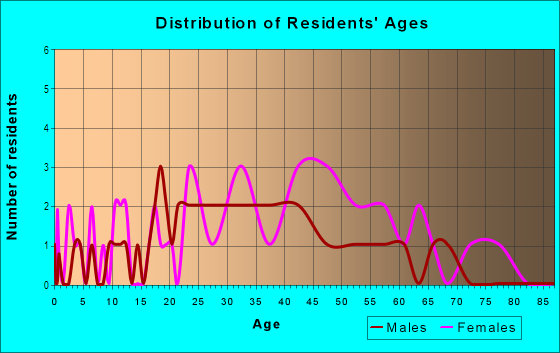
| Males: | 247 |
| Females: | 221 |
Males:
| This neighborhood: | 36.6 years |
| Whole city: | 39.7 years |
| This neighborhood: | 42.5 years |
| Whole city: | 42.6 years |
Average household size:
| Downtown Westmont (Downtown): | 2.6 people |
| Westmont: | 2.3 people |
Percentage of family households:
| Downtown Westmont (Downtown): | 68.6% |
| Westmont: | 46.3% |
| Here: | 67.0% |
| Westmont: | 47.1% |
Percentage of married-couple families with children (among all households):
| Downtown Westmont (Downtown): | 29.2% |
| Westmont: | 29.9% |
Percentage of single-mother households (among all households):
| Downtown Westmont (Downtown): | 7.7% |
| Westmont: | 10.5% |
Percentage of never married males 15 years old and over:
Percentage of never married females 15 years old and over:
| Downtown Westmont (Downtown): | 19.9% |
| Westmont: | 15.3% |
Percentage of never married females 15 years old and over:
| Downtown Westmont (Downtown): | 9.6% |
| village: | 14.9% |
Percentage of people that speak English not well or not at all:
| Downtown Westmont (Downtown): | 2.5% |
| Westmont: | 3.3% |
Percentage of people born in this state:
Percentage of people born in another U.S. state:
Percentage of native residents but born outside the U.S.:
Percentage of foreign born residents:
| Here: | 71.2% |
| Westmont: | 59.4% |
Percentage of people born in another U.S. state:
| Downtown Westmont (Downtown): | 14.6% |
| Westmont: | 15.3% |
Percentage of native residents but born outside the U.S.:
| Here: | 0.5% |
| village: | 0.7% |
Percentage of foreign born residents:
| Here: | 13.7% |
| Westmont: | 24.7% |
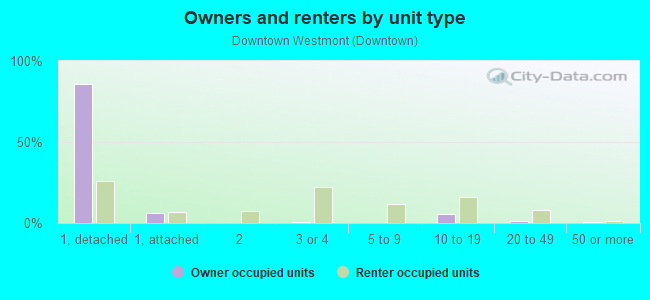
Owner-occupied
Renter-occupied

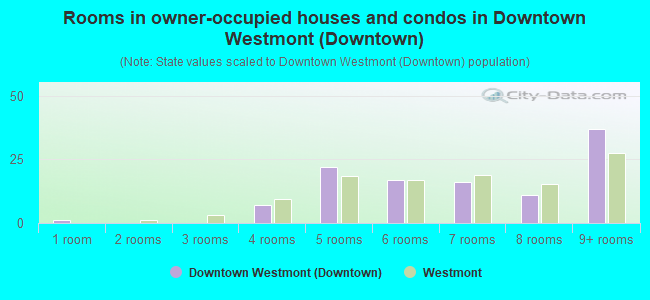
- Rooms in owner-occupied houses and condos in Downtown Westmont <
> - 11 room
- 02 rooms
- 03 rooms
- 74 rooms
- 225 rooms
- 176 rooms
- 167 rooms
- 118 rooms
- 379+ rooms
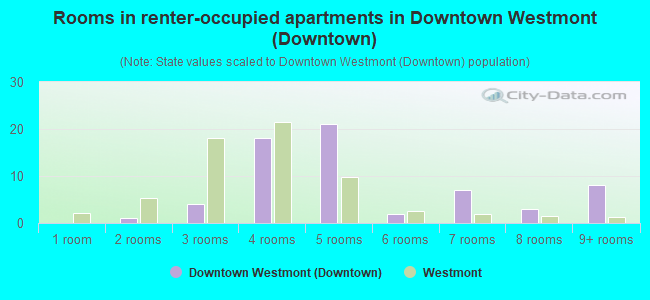
- Rooms in renter-occupied apartments in Downtown Westmont <
> - 01 room
- 12 rooms
- 43 rooms
- 184 rooms
- 215 rooms
- 26 rooms
- 77 rooms
- 38 rooms
- 89+ rooms
Owner-occupied
Renter-occupied
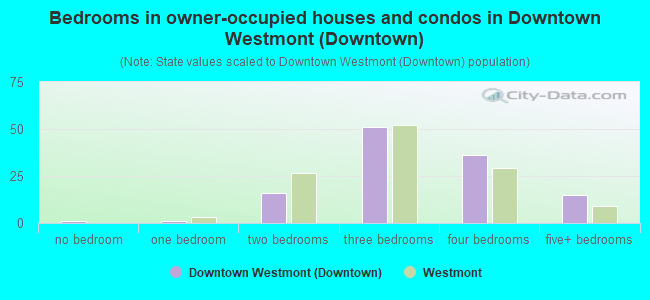
- Bedrooms in owner-occupied houses and condos in Downtown Westmont <
> - 1no bedroom
- 11 bedroom
- 162 bedrooms
- 513 bedrooms
- 364 bedrooms
- 155+ bedrooms
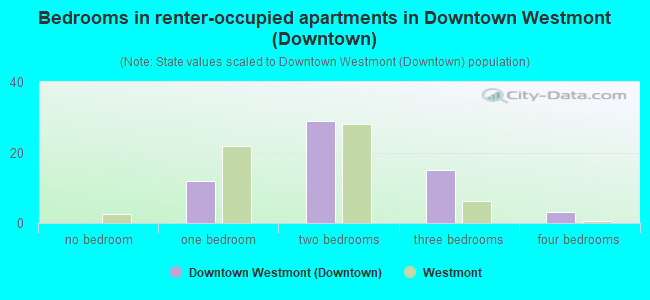
- Bedrooms in renter-occupied apartments in Downtown Westmont <
> - 0no bedroom
- 121 bedroom
- 292 bedrooms
- 153 bedrooms
- 34 bedrooms
- 05+ bedrooms
Average number of cars or other vehicles available in houses/condos:
Average number of cars or other vehicles available in apartments:
| This neighborhood: | 2.2 |
| Westmont: | 1.9 |
Average number of cars or other vehicles available in apartments:
| Here: | 2.0 |
| village: | 1.3 |
Percentage of units with a mortgage:
| Downtown Westmont (Downtown): | 66.7% |
| Westmont: | 60.6% |
Average estimated value of detached houses in 2022 (79.0% of all units):
| Downtown Westmont (Downtown): | $462,772 |
| Westmont: | $437,393 |
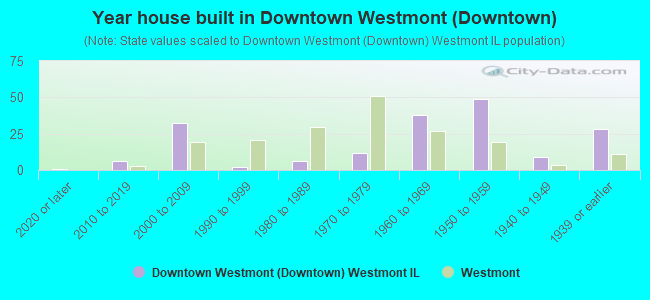
- Year house built in Downtown Westmont <
> - 12020 or later
- 62010 to 2019
- 322000 to 2009
- 21990 to 1999
- 61980 to 1989
- 121970 to 1979
- 381960 to 1969
- 491950 to 1959
- 91940 to 1949
- 281939 or earlier
City-data.com crime index for village in 2020 (higher means more crime):
| City: | 137.7 |
| U.S. average: | 219.5 |
Travel time to work (commute)
![Travel time to work (commute)]()
- 3Less than 5 minutes
- 245 to 9 minutes
- 1910 to 14 minutes
- 3715 to 19 minutes
- 1820 to 24 minutes
- 625 to 29 minutes
- 2530 to 34 minutes
- 335 to 39 minutes
- 740 to 44 minutes
- 845 to 59 minutes
- 760 to 89 minutes
- 190 or more minutes

Means of transportation to work
![Means of transportation to work]()
- 64.1%147Drove a car alone
- 4.8%11Carpooled
- 2.2%5Long-distance train or commuter rail
- 1.7%4Taxi
- 1.7%4Motorcycle
- 10.9%25Walked
- 1.3%3Other means
- 20.9%48Worked at home

Time leaving home to go to work
![Time leaving home to go to work]()
- 412:00 a.m. to 4:59 a.m.
- 15:00 a.m. to 5:29 a.m.
- 95:30 a.m. to 5:59 a.m.
- 86:00 a.m. to 6:29 a.m.
- 216:30 a.m. to 6:59 a.m.
- 377:00 a.m. to 7:29 a.m.
- 187:30 a.m. to 7:59 a.m.
- 138:00 a.m. to 8:29 a.m.
- 98:30 a.m. to 8:59 a.m.
- 39:00 a.m. to 9:59 a.m.
- 310:00 a.m. to 10:59 a.m.
- 311:00 a.m. to 11:59 a.m.
- 2212:00 p.m. to 3:59 p.m.
- 84:00 p.m. to 11:59 p.m.

Occupations of males:
- Percentage of males in management occupations (except farmers):
Here: 19.2% village: 14.2%
- Percentage of males in business and financial operations occupations:
Here: 5.9% village: 6.8%
- Percentage of males in computer and mathematical occupations:
Here: 6.2% village: 8.5%
- Percentage of males in life, physical, and social science occupations:
Here: 1.8% village: 4.2%
- Percentage of males in community and social services occupations:
Here: 7.6% village: 2.0%
- Percentage of males in legal occupations:
Here: 1.0% village: 1.9%
- Percentage of males in education, training, and library occupations:
Here: 2.5% village: 1.6%
- Percentage of males in arts, design, entertainment, sports, and media occupations:
Here: 1.9% village: 2.3%
- Percentage of males in healthcare practitioners and technical occupations:
Here: 2.6% village: 4.3%
- Percentage of males in service occupations:
Here: 25.3% village: 15.0%
- Percentage of males in sales and office occupations:
Here: 9.3% village: 14.3%
- Percentage of males in construction, extraction, and maintenance occupations:
Here: 4.3% village: 4.2%
- Percentage of males in production occupations:
Here: 5.7% village: 4.9%
- Percentage of males in transportation occupations:
Here: 4.2% village: 7.0%
Occupations of females:
- Percentage of females in management occupations (except farmers):
Here: 18.4% village: 10.8%
- Percentage of females in business and financial operations occupations:
Here: 10.4% village: 10.4%
- Percentage of females in community and social services occupations:
Here: 4.3% village: 1.5%
- Percentage of females in education, training, and library occupations:
Here: 13.7% village: 8.5%
- Percentage of females in healthcare practitioners and technical occupations:
Here: 21.6% village: 12.2%
- Percentage of females in service occupations:
Here: 9.2% village: 16.7%
- Percentage of females in sales and office occupations:
Here: 19.8% village: 27.1%
- Percentage of females in production occupations:
Here: 1.8% village: 1.7%
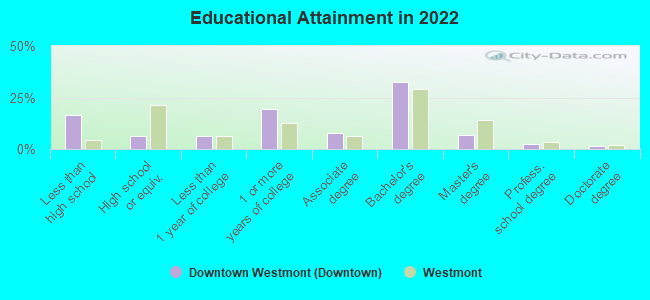
Education in this neighborhood (subdivision or community):
- Percentage of people 3 years and older in K-12 schools:
Downtown Westmont (Downtown): 19.1% Westmont: 14.7%
- Percentage of people 3 years and older in undergraduate colleges:
Downtown Westmont (Downtown): 6.9% Westmont: 3.3%
- Percentage of people 3 years and older in grad. or professional schools:
Downtown Westmont (Downtown): 0.4% Westmont: 1.7%
- Percentage of students K-12 enrolled in private schools:
Downtown Westmont (Downtown): 36.0% Westmont: 12.9%
Percentage of population below poverty level:
| Downtown Westmont (Downtown): | 13.2% |
| Westmont: | 11.2% |
Median year owner moved in (as recorded in 2022):
| Downtown Westmont (Downtown): | 2005 |
| Westmont: | 2007 |
Percentage of married-couple families with both working:
| Downtown Westmont (Downtown): | 42.1% |
| Westmont: | 68.6% |
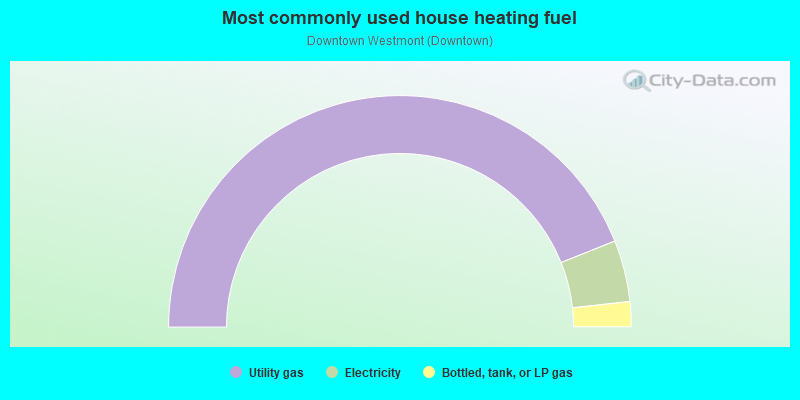
- 87.9%Utility gas
- 8.6%Electricity
- 3.5%Bottled, tank, or LP gas
Roads and streets:
N Cass Ave
Length: 0.47 miles
Direction: N-S
Address range: 1 to 299
Direction: N-S
Address range: 1 to 299
N Linden Ave
Length: 0.22 miles
Direction: N-S
Address range: 200 to 299
Direction: N-S
Address range: 200 to 299
S Cass Ave
Length: 0.14 miles
Direction: N-S
Address range: 1 to 99
Direction: N-S
Address range: 1 to 99
W Burlington Ave
Length: 0.13 miles
Directions: E-W, N-S, SW-NE
Address range: 1 to 20
Directions: E-W, N-S, SW-NE
Address range: 1 to 20
E Naperville Rd
Length: 0.10 miles
Direction: E-W
Direction: E-W
W Naperville Rd
Length: 0.10 miles
Direction: E-W
Address range: 1 to 27
Direction: E-W
Address range: 1 to 27
W Quincy St
Length: 0.10 miles
Direction: E-W
Address range: 1 to 29
Direction: E-W
Address range: 1 to 29
E Norfolk St
Length: 0.10 miles
Direction: E-W
Address range: 1 to 99
Direction: E-W
Address range: 1 to 99
Length: 0.07 miles
Direction: E-W
Direction: E-W
Railroad features:
Burlington Northern Santa Fe RR
Length: 0.20 miles
Direction: E-W
Direction: E-W
Chicago Burlington and Quincy RR
Length: 0.10 miles
Direction: E-W
Direction: E-W