Downtown Fullerton (Downtown) neighborhood in Fullerton, California (CA), 92832 detailed profile
Settings
X


Business Search - 14 Million verified businesses
Area: 0.149 square miles
Population: 1,204
Population density:
| Downtown Fullerton (Downtown): | 8,063 people per square mile |
| Fullerton: | 6,331 people per square mile |

- 45237.5%Hispanic or Latino
- 37030.7%White
- 25321.0%Asian
- 494.1%Black
- 473.9%Two or more races
- 242.0%American Indian
- 90.7%Some other race

Distribution of median household income
![Distribution of median household income]()
- 22Less than $10,000
- 105$10,000 to $19,999
- 70$20,000 to $29,999
- 17$30,000 to $39,999
- 49$40,000 to $49,999
- 3$50,000 to $59,999
- 16$60,000 to $74,999
- 112$75,000 to $99,999
- 54$100,000 to $124,999
- 18$125,000 to $149,999
- 58$150,000 to $199,999
- 67$200,000 or more

Distribution of owner-occupied house/condo value
![Distribution of owner-occupied house/condo value]()
- 7$100,000 to $149,999
- 30$500,000 to $749,999
- 13$750,000 to $999,999
- 88$1,000,000 or more

Distribution of rent paid by renters
![Distribution of rent paid by renters]()
- 11$500 to $599
- 43$600 to $699
- 18$800 to $899
- 87$1,000 to $1,249
- 33$1,250 to $1,499
- 95$1,500 to $1,999
- 220$2,000 or more

Median rent in 2022:
| Downtown Fullerton (Downtown): | $1,873 |
| Fullerton: | $1,914 |
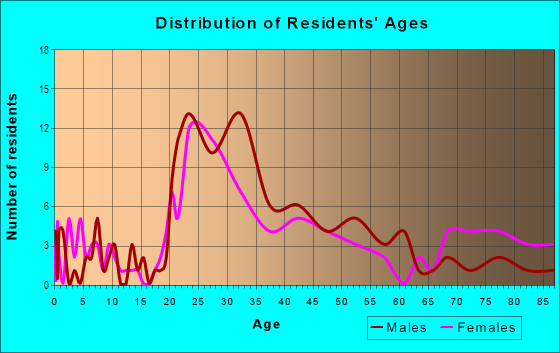
| Males: | 614 |
| Females: | 589 |
Males:
| This neighborhood: | 37.8 years |
| Whole city: | 39.3 years |
| This neighborhood: | 34.1 years |
| Whole city: | 37.1 years |
Average household size:
| Downtown Fullerton (Downtown): | 2.1 people |
| Fullerton: | 2.8 people |
Percentage of family households:
| Downtown Fullerton (Downtown): | 37.5% |
| Fullerton: | 44.9% |
| Here: | 26.7% |
| Fullerton: | 50.7% |
Percentage of married-couple families with children (among all households):
| Downtown Fullerton (Downtown): | 22.5% |
| Fullerton: | 25.6% |
Percentage of single-mother households (among all households):
| Downtown Fullerton (Downtown): | 30.3% |
| Fullerton: | 7.7% |
Percentage of never married males 15 years old and over:
Percentage of never married females 15 years old and over:
| Downtown Fullerton (Downtown): | 20.1% |
| Fullerton: | 18.5% |
Percentage of never married females 15 years old and over:
| Downtown Fullerton (Downtown): | 18.2% |
| city: | 17.7% |
Percentage of people that speak English not well or not at all:
| Downtown Fullerton (Downtown): | 6.5% |
| Fullerton: | 11.2% |
Percentage of people born in this state:
Percentage of people born in another U.S. state:
Percentage of native residents but born outside the U.S.:
Percentage of foreign born residents:
| Here: | 60.6% |
| Fullerton: | 53.1% |
Percentage of people born in another U.S. state:
| Downtown Fullerton (Downtown): | 19.2% |
| Fullerton: | 12.5% |
Percentage of native residents but born outside the U.S.:
| Here: | 1.1% |
| city: | 2.4% |
Percentage of foreign born residents:
| Here: | 19.1% |
| Fullerton: | 32.0% |

Owner-occupied
Renter-occupied


- Rooms in owner-occupied houses and condos in Downtown Fullerton <
> - 61 room
- 02 rooms
- 03 rooms
- 114 rooms
- 185 rooms
- 76 rooms
- 67 rooms
- 368 rooms
- 189+ rooms

- Rooms in renter-occupied apartments in Downtown Fullerton <
> - 1031 room
- 872 rooms
- 833 rooms
- 1124 rooms
- 345 rooms
- 676 rooms
- 197 rooms
- 08 rooms
- 109+ rooms
Owner-occupied
Renter-occupied

- Bedrooms in owner-occupied houses and condos in Downtown Fullerton <
> - 6no bedroom
- 01 bedroom
- 122 bedrooms
- 73 bedrooms
- 284 bedrooms
- 65+ bedrooms

- Bedrooms in renter-occupied apartments in Downtown Fullerton <
> - 103no bedroom
- 1651 bedroom
- 1452 bedrooms
- 463 bedrooms
- 334 bedrooms
- 05+ bedrooms
Average number of cars or other vehicles available in houses/condos:
Average number of cars or other vehicles available in apartments:
| This neighborhood: | 10.7 |
| Fullerton: | 2.3 |
Average number of cars or other vehicles available in apartments:
| Here: | 1.4 |
| city: | 1.8 |
Percentage of units with a mortgage:
| Downtown Fullerton (Downtown): | 68.9% |
| Fullerton: | 69.3% |

- Year house built in Downtown Fullerton <
> - 02020 or later
- 1302010 to 2019
- 2612000 to 2009
- 911990 to 1999
- 461980 to 1989
- 611970 to 1979
- 301960 to 1969
- 411950 to 1959
- 51940 to 1949
- 691939 or earlier

City-data.com crime index for city in 2020 (higher means more crime):
| City: | 216.1 |
| U.S. average: | 219.5 |
Travel time to work (commute)
![Travel time to work (commute)]()
- 9Less than 5 minutes
- 635 to 9 minutes
- 3410 to 14 minutes
- 10015 to 19 minutes
- 12320 to 24 minutes
- 3825 to 29 minutes
- 11430 to 34 minutes
- 835 to 39 minutes
- 7140 to 44 minutes
- 7445 to 59 minutes
- 3960 to 89 minutes
- 2290 or more minutes

Means of transportation to work
![Means of transportation to work]()
- 72.5%507Drove a car alone
- 10.0%70Carpooled
- 10.9%76Bus
- 0.6%4Bicycle
- 3.0%21Walked
- 1.0%7Other means
- 7.0%49Worked at home

Time leaving home to go to work
![Time leaving home to go to work]()
- 1012:00 a.m. to 4:59 a.m.
- 285:00 a.m. to 5:29 a.m.
- 325:30 a.m. to 5:59 a.m.
- 596:00 a.m. to 6:29 a.m.
- 396:30 a.m. to 6:59 a.m.
- 1357:00 a.m. to 7:29 a.m.
- 847:30 a.m. to 7:59 a.m.
- 868:00 a.m. to 8:29 a.m.
- 468:30 a.m. to 8:59 a.m.
- 969:00 a.m. to 9:59 a.m.
- 1110:00 a.m. to 10:59 a.m.
- 4812:00 p.m. to 3:59 p.m.
- 284:00 p.m. to 11:59 p.m.

Occupations of males:
- Percentage of males in management occupations (except farmers):
Here: 15.5% city: 13.7%
- Percentage of males in business and financial operations occupations:
Here: 5.1% city: 6.7%
- Percentage of males in computer and mathematical occupations:
Here: 10.4% city: 5.7%
- Percentage of males in architecture and engineering occupations:
Here: 3.7% city: 3.8%
- Percentage of males in life, physical, and social science occupations:
Here: 6.1% city: 0.6%
- Percentage of males in community and social services occupations:
Here: 1.4% city: 1.7%
- Percentage of males in education, training, and library occupations:
Here: 1.7% city: 4.7%
- Percentage of males in arts, design, entertainment, sports, and media occupations:
Here: 2.0% city: 2.8%
- Percentage of males in service occupations:
Here: 10.3% city: 13.8%
- Percentage of males in sales and office occupations:
Here: 14.2% city: 15.7%
- Percentage of males in construction, extraction, and maintenance occupations:
Here: 16.5% city: 8.7%
- Percentage of males in production occupations:
Here: 10.1% city: 7.6%
- Percentage of males in material moving occupations:
Here: 1.4% city: 2.5%
Occupations of females:
- Percentage of females in management occupations (except farmers):
Here: 10.6% city: 8.5%
- Percentage of females in business and financial operations occupations:
Here: 13.1% city: 8.9%
- Percentage of females in community and social services occupations:
Here: 1.3% city: 2.7%
- Percentage of females in education, training, and library occupations:
Here: 1.9% city: 11.3%
- Percentage of females in arts, design, entertainment, sports, and media occupations:
Here: 3.6% city: 2.7%
- Percentage of females in healthcare practitioners and technical occupations:
Here: 19.0% city: 8.9%
- Percentage of females in service occupations:
Here: 16.2% city: 17.8%
- Percentage of females in sales and office occupations:
Here: 19.1% city: 27.5%
- Percentage of females in production occupations:
Here: 2.3% city: 4.4%
- Percentage of females in transportation occupations:
Here: 6.7% city: 0.6%
- Percentage of females in material moving occupations:
Here: 4.1% city: 2.0%
Education in this neighborhood (subdivision or community):
- Percentage of people 3 years and older in K-12 schools:
Downtown Fullerton (Downtown): 21.2% Fullerton: 15.1%
- Percentage of people 3 years and older in undergraduate colleges:
Downtown Fullerton (Downtown): 4.9% Fullerton: 8.1%
- Percentage of people 3 years and older in grad. or professional schools:
Downtown Fullerton (Downtown): 5.8% Fullerton: 3.0%
- Percentage of students K-12 enrolled in private schools:
Downtown Fullerton (Downtown): 6.5% Fullerton: 10.7%
Percentage of population below poverty level:
| Downtown Fullerton (Downtown): | 9.0% |
| Fullerton: | 10.8% |
Median year renter moved in (as recorded in 2022):
| Downtown Fullerton (Downtown): | 2017 |
| Fullerton: | 2019 |
Percentage of married-couple families with both working:
| Downtown Fullerton (Downtown): | 112.7% |
| Fullerton: | 56.2% |

- 54.9%Utility gas
- 40.9%Electricity
- 2.8%Bottled, tank, or LP gas
- 1.5%No fuel used
Roads and streets:
N Harbor Blvd
Length: 0.32 miles
Direction: N-S
Address range: 100 to 549
Direction: N-S
Address range: 100 to 549
E Santa Fe Ave
Length: 0.30 miles
Direction: E-W
Address range: 100 to 299
Direction: E-W
Address range: 100 to 299
E Whiting Ave
Length: 0.30 miles
Direction: E-W
Address range: 100 to 299
Direction: E-W
Address range: 100 to 299
E Commonwealth Ave
Length: 0.30 miles
Direction: E-W
Address range: 100 to 299
Direction: E-W
Address range: 100 to 299
E Amerige Ave
Length: 0.30 miles
Direction: E-W
Address range: 100 to 299
Direction: E-W
Address range: 100 to 299
E Wilshire Ave
Length: 0.30 miles
Direction: E-W
Address range: 100 to 299
Direction: E-W
Address range: 100 to 299
N Pomona Ave
Length: 0.25 miles
Direction: N-S
Address range: 100 to 499
Direction: N-S
Address range: 100 to 499
N Lemon St
Length: 0.21 miles
Direction: N-S
Address range: 100 to 399
Direction: N-S
Address range: 100 to 399
E Chapman Ave
Length: 0.15 miles
Direction: E-W
Address range: 100 to 199
Direction: E-W
Address range: 100 to 199
S Lemon St
Length: 0.12 miles
Direction: N-S
Address range: 100 to 249
Direction: N-S
Address range: 100 to 249
S Pomona Ave
Length: 0.07 miles
Direction: N-S
Address range: 100 to 199
Direction: N-S
Address range: 100 to 199
S Harbor Blvd
Length: 0.06 miles
Direction: N-S
Address range: 100 to 199
Direction: N-S
Address range: 100 to 199
W Whiting Ave
Length: 0.01 miles
Direction: E-W
Address range: 100 to 105
Direction: E-W
Address range: 100 to 105