Culver Junction neighborhood in Culver City, California (CA), 90034, 90232 detailed profile
Settings
X


Business Search - 14 Million verified businesses
Area: 0.220 square miles
Population: 985
Population density:
| Culver Junction: | 4,476 people per square mile |
| Culver City: | 7,891 people per square mile |

- 44236.9%White
- 29724.8%Hispanic or Latino
- 21918.3%Black
- 12610.5%Asian
- 504.2%Some other race
- 494.1%Two or more races
- 151.3%American Indian

Distribution of median household income
![Distribution of median household income]()
- 18Less than $10,000
- 28$10,000 to $19,999
- 56$20,000 to $29,999
- 29$30,000 to $39,999
- 30$40,000 to $49,999
- 58$50,000 to $59,999
- 12$60,000 to $74,999
- 59$75,000 to $99,999
- 30$100,000 to $124,999
- 41$125,000 to $149,999
- 53$150,000 to $199,999
- 73$200,000 or more

Distribution of owner-occupied house/condo value
![Distribution of owner-occupied house/condo value]()
- 16$200,000 to $249,999
- 16$400,000 to $499,999
- 27$500,000 to $749,999
- 34$750,000 to $999,999
- 92$1,000,000 or more

Distribution of rent paid by renters
![Distribution of rent paid by renters]()
- 34$200 to $299
- 40$300 to $399
- 14$400 to $499
- 22$500 to $599
- 56$700 to $799
- 6$800 to $899
- 23$900 to $999
- 17$1,000 to $1,249
- 54$1,250 to $1,499
- 94$1,500 to $1,999
- 198$2,000 or more

Median rent in 2022:
| Culver Junction: | $2,210 |
| Culver City: | $2,001 |
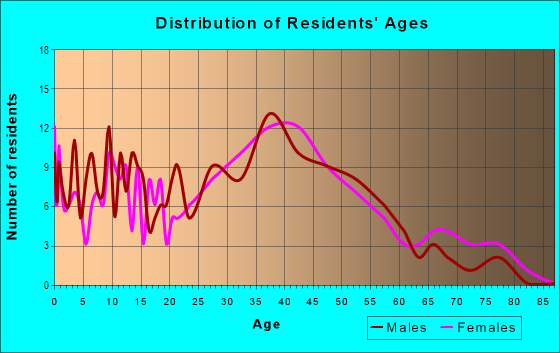
| Males: | 504 |
| Females: | 480 |
Males:
| This neighborhood: | 39.6 years |
| Whole city: | 39.3 years |
| This neighborhood: | 39.4 years |
| Whole city: | 43.5 years |
Average household size:
| Culver Junction: | 2.2 people |
| Culver City: | 2.3 people |
Percentage of family households:
| Culver Junction: | 38.0% |
| Culver City: | 40.6% |
| Here: | 39.4% |
| Culver City: | 44.2% |
Percentage of married-couple families with children (among all households):
| Culver Junction: | 33.9% |
| Culver City: | 38.6% |
Percentage of single-mother households (among all households):
| Culver Junction: | 3.3% |
| Culver City: | 3.8% |
Percentage of never married males 15 years old and over:
Percentage of never married females 15 years old and over:
| Culver Junction: | 23.2% |
| Culver City: | 16.4% |
Percentage of never married females 15 years old and over:
| Culver Junction: | 17.9% |
| city: | 16.4% |
Percentage of people that speak English not well or not at all:
| Culver Junction: | 5.4% |
| Culver City: | 2.1% |
Percentage of people born in this state:
Percentage of people born in another U.S. state:
Percentage of native residents but born outside the U.S.:
Percentage of foreign born residents:
| Here: | 45.1% |
| Culver City: | 45.6% |
Percentage of people born in another U.S. state:
| Culver Junction: | 25.8% |
| Culver City: | 28.1% |
Percentage of native residents but born outside the U.S.:
| Here: | 2.0% |
| city: | 2.1% |
Percentage of foreign born residents:
| Here: | 27.1% |
| Culver City: | 24.1% |

Owner-occupied
Renter-occupied


- Rooms in owner-occupied houses and condos in Culver Junction
- 61 room
- 02 rooms
- 313 rooms
- 214 rooms
- 285 rooms
- 116 rooms
- 427 rooms
- 418 rooms
- 79+ rooms

- Rooms in renter-occupied apartments in Culver Junction
- 321 room
- 252 rooms
- 703 rooms
- 924 rooms
- 795 rooms
- 596 rooms
- 117 rooms
- 358 rooms
- 09+ rooms
Owner-occupied
Renter-occupied

- Bedrooms in owner-occupied houses and condos in Culver Junction
- 6no bedroom
- 311 bedroom
- 292 bedrooms
- 553 bedrooms
- 474 bedrooms
- 75+ bedrooms

- Bedrooms in renter-occupied apartments in Culver Junction
- 32no bedroom
- 541 bedroom
- 1582 bedrooms
- 573 bedrooms
- 234 bedrooms
- 05+ bedrooms
Average number of cars or other vehicles available in houses/condos:
Average number of cars or other vehicles available in apartments:
| This neighborhood: | 1.9 |
| Culver City: | 1.8 |
Average number of cars or other vehicles available in apartments:
| Here: | 1.4 |
| city: | 1.4 |
Percentage of units with a mortgage:
| Culver Junction: | 59.5% |
| Culver City: | 68.9% |
Average estimated value of detached houses in 2022 (30.4% of all units):
| Culver Junction: | $1,571,088 |
| Culver City: | $1,549,266 |

- Year house built in Culver Junction
- 472020 or later
- 822010 to 2019
- 102000 to 2009
- 361990 to 1999
- 161980 to 1989
- 521970 to 1979
- 881960 to 1969
- 741950 to 1959
- 551940 to 1949
- 821939 or earlier

City-data.com crime index for city in 2020 (higher means more crime):
| City: | 330.5 |
| U.S. average: | 219.5 |
Travel time to work (commute)
![Travel time to work (commute)]()
- 9Less than 5 minutes
- 215 to 9 minutes
- 4110 to 14 minutes
- 7715 to 19 minutes
- 8020 to 24 minutes
- 2025 to 29 minutes
- 14930 to 34 minutes
- 835 to 39 minutes
- 2240 to 44 minutes
- 2745 to 59 minutes
- 2660 to 89 minutes
- 490 or more minutes

Means of transportation to work
![Means of transportation to work]()
- 47.0%254Drove a car alone
- 5.2%28Carpooled
- 5.4%29Bus
- 3.7%20Subway or elevated rail
- 2.2%12Long-distance train or commuter rail
- 2.0%11Light rail, streetcar or trolley
- 2.8%15Taxi
- 1.5%8Bicycle
- 2.8%15Walked
- 3.9%21Other means
- 34.6%187Worked at home

Time leaving home to go to work
![Time leaving home to go to work]()
- 1012:00 a.m. to 4:59 a.m.
- 715:00 a.m. to 5:29 a.m.
- 75:30 a.m. to 5:59 a.m.
- 216:00 a.m. to 6:29 a.m.
- 236:30 a.m. to 6:59 a.m.
- 477:00 a.m. to 7:29 a.m.
- 497:30 a.m. to 7:59 a.m.
- 1048:00 a.m. to 8:29 a.m.
- 468:30 a.m. to 8:59 a.m.
- 1599:00 a.m. to 9:59 a.m.
- 410:00 a.m. to 10:59 a.m.
- 111:00 a.m. to 11:59 a.m.
- 1812:00 p.m. to 3:59 p.m.
- 184:00 p.m. to 11:59 p.m.

Occupations of males:
- Percentage of males in management occupations (except farmers):
Here: 19.2% city: 16.7%
- Percentage of males in business and financial operations occupations:
Here: 19.7% city: 8.4%
- Percentage of males in architecture and engineering occupations:
Here: 2.1% city: 9.3%
- Percentage of males in life, physical, and social science occupations:
Here: 2.7% city: 2.0%
- Percentage of males in legal occupations:
Here: 2.2% city: 3.3%
- Percentage of males in education, training, and library occupations:
Here: 1.3% city: 5.6%
- Percentage of males in arts, design, entertainment, sports, and media occupations:
Here: 9.3% city: 8.7%
- Percentage of males in healthcare practitioners and technical occupations:
Here: 1.7% city: 3.9%
- Percentage of males in service occupations:
Here: 7.5% city: 7.6%
- Percentage of males in sales and office occupations:
Here: 18.8% city: 15.6%
- Percentage of males in construction, extraction, and maintenance occupations:
Here: 11.8% city: 4.0%
- Percentage of males in production occupations:
Here: 2.6% city: 2.6%
- Percentage of males in material moving occupations:
Here: 1.6% city: 1.3%
Occupations of females:
- Percentage of females in management occupations (except farmers):
Here: 12.5% city: 11.8%
- Percentage of females in business and financial operations occupations:
Here: 9.7% city: 12.4%
- Percentage of females in computer and mathematical occupations:
Here: 2.4% city: 5.9%
- Percentage of females in community and social services occupations:
Here: 2.8% city: 2.3%
- Percentage of females in education, training, and library occupations:
Here: 8.5% city: 8.7%
- Percentage of females in arts, design, entertainment, sports, and media occupations:
Here: 16.0% city: 11.1%
- Percentage of females in healthcare practitioners and technical occupations:
Here: 2.6% city: 8.6%
- Percentage of females in service occupations:
Here: 16.2% city: 12.0%
- Percentage of females in sales and office occupations:
Here: 26.5% city: 16.7%
- Percentage of females in production occupations:
Here: 4.2% city: 1.9%
Education in this neighborhood (subdivision or community):
- Percentage of people 3 years and older in K-12 schools:
Culver Junction: 19.3% Culver City: 13.2%
- Percentage of people 3 years and older in undergraduate colleges:
Culver Junction: 12.7% Culver City: 4.0%
- Percentage of people 3 years and older in grad. or professional schools:
Culver Junction: 3.0% Culver City: 2.1%
- Percentage of students K-12 enrolled in private schools:
Culver Junction: 14.9% Culver City: 15.6%
Percentage of population below poverty level:
| Culver Junction: | 8.8% |
| Culver City: | 5.9% |
Median year owner moved in (as recorded in 2022):
Median year renter moved in (as recorded in 2022):
| Culver Junction: | 1999 |
| Culver City: | 2004 |
Median year renter moved in (as recorded in 2022):
| Culver Junction: | 2015 |
| Culver City: | 2015 |
Percentage of married-couple families with both working:
| Culver Junction: | 102.3% |
| Culver City: | 74.1% |

- 67.7%Utility gas
- 23.6%Electricity
- 3.9%Solar energy
- 2.5%No fuel used
- 2.2%Bottled, tank, or LP gas
Highways in this neighborhood:
State Rte 187 (Venice Blvd)
Length: 1.03 miles
Directions: E-W, SW-NE
Address range: 8800 to 8998
Directions: E-W, SW-NE
Address range: 8800 to 8998
Roads and streets:
Helms Ave
Length: 0.60 miles
Directions: N-S, SE-NW
Address range: 3200 to 3699
Directions: N-S, SE-NW
Address range: 3200 to 3699
W Washington Blvd (Washington Blvd)
Length: 0.56 miles
Direction: SW-NE
Address range: 8700 to 9028
Direction: SW-NE
Address range: 8700 to 9028
Higuera St
Length: 0.54 miles
Directions: E-W, N-S, SE-NW
Address range: 3900 to 8899
Directions: E-W, N-S, SE-NW
Address range: 3900 to 8899
Wesley St
Length: 0.46 miles
Directions: N-S, SE-NW
Address range: 3400 to 3699
Directions: N-S, SE-NW
Address range: 3400 to 3699
National Blvd
Length: 0.40 miles
Directions: E-W, SE-NW
Address range: 8600 to 8899
Directions: E-W, SE-NW
Address range: 8600 to 8899
Landmark St
Length: 0.26 miles
Directions: E-W, N-S, SE-NW
Address range: 3900 to 3999
Directions: E-W, N-S, SE-NW
Address range: 3900 to 3999
Carson St (E Carson St)
Length: 0.24 miles
Directions: N-S, SW-NE
Address range: 8800 to 8999
Directions: N-S, SW-NE
Address range: 8800 to 8999
Exposition Blvd
Length: 0.20 miles
Directions: E-W, SE-NW
Address range: 8800 to 8899
Directions: E-W, SE-NW
Address range: 8800 to 8899
Lindblade St
Length: 0.18 miles
Directions: N-S, SW-NE
Address range: 8900 to 8999
Directions: N-S, SW-NE
Address range: 8900 to 8999
Hubbard St
Length: 0.16 miles
Direction: SW-NE
Address range: 8800 to 8999
Direction: SW-NE
Address range: 8800 to 8999
Hoke Ave
Length: 0.15 miles
Directions: SE-NW, SW-NE
Address range: 3800 to 3899
Directions: SE-NW, SW-NE
Address range: 3800 to 3899
Krueger St
Length: 0.13 miles
Direction: SW-NE
Address range: 8900 to 8999
Direction: SW-NE
Address range: 8900 to 8999
Robertson Blvd
Length: 0.12 miles
Direction: N-S
Address range: 3700 to 3799
Direction: N-S
Address range: 3700 to 3799
Willat Ave
Length: 0.07 miles
Directions: E-W, N-S, SW-NE
Address range: 3800 to 3899
Directions: E-W, N-S, SW-NE
Address range: 3800 to 3899
S Robertson Blvd
Length: 0.04 miles
Directions: N-S, SE-NW
Address range: 3700 to 3799
Directions: N-S, SE-NW
Address range: 3700 to 3799
Railroad features:
Southern Pacific RR
Length: 0.56 miles
Directions: E-W, N-S, SE-NW
Directions: E-W, N-S, SE-NW