Cross Creek 4 neighborhood in Plano, Texas (TX), 75013, 75025 detailed profile
Settings
X


Business Search - 14 Million verified businesses
Area: 0.073 square miles
Population: 466
Population density:
| Cross Creek 4: | 6,357 people per square mile |
| Plano: | 4,054 people per square mile |

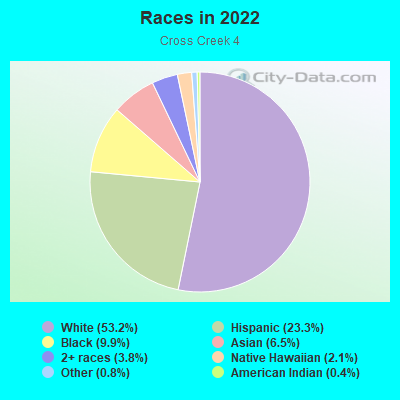
- 27953.2%White
- 12223.3%Hispanic or Latino
- 529.9%Black
- 346.5%Asian
- 203.8%Two or more races
- 112.1%Native Hawaiian and Other
Pacific Islander - 40.8%Some other race
- 20.4%American Indian
Median household income in 2022:
| Cross Creek 4: | $91,047 |
| Plano: | $103,916 |
Distribution of median household income
![Distribution of median household income]()
- 16Less than $10,000
- 9$10,000 to $19,999
- 20$20,000 to $29,999
- 25$30,000 to $39,999
- 9$40,000 to $49,999
- 11$50,000 to $59,999
- 42$60,000 to $74,999
- 15$75,000 to $99,999
- 31$100,000 to $124,999
- 17$125,000 to $149,999
- 48$150,000 to $199,999
- 5$200,000 or more

Distribution of owner-occupied house/condo value
![Distribution of owner-occupied house/condo value]()
- 1$100,000 to $149,999
- 17$150,000 to $199,999
- 18$200,000 to $249,999
- 46$250,000 to $299,999
- 75$300,000 to $399,999
- 13$400,000 to $499,999
- 5$500,000 to $749,999
- 3$1,000,000 or more

Distribution of rent paid by renters
![Distribution of rent paid by renters]()
- 10$100 to $199
- 7$200 to $299
- 1$300 to $399
- 5$900 to $999
- 73$1,000 to $1,249
- 36$1,250 to $1,499
- 34$1,500 to $1,999
- 1$2,000 or more

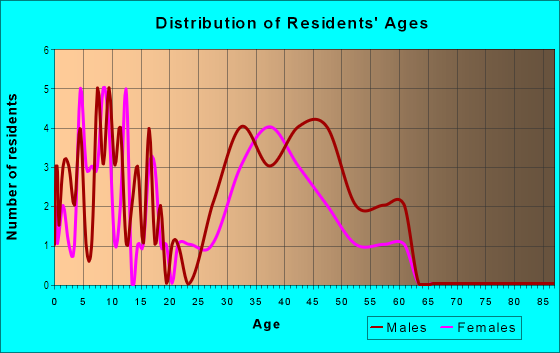
| Males: | 237 |
| Females: | 228 |
Males:
| This neighborhood: | 31.8 years |
| Whole city: | 37.6 years |
| This neighborhood: | 34.5 years |
| Whole city: | 40.3 years |
Average household size:
| Cross Creek 4: | 24.3 people |
| Plano: | 2.6 people |
Percentage of family households:
| Cross Creek 4: | 64.3% |
| Plano: | 51.7% |
| Here: | 60.1% |
| Plano: | 55.6% |
Percentage of married-couple families with children (among all households):
| Cross Creek 4: | 33.9% |
| Plano: | 31.0% |
Percentage of single-mother households (among all households):
| Cross Creek 4: | 5.0% |
| Plano: | 5.3% |
Percentage of never married males 15 years old and over:
Percentage of never married females 15 years old and over:
| Cross Creek 4: | 13.2% |
| Plano: | 16.2% |
Percentage of never married females 15 years old and over:
| Cross Creek 4: | 14.9% |
| city: | 13.0% |
Percentage of people that speak English not well or not at all:
| Cross Creek 4: | 8.7% |
| Plano: | 4.3% |
Percentage of people born in this state:
Percentage of people born in another U.S. state:
Percentage of native residents but born outside the U.S.:
Percentage of foreign born residents:
| Here: | 40.4% |
| Plano: | 40.4% |
Percentage of people born in another U.S. state:
| Cross Creek 4: | 37.2% |
| Plano: | 31.4% |
Percentage of native residents but born outside the U.S.:
| Here: | 1.5% |
| city: | 1.6% |
Percentage of foreign born residents:
| Here: | 20.9% |
| Plano: | 26.6% |
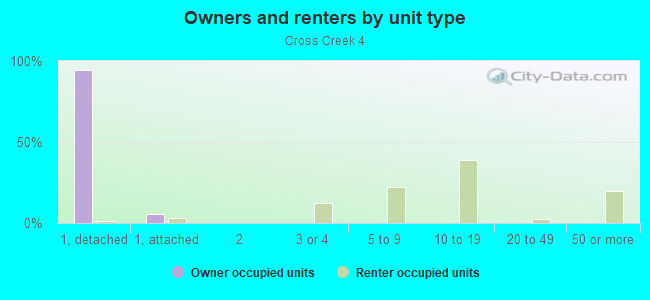
Owner-occupied
Renter-occupied

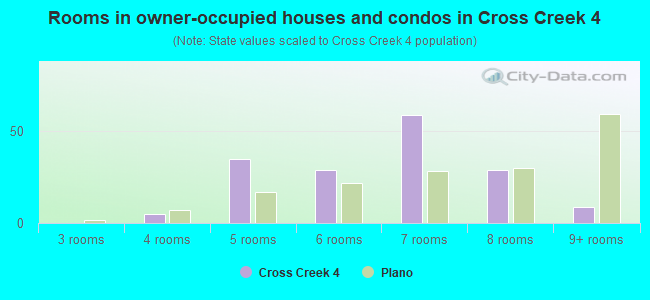
- Rooms in owner-occupied houses and condos in Cross Creek 4
- 01 room
- 02 rooms
- 03 rooms
- 54 rooms
- 355 rooms
- 296 rooms
- 597 rooms
- 298 rooms
- 99+ rooms
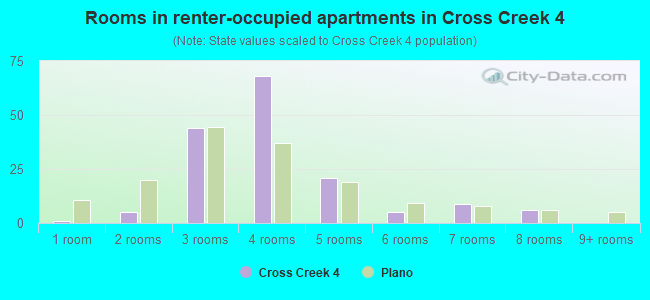
- Rooms in renter-occupied apartments in Cross Creek 4
- 11 room
- 52 rooms
- 443 rooms
- 684 rooms
- 215 rooms
- 56 rooms
- 97 rooms
- 68 rooms
- 09+ rooms
Owner-occupied
Renter-occupied
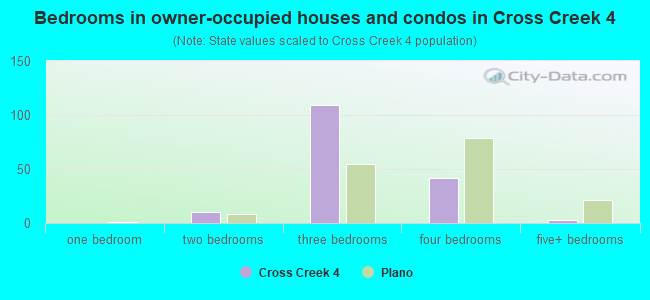
- Bedrooms in owner-occupied houses and condos in Cross Creek 4
- 0no bedroom
- 01 bedroom
- 102 bedrooms
- 1093 bedrooms
- 424 bedrooms
- 35+ bedrooms
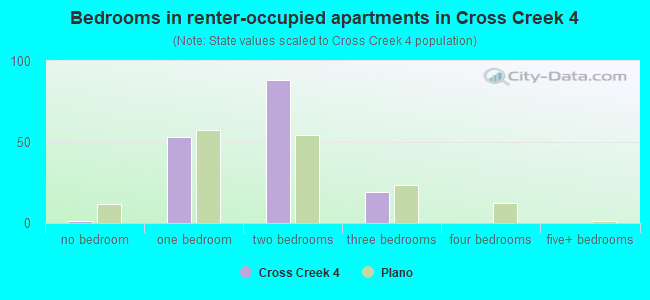
- Bedrooms in renter-occupied apartments in Cross Creek 4
- 1no bedroom
- 531 bedroom
- 882 bedrooms
- 193 bedrooms
- 04 bedrooms
- 05+ bedrooms
Average number of cars or other vehicles available in houses/condos:
Average number of cars or other vehicles available in apartments:
| This neighborhood: | 2.2 |
| Plano: | 2.0 |
Average number of cars or other vehicles available in apartments:
| Here: | |
| city: |
Percentage of units with a mortgage:
| Cross Creek 4: | 76.4% |
| Plano: | 60.1% |
Average estimated value of detached houses in 2022 (90.7% of all units):
| Cross Creek 4: | $305,126 |
| Plano: | $468,209 |
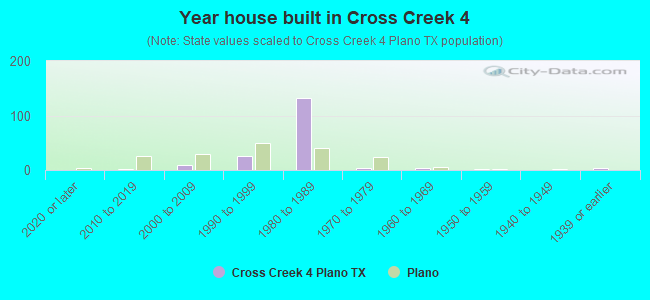
- Year house built in Cross Creek 4
- 02020 or later
- 22010 to 2019
- 92000 to 2009
- 261990 to 1999
- 1331980 to 1989
- 31970 to 1979
- 41960 to 1969
- 11950 to 1959
- 01940 to 1949
- 31939 or earlier
City-data.com crime index for city in 2020 (higher means more crime):
| City: | 135.9 |
| U.S. average: | 219.5 |
Travel time to work (commute)
![Travel time to work (commute)]()
- 195 to 9 minutes
- 2710 to 14 minutes
- 3715 to 19 minutes
- 4420 to 24 minutes
- 1625 to 29 minutes
- 2530 to 34 minutes
- 335 to 39 minutes
- 840 to 44 minutes
- 1345 to 59 minutes
- 1260 to 89 minutes
- 390 or more minutes

Means of transportation to work
![Means of transportation to work]()
- 77.3%201Drove a car alone
- 22.7%59Carpooled
- 8.5%22Walked
- 19.6%51Worked at home

Time leaving home to go to work
![Time leaving home to go to work]()
- 812:00 a.m. to 4:59 a.m.
- 65:30 a.m. to 5:59 a.m.
- 186:00 a.m. to 6:29 a.m.
- 106:30 a.m. to 6:59 a.m.
- 357:00 a.m. to 7:29 a.m.
- 317:30 a.m. to 7:59 a.m.
- 348:00 a.m. to 8:29 a.m.
- 278:30 a.m. to 8:59 a.m.
- 59:00 a.m. to 9:59 a.m.
- 710:00 a.m. to 10:59 a.m.
- 911:00 a.m. to 11:59 a.m.
- 1212:00 p.m. to 3:59 p.m.
- 64:00 p.m. to 11:59 p.m.

Occupations of males:
- Percentage of males in management occupations (except farmers):
Here: 15.7% city: 18.2%
- Percentage of males in business and financial operations occupations:
Here: 1.7% city: 8.9%
- Percentage of males in computer and mathematical occupations:
Here: 23.9% city: 15.9%
- Percentage of males in life, physical, and social science occupations:
Here: 4.0% city: 0.8%
- Percentage of males in legal occupations:
Here: 1.9% city: 1.1%
- Percentage of males in education, training, and library occupations:
Here: 2.9% city: 2.8%
- Percentage of males in service occupations:
Here: 11.3% city: 9.9%
- Percentage of males in sales and office occupations:
Here: 15.7% city: 17.0%
- Percentage of males in production occupations:
Here: 7.8% city: 3.0%
- Percentage of males in transportation occupations:
Here: 10.8% city: 2.4%
- Percentage of males in material moving occupations:
Here: 1.2% city: 2.2%
Occupations of females:
- Percentage of females in management occupations (except farmers):
Here: 13.1% city: 12.6%
- Percentage of females in business and financial operations occupations:
Here: 5.9% city: 11.2%
- Percentage of females in community and social services occupations:
Here: 1.0% city: 1.8%
- Percentage of females in education, training, and library occupations:
Here: 5.2% city: 9.5%
- Percentage of females in arts, design, entertainment, sports, and media occupations:
Here: 2.9% city: 2.4%
- Percentage of females in healthcare practitioners and technical occupations:
Here: 11.6% city: 9.7%
- Percentage of females in service occupations:
Here: 28.6% city: 14.0%
- Percentage of females in sales and office occupations:
Here: 28.1% city: 25.7%
- Percentage of females in transportation occupations:
Here: 3.0% city: 0.6%
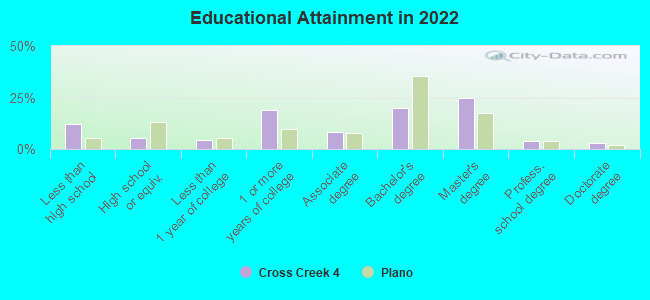
Education in this neighborhood (subdivision or community):
- Percentage of people 3 years and older in K-12 schools:
Cross Creek 4: 19.6% Plano: 16.8%
- Percentage of people 3 years and older in undergraduate colleges:
Cross Creek 4: 3.1% Plano: 4.2%
- Percentage of people 3 years and older in grad. or professional schools:
Cross Creek 4: 0.7% Plano: 1.7%
- Percentage of students K-12 enrolled in private schools:
Cross Creek 4: 18.0% Plano: 11.2%
Percentage of population below poverty level:
| Cross Creek 4: | 11.8% |
| Plano: | 4.9% |
Median year owner moved in (as recorded in 2022):
| Cross Creek 4: | 2015 |
| Plano: | 2010 |
Percentage of married-couple families with both working:
| Cross Creek 4: | 84.3% |
| Plano: | 69.7% |
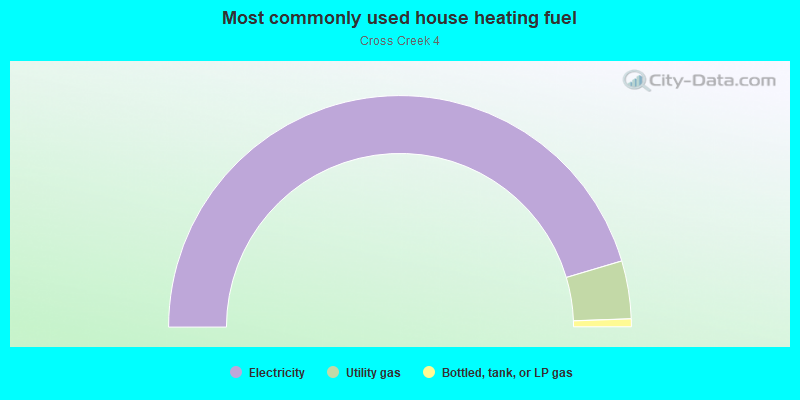
- 90.7%Electricity
- 8.1%Utility gas
- 1.1%Bottled, tank, or LP gas
Roads and streets:
Jabbet Dr
Length: 0.22 miles
Directions: E-W, SE-NW
Address range: 1300 to 1399
Directions: E-W, SE-NW
Address range: 1300 to 1399
Jerome Dr
Length: 0.20 miles
Directions: N-S, SW-NE
Address range: 7500 to 7610
Directions: N-S, SW-NE
Address range: 7500 to 7610
Finley Dr
Length: 0.13 miles
Direction: E-W
Direction: E-W
Sloan Cir
Length: 0.09 miles
Directions: N-S, SW-NE
Address range: 7900 to 7931
Directions: N-S, SW-NE
Address range: 7900 to 7931
Simpkins Pl
Length: 0.08 miles
Directions: E-W, N-S
Address range: 7900 to 7926
Directions: E-W, N-S
Address range: 7900 to 7926