Cromwell Farms neighborhood in Norfolk, Virginia (VA), 23505, 23509 detailed profile
Settings
X

Business Search - 14 Million verified businesses
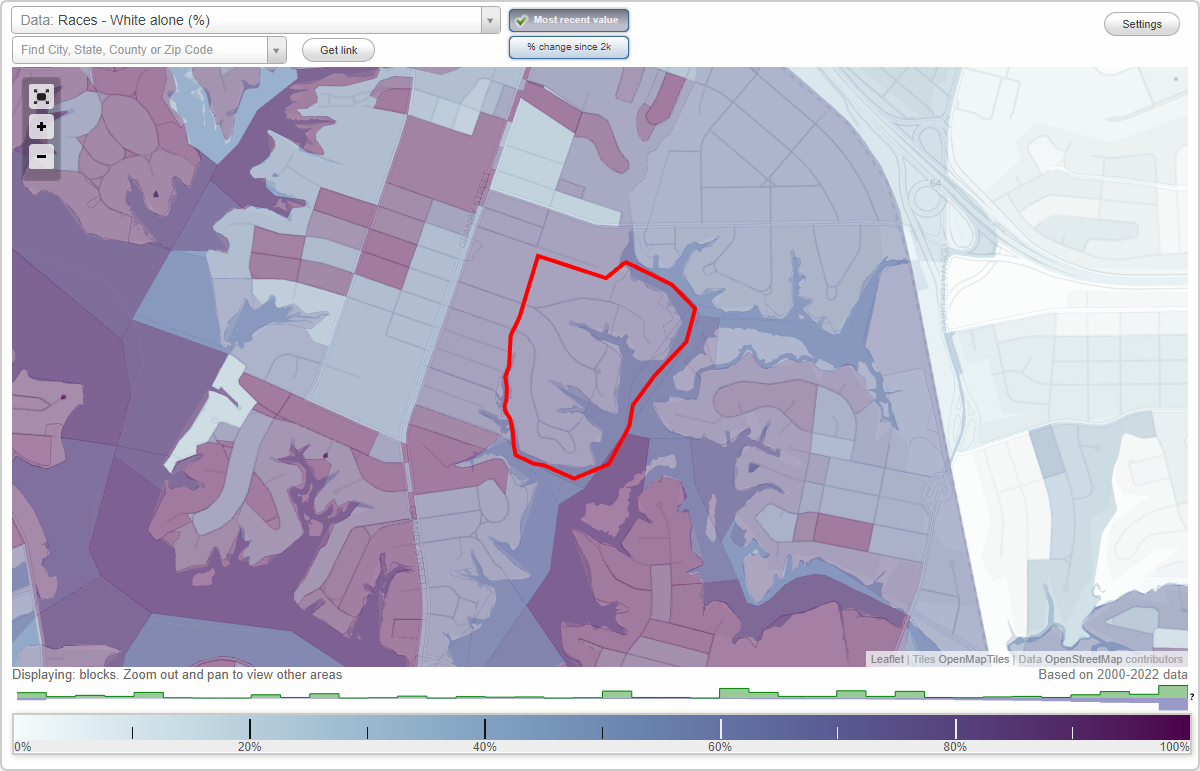
Area: 0.159 square miles
Population: 330
Population density:
| Cromwell Farms: | 2,081 people per square mile |
| Norfolk: | 4,337 people per square mile |

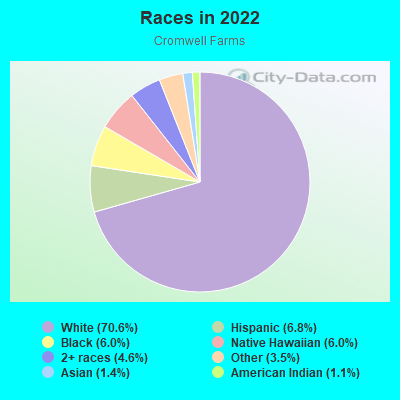
- 25970.6%White
- 256.8%Hispanic or Latino
- 226.0%Black
- 226.0%Native Hawaiian and Other
Pacific Islander - 174.6%Two or more races
- 133.5%Some other race
- 51.4%Asian
- 41.1%American Indian
Median household income in 2022:
| Cromwell Farms: | $116,174 |
| Norfolk: | $61,090 |
Distribution of median household income
![Distribution of median household income]()
- 7Less than $10,000
- 19$10,000 to $19,999
- 15$20,000 to $29,999
- 7$30,000 to $39,999
- 3$40,000 to $49,999
- 4$50,000 to $59,999
- 12$60,000 to $74,999
- 3$75,000 to $99,999
- 29$100,000 to $124,999
- 9$125,000 to $149,999
- 13$150,000 to $199,999
- 44$200,000 or more

Distribution of owner-occupied house/condo value
![Distribution of owner-occupied house/condo value]()
- 5Less than $50,000
- 23$50,000 to $99,999
- 3$100,000 to $149,999
- 7$150,000 to $199,999
- 11$200,000 to $249,999
- 6$250,000 to $299,999
- 6$300,000 to $399,999
- 8$400,000 to $499,999
- 43$500,000 to $749,999
- 12$750,000 to $999,999
- 20$1,000,000 or more

Distribution of rent paid by renters
![Distribution of rent paid by renters]()
- 4$100 to $199
- 29$200 to $299
- 9$300 to $399
- 6$400 to $499
- 7$500 to $599
- 6$700 to $799
- 5$800 to $899
- 11$900 to $999
- 3$1,000 to $1,249
- 11$1,250 to $1,499
- 3$1,500 to $1,999
- 2$2,000 or more

Median rent in 2022:
| Cromwell Farms: | $256 |
| Norfolk: | $1,035 |
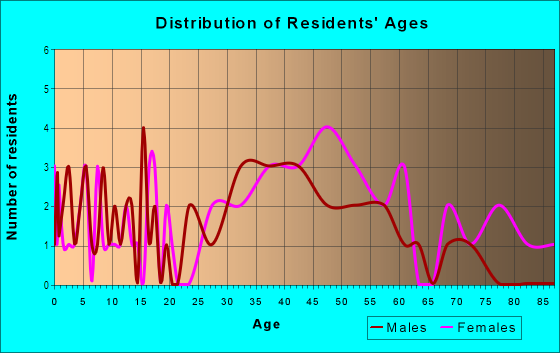
| Males: | 159 |
| Females: | 171 |
Males:
| This neighborhood: | 44.7 years |
| Whole city: | 31.3 years |
| This neighborhood: | 50.2 years |
| Whole city: | 34.4 years |
Average household size:
| Cromwell Farms: | 15.9 people |
| Norfolk: | 2.3 people |
Percentage of family households:
| Cromwell Farms: | 37.8% |
| Norfolk: | 41.3% |
| Here: | 52.1% |
| Norfolk: | 31.7% |
Percentage of married-couple families with children (among all households):
| Cromwell Farms: | 47.4% |
| Norfolk: | 20.2% |
Percentage of single-mother households (among all households):
| Cromwell Farms: | 1.2% |
| Norfolk: | 16.3% |
Percentage of never married males 15 years old and over:
Percentage of never married females 15 years old and over:
| Cromwell Farms: | 13.6% |
| Norfolk: | 25.4% |
Percentage of never married females 15 years old and over:
| Cromwell Farms: | 6.5% |
| city: | 20.5% |
Percentage of people that speak English not well or not at all:
| Cromwell Farms: | 0.0% |
| Norfolk: | 1.4% |
Percentage of people born in this state:
Percentage of people born in another U.S. state:
Percentage of native residents but born outside the U.S.:
Percentage of foreign born residents:
| Here: | 49.6% |
| Norfolk: | 51.1% |
Percentage of people born in another U.S. state:
| Cromwell Farms: | 43.0% |
| Norfolk: | 40.8% |
Percentage of native residents but born outside the U.S.:
| Here: | 2.0% |
| city: | 1.6% |
Percentage of foreign born residents:
| Here: | 6.5% |
| Norfolk: | 6.5% |
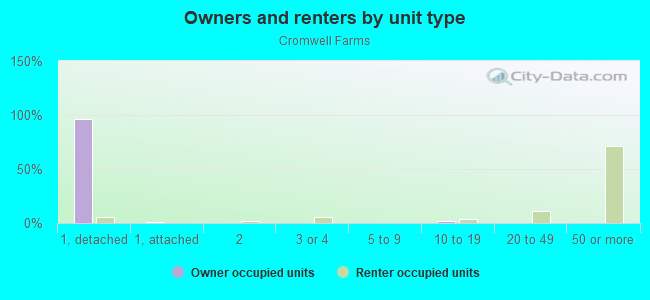
Owner-occupied
Renter-occupied

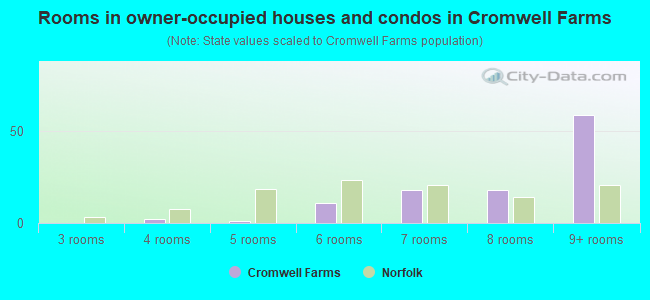
- Rooms in owner-occupied houses and condos in Cromwell Farms
- 01 room
- 02 rooms
- 03 rooms
- 24 rooms
- 15 rooms
- 116 rooms
- 187 rooms
- 188 rooms
- 599+ rooms
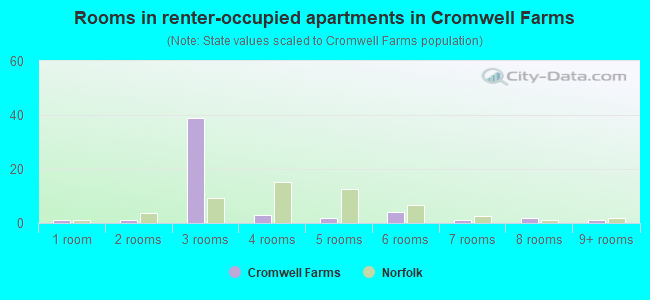
- Rooms in renter-occupied apartments in Cromwell Farms
- 11 room
- 12 rooms
- 393 rooms
- 34 rooms
- 25 rooms
- 46 rooms
- 17 rooms
- 28 rooms
- 19+ rooms
Owner-occupied
Renter-occupied
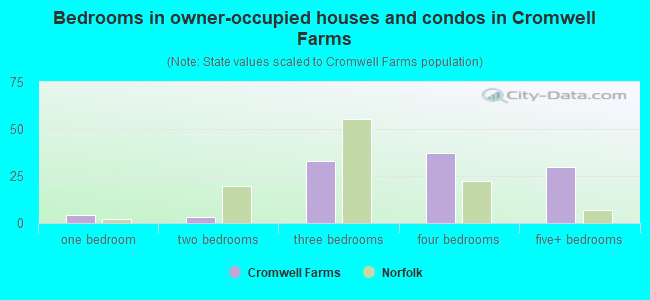
- Bedrooms in owner-occupied houses and condos in Cromwell Farms
- 0no bedroom
- 41 bedroom
- 32 bedrooms
- 333 bedrooms
- 374 bedrooms
- 305+ bedrooms
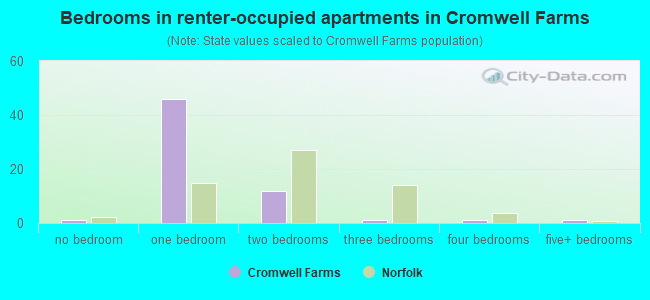
- Bedrooms in renter-occupied apartments in Cromwell Farms
- 1no bedroom
- 461 bedroom
- 122 bedrooms
- 13 bedrooms
- 14 bedrooms
- 15+ bedrooms
Average number of cars or other vehicles available in houses/condos:
Average number of cars or other vehicles available in apartments:
| This neighborhood: | 2.3 |
| Norfolk: | 2.0 |
Average number of cars or other vehicles available in apartments:
| Here: | 0.9 |
| city: | 1.3 |
Percentage of units with a mortgage:
| Cromwell Farms: | 74.4% |
| Norfolk: | 70.0% |
Average estimated value of detached houses in 2022 (66.5% of all units):
| Cromwell Farms: | $590,633 |
| Norfolk: | $337,508 |
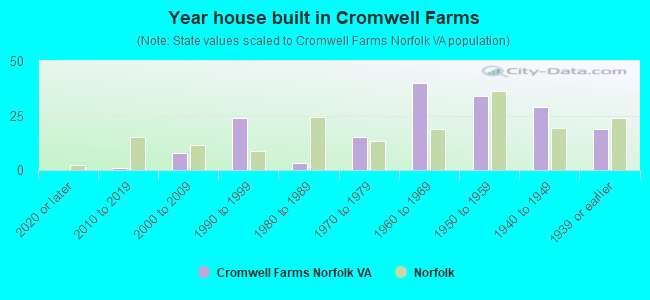
- Year house built in Cromwell Farms
- 02020 or later
- 12010 to 2019
- 82000 to 2009
- 241990 to 1999
- 31980 to 1989
- 151970 to 1979
- 401960 to 1969
- 341950 to 1959
- 291940 to 1949
- 191939 or earlier
City-data.com crime index for city in 2020 (higher means more crime):
| City: | 327.9 |
| U.S. average: | 219.5 |
Travel time to work (commute)
![Travel time to work (commute)]()
- 2Less than 5 minutes
- 115 to 9 minutes
- 2710 to 14 minutes
- 4815 to 19 minutes
- 5120 to 24 minutes
- 925 to 29 minutes
- 2430 to 34 minutes
- 2035 to 39 minutes
- 240 to 44 minutes
- 345 to 59 minutes
- 260 to 89 minutes
- 590 or more minutes

Means of transportation to work
![Means of transportation to work]()
- 88.2%137Drove a car alone
- 1.9%3Carpooled
- 0.6%1Motorcycle
- 0.6%1Bicycle
- 1.3%2Walked
- 1.3%2Other means
- 7.1%11Worked at home

Time leaving home to go to work
![Time leaving home to go to work]()
- 412:00 a.m. to 4:59 a.m.
- 55:00 a.m. to 5:29 a.m.
- 165:30 a.m. to 5:59 a.m.
- 166:00 a.m. to 6:29 a.m.
- 236:30 a.m. to 6:59 a.m.
- 227:00 a.m. to 7:29 a.m.
- 427:30 a.m. to 7:59 a.m.
- 138:00 a.m. to 8:29 a.m.
- 88:30 a.m. to 8:59 a.m.
- 199:00 a.m. to 9:59 a.m.
- 110:00 a.m. to 10:59 a.m.
- 1011:00 a.m. to 11:59 a.m.
- 412:00 p.m. to 3:59 p.m.
- 124:00 p.m. to 11:59 p.m.

Occupations of males:
- Percentage of males in management occupations (except farmers):
Here: 21.3% city: 8.2%
- Percentage of males in business and financial operations occupations:
Here: 6.7% city: 4.4%
- Percentage of males in computer and mathematical occupations:
Here: 7.7% city: 4.2%
- Percentage of males in architecture and engineering occupations:
Here: 4.4% city: 3.7%
- Percentage of males in life, physical, and social science occupations:
Here: 1.4% city: 1.2%
- Percentage of males in community and social services occupations:
Here: 3.8% city: 1.3%
- Percentage of males in legal occupations:
Here: 2.9% city: 1.0%
- Percentage of males in education, training, and library occupations:
Here: 1.8% city: 3.9%
- Percentage of males in healthcare practitioners and technical occupations:
Here: 8.7% city: 3.2%
- Percentage of males in service occupations:
Here: 6.2% city: 16.9%
- Percentage of males in sales and office occupations:
Here: 15.6% city: 15.6%
- Percentage of males in construction, extraction, and maintenance occupations:
Here: 5.9% city: 9.8%
- Percentage of males in production occupations:
Here: 5.9% city: 6.5%
- Percentage of males in material moving occupations:
Here: 6.1% city: 5.3%
Occupations of females:
- Percentage of females in management occupations (except farmers):
Here: 14.0% city: 7.7%
- Percentage of females in business and financial operations occupations:
Here: 6.2% city: 5.2%
- Percentage of females in computer and mathematical occupations:
Here: 11.4% city: 1.7%
- Percentage of females in architecture and engineering occupations:
Here: 1.5% city: 1.0%
- Percentage of females in education, training, and library occupations:
Here: 18.8% city: 9.1%
- Percentage of females in healthcare practitioners and technical occupations:
Here: 32.5% city: 9.6%
- Percentage of females in service occupations:
Here: 7.0% city: 22.3%
- Percentage of females in sales and office occupations:
Here: 13.3% city: 28.7%
- Percentage of females in construction, extraction, and maintenance occupations:
Here: 6.1% city: 0.5%
Percentage of people 16-64 in Armed Forces:
| Cromwell Farms: | 7.9% |
| Norfolk: | 15.8% |
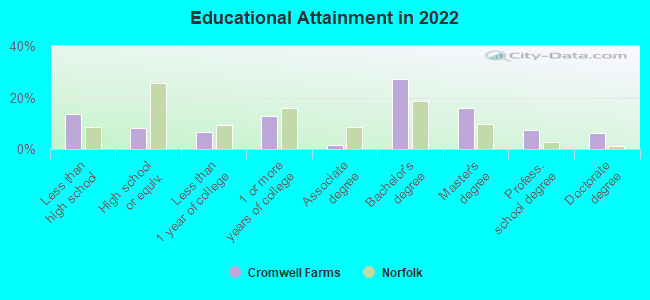
Education in this neighborhood (subdivision or community):
- Percentage of people 3 years and older in K-12 schools:
Cromwell Farms: 17.5% Norfolk: 14.3%
- Percentage of people 3 years and older in undergraduate colleges:
Cromwell Farms: 2.8% Norfolk: 8.0%
- Percentage of people 3 years and older in grad. or professional schools:
Cromwell Farms: 0.9% Norfolk: 2.1%
- Percentage of students K-12 enrolled in private schools:
Cromwell Farms: 45.6% Norfolk: 16.2%
Percentage of population below poverty level:
| Cromwell Farms: | 7.4% |
| Norfolk: | 17.7% |
Median year owner moved in (as recorded in 2022):
Median year renter moved in (as recorded in 2022):
| Cromwell Farms: | 2009 |
| Norfolk: | 2013 |
Median year renter moved in (as recorded in 2022):
| Cromwell Farms: | 2019 |
| Norfolk: | 2020 |
Percentage of married-couple families with both working:
| Cromwell Farms: | 83.0% |
| Norfolk: | 65.5% |
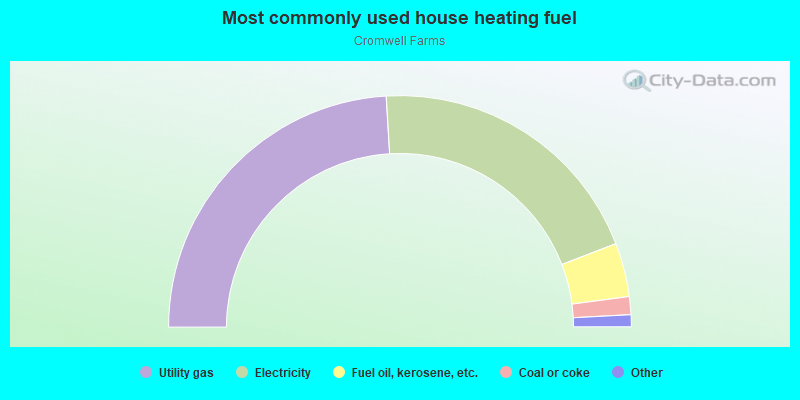
- 48.1%Utility gas
- 40.2%Electricity
- 7.5%Fuel oil, kerosene, etc.
- 2.5%Coal or coke
- 1.0%Other fuel
- 0.8%Bottled, tank, or LP gas
Roads and streets:
Sir Oliver Rd
Length: 0.55 miles
Directions: E-W, N-S, SE-NW, SW-NE
Address range: 200 to 299
Directions: E-W, N-S, SE-NW, SW-NE
Address range: 200 to 299
N Blake Rd
Length: 0.39 miles
Directions: E-W, N-S, SE-NW
Address range: 200 to 299
Directions: E-W, N-S, SE-NW
Address range: 200 to 299
S Blake Rd
Length: 0.31 miles
Directions: E-W, N-S, SE-NW
Address range: 200 to 299
Directions: E-W, N-S, SE-NW
Address range: 200 to 299