Civic Center District neighborhood in Montebello, California (CA), 90640 detailed profile
Settings
X


Business Search - 14 Million verified businesses
Area: 0.587 square miles
Population: 7,160
Population density:
| Civic Center District: | 12,207 people per square mile |
| Montebello: | 7,525 people per square mile |

- 5,49866.8%Hispanic or Latino
- 1,63519.9%Asian
- 7278.8%White
- 2152.6%Two or more races
- 670.8%American Indian
- 610.7%Some other race
- 310.4%Black
- 20.02%Native Hawaiian and Other
Pacific Islander

Distribution of median household income
![Distribution of median household income]()
- 347Less than $10,000
- 386$10,000 to $19,999
- 234$20,000 to $29,999
- 213$30,000 to $39,999
- 342$40,000 to $49,999
- 154$50,000 to $59,999
- 214$60,000 to $74,999
- 307$75,000 to $99,999
- 232$100,000 to $124,999
- 182$125,000 to $149,999
- 314$150,000 to $199,999
- 129$200,000 or more

Distribution of owner-occupied house/condo value
![Distribution of owner-occupied house/condo value]()
- 125$50,000 to $99,999
- 31$100,000 to $149,999
- 59$200,000 to $249,999
- 54$250,000 to $299,999
- 91$300,000 to $399,999
- 116$400,000 to $499,999
- 455$500,000 to $749,999
- 150$750,000 to $999,999
- 337$1,000,000 or more

Distribution of rent paid by renters
![Distribution of rent paid by renters]()
- 112Less than $100
- 282$100 to $199
- 225$200 to $299
- 621$300 to $399
- 135$400 to $499
- 123$500 to $599
- 173$600 to $699
- 48$700 to $799
- 112$800 to $899
- 160$900 to $999
- 208$1,000 to $1,249
- 257$1,250 to $1,499
- 643$1,500 to $1,999
- 441$2,000 or more

Median rent in 2022:
| Civic Center District: | $1,241 |
| Montebello: | $1,596 |
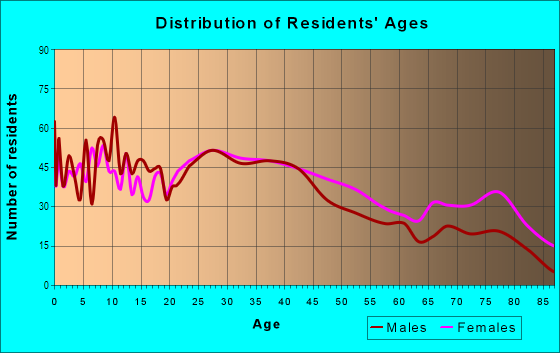
| Males: | 3,504 |
| Females: | 3,655 |
Males:
| This neighborhood: | 38.3 years |
| Whole city: | 37.1 years |
| This neighborhood: | 41.6 years |
| Whole city: | 39.0 years |
Average household size:
| Civic Center District: | 13.1 people |
| Montebello: | 3.2 people |
Percentage of family households:
| Civic Center District: | 43.1% |
| Montebello: | 47.7% |
| Here: | 37.4% |
| Montebello: | 42.2% |
Percentage of married-couple families with children (among all households):
| Civic Center District: | 18.9% |
| Montebello: | 17.4% |
Percentage of single-mother households (among all households):
| Civic Center District: | 9.2% |
| Montebello: | 10.1% |
Percentage of never married males 15 years old and over:
Percentage of never married females 15 years old and over:
| Civic Center District: | 24.6% |
| Montebello: | 23.3% |
Percentage of never married females 15 years old and over:
| Civic Center District: | 18.7% |
| city: | 19.7% |
Percentage of people that speak English not well or not at all:
| Civic Center District: | 14.3% |
| Montebello: | 15.8% |
Percentage of people born in this state:
Percentage of people born in another U.S. state:
Percentage of native residents but born outside the U.S.:
Percentage of foreign born residents:
| Here: | 57.5% |
| Montebello: | 59.4% |
Percentage of people born in another U.S. state:
| Civic Center District: | 3.7% |
| Montebello: | 3.3% |
Percentage of native residents but born outside the U.S.:
| Here: | 2.1% |
| city: | 0.9% |
Percentage of foreign born residents:
| Here: | 36.9% |
| Montebello: | 36.4% |

Owner-occupied
Renter-occupied


- Rooms in owner-occupied houses and condos in Civic Center District
- 01 room
- 02 rooms
- 563 rooms
- 894 rooms
- 2475 rooms
- 1356 rooms
- 3477 rooms
- 728 rooms
- 819+ rooms

- Rooms in renter-occupied apartments in Civic Center District
- 2281 room
- 1382 rooms
- 4143 rooms
- 4854 rooms
- 2225 rooms
- 1256 rooms
- 697 rooms
- 2308 rooms
- 389+ rooms
Owner-occupied
Renter-occupied

- Bedrooms in owner-occupied houses and condos in Civic Center District
- 59no bedroom
- 631 bedroom
- 1462 bedrooms
- 4263 bedrooms
- 2354 bedrooms
- 785+ bedrooms

- Bedrooms in renter-occupied apartments in Civic Center District
- 233no bedroom
- 5991 bedroom
- 6192 bedrooms
- 2123 bedrooms
- 464 bedrooms
- 605+ bedrooms
Average number of cars or other vehicles available in houses/condos:
Average number of cars or other vehicles available in apartments:
| This neighborhood: | 2.4 |
| Montebello: | 2.3 |
Average number of cars or other vehicles available in apartments:
| Here: | 1.6 |
| city: | 1.7 |
Percentage of units with a mortgage:
| Civic Center District: | 57.2% |
| Montebello: | 58.6% |
Average estimated value of detached houses in 2022 (45.6% of all units):
| Civic Center District: | $649,904 |
| Montebello: | $674,911 |

- Year house built in Civic Center District
- 02020 or later
- 852010 to 2019
- 982000 to 2009
- 861990 to 1999
- 3621980 to 1989
- 4371970 to 1979
- 4391960 to 1969
- 4791950 to 1959
- 3881940 to 1949
- 3831939 or earlier

City-data.com crime index for city in 2020 (higher means more crime):
| City: | 189.7 |
| U.S. average: | 219.5 |
Travel time to work (commute)
![Travel time to work (commute)]()
- 118Less than 5 minutes
- 1925 to 9 minutes
- 24410 to 14 minutes
- 30915 to 19 minutes
- 37420 to 24 minutes
- 28025 to 29 minutes
- 46830 to 34 minutes
- 7335 to 39 minutes
- 18540 to 44 minutes
- 30545 to 59 minutes
- 25760 to 89 minutes
- 12790 or more minutes

Means of transportation to work
![Means of transportation to work]()
- 72.7%2,161Drove a car alone
- 14.8%439Carpooled
- 2.8%84Bus
- 1.3%39Long-distance train or commuter rail
- 1.4%41Taxi
- 0.9%28Bicycle
- 4.0%120Walked
- 1.8%54Other means
- 7.8%231Worked at home

Time leaving home to go to work
![Time leaving home to go to work]()
- 31812:00 a.m. to 4:59 a.m.
- 2605:00 a.m. to 5:29 a.m.
- 665:30 a.m. to 5:59 a.m.
- 1686:00 a.m. to 6:29 a.m.
- 1866:30 a.m. to 6:59 a.m.
- 2857:00 a.m. to 7:29 a.m.
- 2947:30 a.m. to 7:59 a.m.
- 3988:00 a.m. to 8:29 a.m.
- 1248:30 a.m. to 8:59 a.m.
- 2599:00 a.m. to 9:59 a.m.
- 9510:00 a.m. to 10:59 a.m.
- 2411:00 a.m. to 11:59 a.m.
- 17612:00 p.m. to 3:59 p.m.
- 1904:00 p.m. to 11:59 p.m.

Occupations of males:
- Percentage of males in management occupations (except farmers):
Here: 5.8% city: 8.6%
- Percentage of males in business and financial operations occupations:
Here: 3.1% city: 3.7%
- Percentage of males in computer and mathematical occupations:
Here: 4.3% city: 3.4%
- Percentage of males in architecture and engineering occupations:
Here: 2.2% city: 1.5%
- Percentage of males in community and social services occupations:
Here: 1.2% city: 1.9%
- Percentage of males in healthcare practitioners and technical occupations:
Here: 3.8% city: 2.9%
- Percentage of males in service occupations:
Here: 15.5% city: 16.2%
- Percentage of males in sales and office occupations:
Here: 15.0% city: 15.3%
- Percentage of males in construction, extraction, and maintenance occupations:
Here: 15.0% city: 8.9%
- Percentage of males in production occupations:
Here: 5.8% city: 8.9%
- Percentage of males in transportation occupations:
Here: 14.0% city: 8.2%
- Percentage of males in material moving occupations:
Here: 7.8% city: 8.1%
Occupations of females:
- Percentage of females in management occupations (except farmers):
Here: 8.6% city: 7.7%
- Percentage of females in business and financial operations occupations:
Here: 6.2% city: 5.0%
- Percentage of females in community and social services occupations:
Here: 7.6% city: 5.0%
- Percentage of females in legal occupations:
Here: 2.2% city: 0.9%
- Percentage of females in education, training, and library occupations:
Here: 4.9% city: 8.4%
- Percentage of females in arts, design, entertainment, sports, and media occupations:
Here: 1.0% city: 1.6%
- Percentage of females in healthcare practitioners and technical occupations:
Here: 2.2% city: 6.0%
- Percentage of females in service occupations:
Here: 21.8% city: 19.0%
- Percentage of females in sales and office occupations:
Here: 30.8% city: 32.5%
- Percentage of females in production occupations:
Here: 3.2% city: 5.3%
- Percentage of females in transportation occupations:
Here: 4.3% city: 1.6%
- Percentage of females in material moving occupations:
Here: 6.8% city: 4.3%
Percentage of people 16-64 in Armed Forces:
| Civic Center District: | 0.8% |
| Montebello: | 0.1% |
Education in this neighborhood (subdivision or community):
- Percentage of people 3 years and older in K-12 schools:
Civic Center District: 21.9% Montebello: 16.4%
- Percentage of people 3 years and older in undergraduate colleges:
Civic Center District: 7.7% Montebello: 7.2%
- Percentage of people 3 years and older in grad. or professional schools:
Civic Center District: 4.9% Montebello: 1.4%
- Percentage of students K-12 enrolled in private schools:
Civic Center District: 21.8% Montebello: 4.8%
Percentage of population below poverty level:
| Civic Center District: | 14.0% |
| Montebello: | 13.0% |
Median year renter moved in (as recorded in 2022):
| Civic Center District: | 2012 |
| Montebello: | 2014 |
Percentage of married-couple families with both working:
| Civic Center District: | 61.8% |
| Montebello: | 64.3% |

- 45.4%Electricity
- 34.6%Utility gas
- 8.3%No fuel used
- 6.7%Bottled, tank, or LP gas
- 4.9%Wood
Roads and streets:
W Beverly Blvd
Length: 2.78 miles
Direction: E-W
Address range: 652 to 2308
Direction: E-W
Address range: 652 to 2308
W Madison Ave
Length: 1.32 miles
Direction: E-W
Address range: 700 to 2303
Direction: E-W
Address range: 700 to 2303
W Cleveland Ave
Length: 1.08 miles
Directions: E-W, N-S
Address range: 700 to 2199
Directions: E-W, N-S
Address range: 700 to 2199
Harding Ave
Length: 0.92 miles
Direction: E-W
Address range: 700 to 2299
Direction: E-W
Address range: 700 to 2299
N Maple Ave
Length: 0.45 miles
Direction: N-S
Address range: 200 to 521
Direction: N-S
Address range: 200 to 521
N Taylor Ave
Length: 0.39 miles
Directions: N-S, SW-NE
Address range: 200 to 566
Directions: N-S, SW-NE
Address range: 200 to 566
N 18th St
Length: 0.38 miles
Direction: N-S
Address range: 200 to 507
Direction: N-S
Address range: 200 to 507
N Wilcox Ave
Length: 0.38 miles
Direction: N-S
Address range: 200 to 505
Direction: N-S
Address range: 200 to 505
N Montebello Blvd
Length: 0.38 miles
Direction: N-S
Address range: 200 to 503
Direction: N-S
Address range: 200 to 503
N 7th St
Length: 0.38 miles
Direction: N-S
Address range: 200 to 499
Direction: N-S
Address range: 200 to 499
N 10th St
Length: 0.38 miles
Direction: N-S
Address range: 200 to 499
Direction: N-S
Address range: 200 to 499
N Vail Ave
Length: 0.38 miles
Direction: N-S
Address range: 200 to 499
Direction: N-S
Address range: 200 to 499
W Beverly Ter
Length: 0.37 miles
Directions: E-W, SE-NW
Address range: 800 to 1599
Directions: E-W, SE-NW
Address range: 800 to 1599
W Harding Ave
Length: 0.37 miles
Direction: E-W
Address range: 1118 to 1699
Direction: E-W
Address range: 1118 to 1699
N 16th St
Length: 0.37 miles
Direction: N-S
Address range: 200 to 499
Direction: N-S
Address range: 200 to 499
N 12th St
Length: 0.32 miles
Direction: N-S
Address range: 200 to 499
Direction: N-S
Address range: 200 to 499
N Spruce St
Length: 0.32 miles
Direction: N-S
Address range: 200 to 499
Direction: N-S
Address range: 200 to 499
Masser Pl
Length: 0.27 miles
Direction: E-W
Address range: 1300 to 1599
Direction: E-W
Address range: 1300 to 1599
N 19th St
Length: 0.26 miles
Direction: N-S
Address range: 300 to 507
Direction: N-S
Address range: 300 to 507
N 21st St
Length: 0.26 miles
Direction: N-S
Address range: 300 to 505
Direction: N-S
Address range: 300 to 505
N 20th St
Length: 0.26 miles
Direction: N-S
Address range: 300 to 507
Direction: N-S
Address range: 300 to 507
Morris Pl
Length: 0.21 miles
Direction: N-S
Address range: 300 to 505
Direction: N-S
Address range: 300 to 505
N Park Ave
Length: 0.19 miles
Direction: N-S
Address range: 200 to 499
Direction: N-S
Address range: 200 to 499
Palm Dr
Length: 0.19 miles
Direction: E-W
Address range: 800 to 899
Direction: E-W
Address range: 800 to 899
Nelson Pl
Length: 0.13 miles
Direction: N-S
Address range: 200 to 299
Direction: N-S
Address range: 200 to 299
N Greenwood Ave
Length: 0.13 miles
Direction: N-S
Address range: 300 to 399
Direction: N-S
Address range: 300 to 399
Rubidoux St
Length: 0.13 miles
Direction: N-S
Address range: 300 to 399
Direction: N-S
Address range: 300 to 399
Via Corona
Length: 0.12 miles
Direction: E-W
Address range: 2200 to 2299
Direction: E-W
Address range: 2200 to 2299
Sheila Ct
Length: 0.11 miles
Direction: E-W
Address range: 1000 to 1199
Direction: E-W
Address range: 1000 to 1199
Palm Pl
Length: 0.10 miles
Directions: E-W, N-S, SW-NE
Address range: 200 to 299
Directions: E-W, N-S, SW-NE
Address range: 200 to 299
Maple Pl
Length: 0.07 miles
Direction: N-S
Address range: 200 to 299
Direction: N-S
Address range: 200 to 299
Howard Ave
Length: 0.07 miles
Direction: N-S
Address range: 500 to 554
Direction: N-S
Address range: 500 to 554
Woodland Ct
Length: 0.03 miles
Direction: N-S
Address range: 200 to 299
Direction: N-S
Address range: 200 to 299