Chestnut neighborhood in Austin, Texas (TX), 78702 detailed profile
Settings
X


Business Search - 14 Million verified businesses
Area: 0.281 square miles
Population: 2,672
Population density:
| Chestnut: | 9,504 people per square mile |
| Austin: | 3,878 people per square mile |

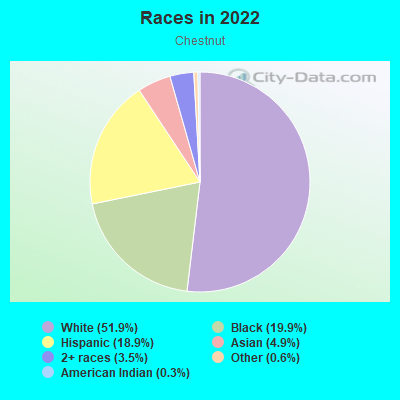
- 1,39951.9%White
- 53719.9%Black
- 50918.9%Hispanic or Latino
- 1324.9%Asian
- 943.5%Two or more races
- 170.6%Some other race
- 70.3%American Indian
Distribution of median household income
![Distribution of median household income]()
- 20Less than $10,000
- 207$10,000 to $19,999
- 25$20,000 to $29,999
- 79$30,000 to $39,999
- 82$40,000 to $49,999
- 117$50,000 to $59,999
- 139$60,000 to $74,999
- 272$75,000 to $99,999
- 148$100,000 to $124,999
- 138$125,000 to $149,999
- 160$150,000 to $199,999
- 207$200,000 or more

Distribution of owner-occupied house/condo value
![Distribution of owner-occupied house/condo value]()
- 48Less than $50,000
- 10$50,000 to $99,999
- 13$100,000 to $149,999
- 5$150,000 to $199,999
- 39$200,000 to $249,999
- 32$250,000 to $299,999
- 169$300,000 to $399,999
- 32$400,000 to $499,999
- 265$500,000 to $749,999
- 123$750,000 to $999,999
- 59$1,000,000 or more

Distribution of rent paid by renters
![Distribution of rent paid by renters]()
- 34Less than $100
- 38$100 to $199
- 80$200 to $299
- 101$300 to $399
- 38$400 to $499
- 16$500 to $599
- 39$600 to $699
- 21$700 to $799
- 82$800 to $899
- 16$900 to $999
- 44$1,000 to $1,249
- 131$1,250 to $1,499
- 383$1,500 to $1,999
- 308$2,000 or more

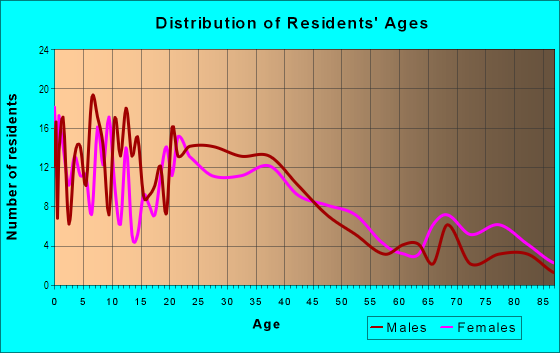
| Males: | 1,414 |
| Females: | 1,258 |
Males:
| This neighborhood: | 33.7 years |
| Whole city: | 34.5 years |
| This neighborhood: | 38.5 years |
| Whole city: | 34.4 years |
Average household size:
| Chestnut: | 6.5 people |
| Austin: | 28.0 people |
Percentage of family households:
| Chestnut: | 24.9% |
| Austin: | 36.6% |
| Here: | 22.7% |
| Austin: | 35.3% |
Percentage of married-couple families with children (among all households):
| Chestnut: | 49.0% |
| Austin: | 36.3% |
Percentage of single-mother households (among all households):
| Chestnut: | 7.5% |
| Austin: | 7.9% |
Percentage of never married males 15 years old and over:
Percentage of never married females 15 years old and over:
| Chestnut: | 34.7% |
| Austin: | 25.0% |
Percentage of never married females 15 years old and over:
| Chestnut: | 22.0% |
| city: | 19.9% |
Percentage of people that speak English not well or not at all:
| Chestnut: | 1.4% |
| Austin: | 5.2% |
Percentage of people born in this state:
Percentage of people born in another U.S. state:
Percentage of native residents but born outside the U.S.:
Percentage of foreign born residents:
| Here: | 39.2% |
| Austin: | 48.2% |
Percentage of people born in another U.S. state:
| Chestnut: | 48.7% |
| Austin: | 31.8% |
Percentage of native residents but born outside the U.S.:
| Here: | 3.0% |
| city: | 2.3% |
Percentage of foreign born residents:
| Here: | 9.1% |
| Austin: | 17.8% |
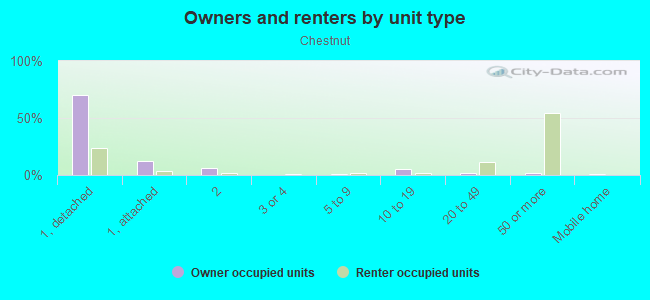
Owner-occupied
Renter-occupied

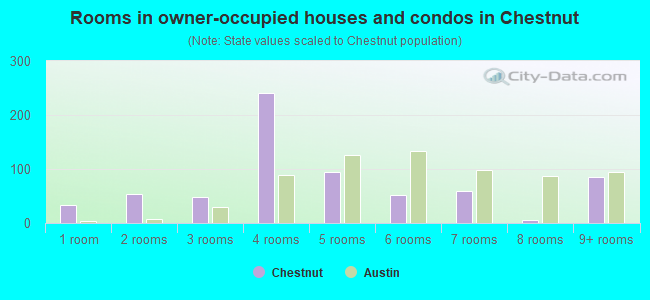
- Rooms in owner-occupied houses and condos in Chestnut
- 341 room
- 542 rooms
- 483 rooms
- 2404 rooms
- 945 rooms
- 516 rooms
- 597 rooms
- 68 rooms
- 859+ rooms
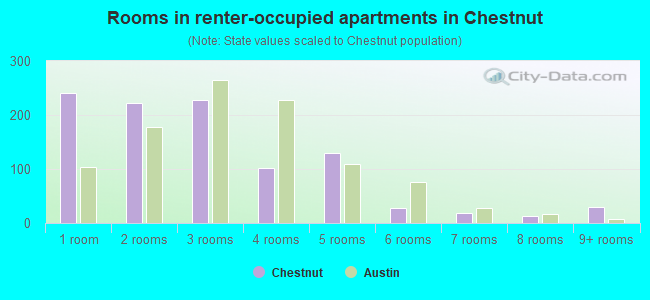
- Rooms in renter-occupied apartments in Chestnut
- 2401 room
- 2222 rooms
- 2273 rooms
- 1014 rooms
- 1295 rooms
- 276 rooms
- 197 rooms
- 138 rooms
- 309+ rooms
Owner-occupied
Renter-occupied
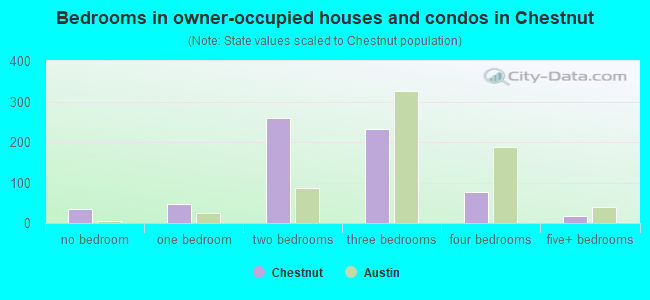
- Bedrooms in owner-occupied houses and condos in Chestnut
- 34no bedroom
- 481 bedroom
- 2592 bedrooms
- 2333 bedrooms
- 774 bedrooms
- 175+ bedrooms

- Bedrooms in renter-occupied apartments in Chestnut
- 240no bedroom
- 2871 bedroom
- 3102 bedrooms
- 1183 bedrooms
- 494 bedrooms
- 05+ bedrooms
Average number of cars or other vehicles available in houses/condos:
Average number of cars or other vehicles available in apartments:
| This neighborhood: | 1.3 |
| Austin: | 1.9 |
Average number of cars or other vehicles available in apartments:
| Here: | 1.4 |
| city: | 1.3 |
Percentage of units with a mortgage:
| Chestnut: | 56.6% |
| Austin: | 68.5% |
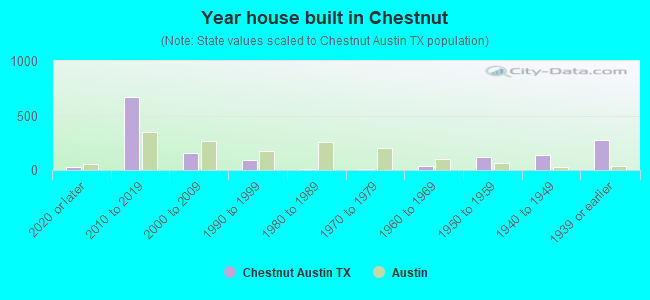
- Year house built in Chestnut
- 232020 or later
- 6702010 to 2019
- 1562000 to 2009
- 881990 to 1999
- 121980 to 1989
- 91970 to 1979
- 351960 to 1969
- 1151950 to 1959
- 1341940 to 1949
- 2771939 or earlier
City-data.com crime index for city in 2020 (higher means more crime):
| City: | 316.8 |
| U.S. average: | 219.5 |
Travel time to work (commute)
![Travel time to work (commute)]()
- 7Less than 5 minutes
- 1805 to 9 minutes
- 29110 to 14 minutes
- 27715 to 19 minutes
- 12620 to 24 minutes
- 9425 to 29 minutes
- 20630 to 34 minutes
- 735 to 39 minutes
- 4140 to 44 minutes
- 6245 to 59 minutes
- 11560 to 89 minutes
- 1690 or more minutes

Means of transportation to work
![Means of transportation to work]()
- 60.0%1,288Drove a car alone
- 3.7%79Carpooled
- 2.0%43Bus
- 1.3%27Long-distance train or commuter rail
- 0.8%18Light rail, streetcar or trolley
- 0.4%9Taxi
- 1.2%26Motorcycle
- 6.1%130Bicycle
- 2.7%57Walked
- 2.8%60Other means
- 26.1%560Worked at home

Time leaving home to go to work
![Time leaving home to go to work]()
- 8112:00 a.m. to 4:59 a.m.
- 75:00 a.m. to 5:29 a.m.
- 225:30 a.m. to 5:59 a.m.
- 196:00 a.m. to 6:29 a.m.
- 26:30 a.m. to 6:59 a.m.
- 1057:00 a.m. to 7:29 a.m.
- 2477:30 a.m. to 7:59 a.m.
- 1438:00 a.m. to 8:29 a.m.
- 2828:30 a.m. to 8:59 a.m.
- 1179:00 a.m. to 9:59 a.m.
- 7410:00 a.m. to 10:59 a.m.
- 12512:00 p.m. to 3:59 p.m.
- 1644:00 p.m. to 11:59 p.m.

Occupations of males:
- Percentage of males in management occupations (except farmers):
Here: 13.4% city: 15.3%
- Percentage of males in business and financial operations occupations:
Here: 10.4% city: 7.0%
- Percentage of males in computer and mathematical occupations:
Here: 10.9% city: 12.0%
- Percentage of males in architecture and engineering occupations:
Here: 2.5% city: 5.1%
- Percentage of males in life, physical, and social science occupations:
Here: 5.1% city: 1.3%
- Percentage of males in legal occupations:
Here: 1.4% city: 1.9%
- Percentage of males in education, training, and library occupations:
Here: 5.6% city: 4.1%
- Percentage of males in arts, design, entertainment, sports, and media occupations:
Here: 6.4% city: 4.1%
- Percentage of males in healthcare practitioners and technical occupations:
Here: 2.6% city: 2.3%
- Percentage of males in service occupations:
Here: 6.7% city: 11.2%
- Percentage of males in sales and office occupations:
Here: 13.6% city: 14.9%
- Percentage of males in construction, extraction, and maintenance occupations:
Here: 3.0% city: 7.1%
- Percentage of males in production occupations:
Here: 3.3% city: 3.4%
- Percentage of males in transportation occupations:
Here: 7.9% city: 3.7%
- Percentage of males in material moving occupations:
Here: 4.4% city: 2.8%
Occupations of females:
- Percentage of females in management occupations (except farmers):
Here: 21.2% city: 13.5%
- Percentage of females in business and financial operations occupations:
Here: 20.3% city: 11.0%
- Percentage of females in computer and mathematical occupations:
Here: 7.1% city: 4.0%
- Percentage of females in architecture and engineering occupations:
Here: 2.7% city: 1.6%
- Percentage of females in life, physical, and social science occupations:
Here: 1.7% city: 1.7%
- Percentage of females in legal occupations:
Here: 4.7% city: 2.4%
- Percentage of females in education, training, and library occupations:
Here: 10.6% city: 9.0%
- Percentage of females in arts, design, entertainment, sports, and media occupations:
Here: 3.0% city: 4.5%
- Percentage of females in healthcare practitioners and technical occupations:
Here: 1.2% city: 7.8%
- Percentage of females in service occupations:
Here: 3.8% city: 15.8%
- Percentage of females in sales and office occupations:
Here: 15.9% city: 22.9%
- Percentage of females in production occupations:
Here: 6.6% city: 1.5%
- Percentage of females in transportation occupations:
Here: 1.2% city: 0.8%
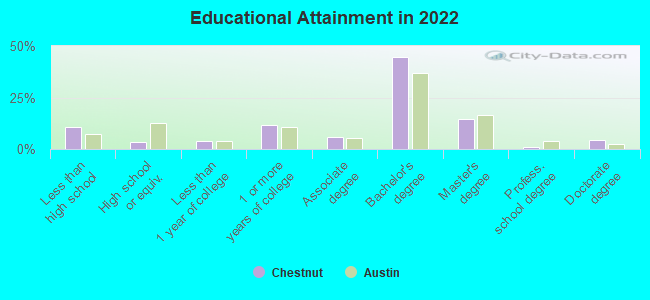
Education in this neighborhood (subdivision or community):
- Percentage of people 3 years and older in K-12 schools:
Chestnut: 6.0% Austin: 12.4%
- Percentage of people 3 years and older in undergraduate colleges:
Chestnut: 4.3% Austin: 6.1%
- Percentage of people 3 years and older in grad. or professional schools:
Chestnut: 8.8% Austin: 2.5%
- Percentage of students K-12 enrolled in private schools:
Chestnut: 78.8% Austin: 11.8%
Percentage of population below poverty level:
| Chestnut: | 11.0% |
| Austin: | 11.1% |
Median year owner moved in (as recorded in 2022):
Median year renter moved in (as recorded in 2022):
| Chestnut: | 2009 |
| Austin: | 2013 |
Median year renter moved in (as recorded in 2022):
| Chestnut: | 2013 |
| Austin: | 2021 |
Percentage of married-couple families with both working:
| Chestnut: | 100.0% |
| Austin: | 68.5% |
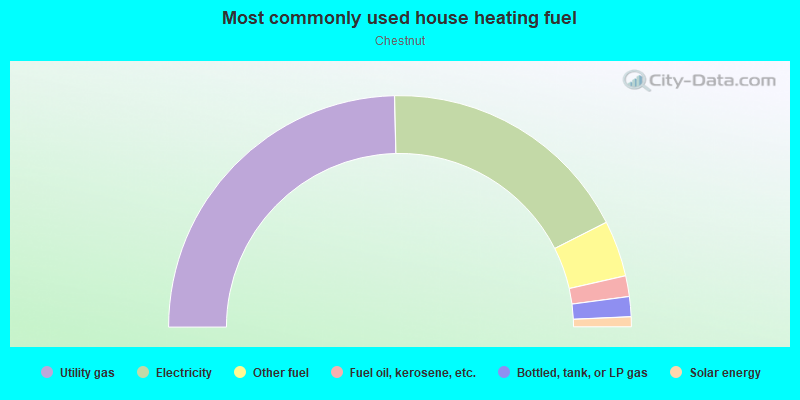
- 49.2%Utility gas
- 35.8%Electricity
- 7.8%Other fuel
- 2.9%Fuel oil, kerosene, etc.
- 2.8%Bottled, tank, or LP gas
- 1.4%Solar energy
Roads and streets:
E 16th St
Length: 0.61 miles
Direction: E-W
Address range: 1908 to 2899
Direction: E-W
Address range: 1908 to 2899
E 17th St
Length: 0.59 miles
Directions: E-W, SE-NW
Address range: 2000 to 2899
Directions: E-W, SE-NW
Address range: 2000 to 2899
E 14th St
Length: 0.58 miles
Direction: E-W
Address range: 2000 to 2899
Direction: E-W
Address range: 2000 to 2899
E 12th St
Length: 0.55 miles
Direction: E-W
Address range: 2000 to 2799
Direction: E-W
Address range: 2000 to 2799
E 13th St
Length: 0.55 miles
Direction: E-W
Address range: 2000 to 2899
Direction: E-W
Address range: 2000 to 2899
E 18th St
Length: 0.53 miles
Direction: E-W
Address range: 2100 to 2899
Direction: E-W
Address range: 2100 to 2899
Poquito St
Length: 0.36 miles
Direction: N-S
Address range: 1200 to 1799
Direction: N-S
Address range: 1200 to 1799
Chestnut Ave
Length: 0.35 miles
Direction: N-S
Address range: 1200 to 1799
Direction: N-S
Address range: 1200 to 1799
Singleton Ave
Length: 0.35 miles
Direction: N-S
Address range: 1200 to 1799
Direction: N-S
Address range: 1200 to 1799
Maple Ave
Length: 0.35 miles
Direction: N-S
Address range: 1200 to 1799
Direction: N-S
Address range: 1200 to 1799
Walnut Ave
Length: 0.34 miles
Direction: N-S
Address range: 1200 to 1799
Direction: N-S
Address range: 1200 to 1799
Cedar Ave
Length: 0.34 miles
Direction: N-S
Address range: 1200 to 1799
Direction: N-S
Address range: 1200 to 1799
Alamo St
Length: 0.27 miles
Direction: N-S
Address range: 1200 to 1699
Direction: N-S
Address range: 1200 to 1699
Coleto St
Length: 0.21 miles
Direction: N-S
Address range: 1200 to 1499
Direction: N-S
Address range: 1200 to 1499
Ulit Ave
Length: 0.20 miles
Direction: N-S
Address range: 1400 to 1799
Direction: N-S
Address range: 1400 to 1799
Miriam Ave
Length: 0.14 miles
Direction: N-S
Address range: 1600 to 1799
Direction: N-S
Address range: 1600 to 1799
Macaroni St
Length: 0.05 miles
Direction: N-S
Address range: 1700 to 1799
Direction: N-S
Address range: 1700 to 1799
Railroad features:
Southern Pacific RR
Length: 0.18 miles
Direction: N-S
Direction: N-S
Other features:
Boggy Crk
Length: 0.04 miles
Direction: N-S
Direction: N-S